
Market Overview
| Study Period | 2021 - 2031 |
|---|---|
| Forecast Data Period | 2026 - 2031 |
| Base Year Market Size (2025) | USD 41.96 Billion |
| Market Size (2026) | USD 44.13 Billion |
| Market Size (2031) | USD 56.78 Billion |
| Growth Rate (2026 - 2031) | 5.17 % |
| Market Concentration | Medium |
Major Players
*Disclaimer: Major Players sorted in no particular order Image © Mordor Intelligence. Reuse requires attribution under CC BY 4.0. |
|
North America Coffee Market Analysis by Mordor Intelligence
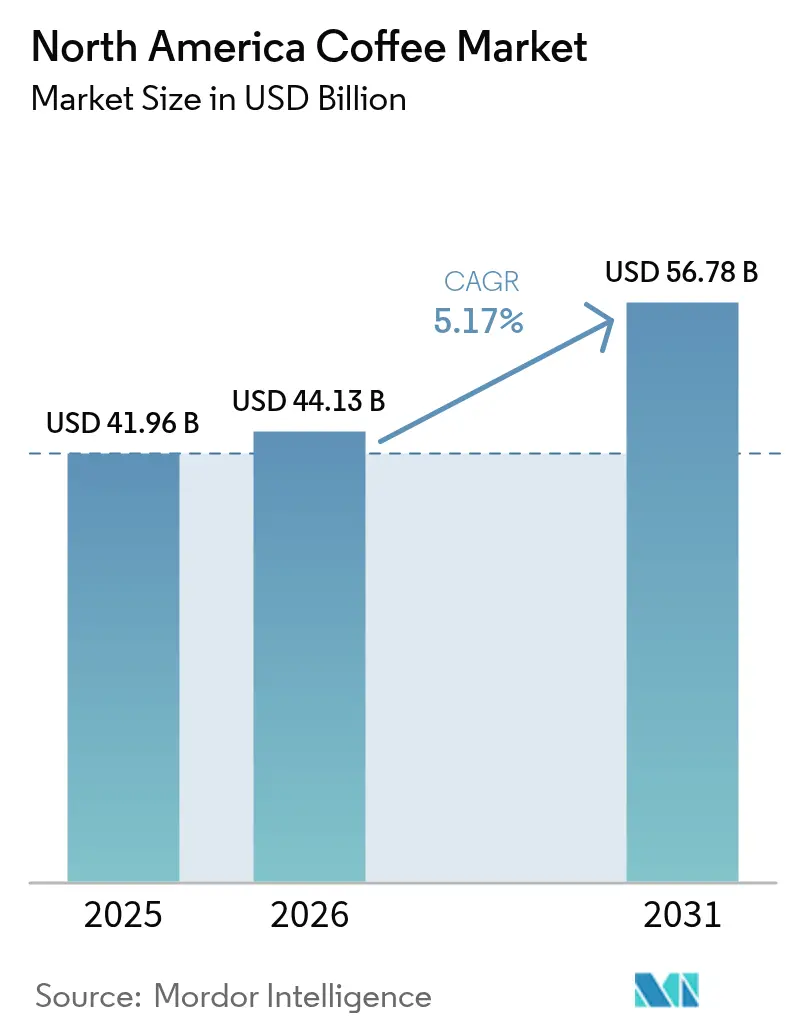
The North America coffee market size was valued at USD 41.96 billion in 2025 and estimated to grow from USD 44.13 billion in 2026 to reach USD 56.78 billion by 2031, at a CAGR of 5.17% during the forecast period (2026-2031). Daily coffee consumption, peaking at a two-decade high of 66-67% in 2024, underscores a robust demand. This demand persists even as foot traffic to major café chains wanes, hinting at a consumer pivot towards premium offerings, home brewing, and health-centric benefits. It's no longer just about volume; the product mix is paramount. Specialty beans, ready-to-drink (RTD) coffee, and health-focused add-ins are commanding premium prices. Brands are sharpening their focus on omnichannel distribution, unique brewing systems, and transparent supply chains. However, they grapple with challenges like the volatility of green coffee prices and the environmental concerns surrounding single-serve pods. In this evolving landscape, North America's coffee market is increasingly favoring brands that adeptly merge premium offerings with convenience, sustainability, and personalized, data-driven approaches.
Key Report Takeaways
- By product type, instant coffee led with 42.85% of the North America coffee market share in 2025, while RTD coffee is forecast to grow at a 7.12% CAGR through 2031.
- By category, conventional coffee accounted for 63.70% of the North America coffee market size in 2025, whereas specialty coffee is projected to advance at an 7.86% CAGR to 2031.
- By coffee species, Arabica commanded 69.55% share of the North America coffee market size in 2025; Liberica is set to expand at a 6.62% CAGR through 2031.
- By distribution channel, off-trade outlets captured 67.45% of the North America coffee market share in 2025, but on-trade sales are expected to rise at a 6.98% CAGR over the forecast period.
- By geography, the United States generated 74.60% of 2025 revenue, while Mexico shows the fastest growth at a 6.61% CAGR to 2031.
Note: Market size and forecast figures in this report are generated using Mordor Intelligence’s proprietary estimation framework, updated with the latest available data and insights as of 2026.
Market Trends and Insights
Drivers Impact Analysis of North America Coffee Market*
| Drivers | (~) % Impact on CAGR Forecast | Geographic Relevance | Impact Timeline |
|---|---|---|---|
| Rising interest in "better-for-you" coffee | +0.8% | United States, Canada, urban Mexico | Medium term (2-4 years) |
| Rising demand for convenience options such as single-serve pods, RTD coffees | +1.2% | United States, Canada | Short term (≤ 2 years) |
| Increasing consumer focus on ethical, sustainable, and traceable sourcing | +0.6% | United States, Canada, select Mexico metros | Long term (≥ 4 years) |
| Continuous innovation in flavors and formats | +0.9% | United States, Canada, Mexico | Short term (≤ 2 years) |
| Expansion of café culture and specialty coffee shops | +0.7% | United States, Canada, Mexico City, Monterrey | Medium term (2-4 years) |
| Growing adoption of home brewing technology | +0.5% | United States, Canada | Medium term (2-4 years) |
| Source: Mordor Intelligence | |||
Rising Interest in "Better-for-You" Coffee
Functional coffee has evolved from a niche wellness product to a popular choice, as consumers increasingly look for added health benefits in their daily routines. In June 2024, Laird Superfood introduced its Protein Instant Latte, which provides 10 grams of plant-based protein per serving. This product also includes MCTs and a blend of functional mushrooms such as lion's mane, cordyceps, maitake, and chaga, offering a combination of convenience, natural ingredients, and cognitive support. Priced at approximately USD 3 per serving, it is positioned between premium coffee-shop offerings and basic instant coffee, demonstrating how functional benefits can justify higher pricing. Coffee brands are leveraging this research to differentiate their creamers and ready-to-drink (RTD) beverages. This trend is no longer limited to specialty health-food stores. Retailers like Sprouts Farmers Market and Amazon now carry functional coffee products, reflecting their growing acceptance and wider availability in the market.
Rising Demand for Convenience Options Such as Single-Serve Pods, RTD Coffees
Rising demand for convenience-centric formats such as single-serve pods and ready-to-drink coffees is becoming a key growth driver for the North America coffee market, as consumers increasingly prioritize speed, portability, and consistent quality. Single-serve pod systems offer customized brewing with minimal effort, appealing to busy households and workplaces seeking café-style beverages at home. RTD coffees continue to expand rapidly due to their on-the-go functionality and alignment with health trends, with brands introducing low-sugar, functional, and protein-enhanced variants. This shift is also reinforced by younger consumers who prefer grab-and-go options over traditional brewed coffee. Manufacturers are responding with wider flavor ranges, premium formulations, and sustainable packaging innovations. Overall, the convenience trend is reshaping product innovation, retail shelf allocation, and consumption habits across the region.
Increasing Consumer Focus on Ethical, Sustainable, and Traceable Sourcing
Traceability and sustainability certifications have shifted from niche differentiators to essential expectations for mainstream consumers, particularly Millennials and Gen Z. Starbucks sources 98.6% of its coffee through its C.A.F.E. Practices program, which audits economic, social, and environmental criteria. The company has also committed USD 100 million to its Global Farmer Fund to support coffee farmers with loans. Nestlé's Nespresso operates its AAA Sustainable Quality Program in 15 countries, embedding agronomists in farming communities to improve yields, quality, and resilience, while promoting regenerative agriculture. In 2024, Mexico launched the Café Bienestar brand to support smallholders, who produce 90% of the country’s 231,596 tons of annual coffee output, with farms averaging 2.9 hectares[1]U.S. Department of Agriculture Foreign Agricultural Service. "Coffee: World Markets and Trade Reports 2024-2025." fas.usda.gov. This initiative highlights the need for public-private partnerships to address supply chain vulnerabilities from consolidation and climate risks. Certifications like Fair Trade USA and Rainforest Alliance remain common, but consumer decisions are increasingly influenced by transparency tools such as blockchain traceability and QR codes linking to farm-level data. Specialty roasters use these tools to justify premium pricing and build customer loyalty.
Continuous Innovation in Flavors and Formats
Flavor innovation is moving beyond seasonal editions to structural changes that redefine consumption. In March 2024, Chameleon Organic Coffee launched 8-ounce shelf-stable cold-brew cans, including a Nitro Black variant with a cascading texture that doesn’t require refrigeration, making it suitable for gas stations, vending machines, and non-refrigerated retail spaces. Costa Coffee, owned by Coca-Cola, introduced 11-ounce Iced Coffee Lattes at 7-Eleven and QuikTrip in 2024, leveraging Coca-Cola’s delivery network to place them near energy drinks and sodas for impulse purchases. Throne Sport Coffee, co-founded by NFL quarterback Patrick Mahomes, debuted a ready-to-drink line with electrolytes and branched-chain amino acids, positioning coffee as a pre- or post-workout beverage. Natural sweeteners like stevia and monk fruit are replacing sugar and artificial alternatives, appealing to health-conscious consumers. Oat milk remains the top non-dairy choice in Canada, with Starbucks adding Oatmilk Frappuccino to its ready-to-drink lineup in March 2024 to meet the growing demand for plant-based options. These trends are shortening product life cycles and pushing supply chains to adapt quickly. Larger players with co-manufacturing networks are better positioned to respond, while smaller roasters relying on third-party bottlers face challenges.
Restraints Impact Analysis of North America Coffee Market*
| Restraint | (~) % Impact on CAGR Forecast | Geographic Relevance | Impact Timeline |
|---|---|---|---|
| Competition from substitute beverages and functional drinks | -0.6% | United States, Canada | Short term (≤ 2 years) |
| Supply-chain/logistics bottlenecks | -0.5% | United States, Canada, Mexico | Short term (≤ 2 years) |
| Health concerns over caffeine and sugar | -0.3% | United States, Canada | Medium term (2-4 years) |
| Detrimental impact of coffee pods and capsules on the environment | -0.4% | United States, Canada | Long term (≥ 4 years) |
| Source: Mordor Intelligence | |||
Competition from substitute beverages and functional drinks
Competition from substitute beverages and functional drinks is increasingly restraining growth in the North America coffee market, as consumers diversify their beverage choices toward options promising added health or performance benefits. Energy drinks, functional teas, enhanced waters, and nootropic beverages attract younger demographics seeking convenience and targeted outcomes like focus, hydration, or sustained energy. This broadening landscape fragments consumer attention and reduces reliance on traditional coffee, especially in afternoon and on-the-go occasions. The rise of plant-based and low-caffeine alternatives also appeals to health-conscious segments that perceive coffee as acidic or overstimulating. As a result, brands face heightened pressure to innovate with functional ingredients, cleaner labels, and differentiated formats.
Detrimental Impact of Coffee Pods and Capsules on the Environment
In the United States, around 50-60 million coffee pods are discarded or recycled daily, but globally, only 30% of Nespresso's aluminum capsules are recycled. Keurig's 2020 switch to #5 plastics for its K-Cups has not resolved inconsistent municipal acceptance. Nespresso provides a mail-back program with prepaid UPS labels and 88,000 drop-off points, yet just 36% of U.S. users recycle their capsules, indicating that convenience and awareness remain challenges. Keurig's new compostable, plastic-free K-Rounds require a new brewer, creating a financial barrier for many consumers. Emerging extended producer responsibility (EPR) regulations are pushing manufacturers to fund recycling infrastructure, which could reduce profit margins unless offset by higher prices or waste-reducing innovations. Nespresso has increased its capsule content to 80-85% recycled aluminum and supports shared recycling systems, but fragmented materials and brand-specific designs complicate collaboration. Environmental concerns over coffee pods are not just reputational; they bring regulatory risks, consumer dissatisfaction, and competition from reusable pods and drip machines, which Consumer Reports highlights as more cost-effective and environmentally friendly alternatives.
*Our forecasts treat driver/restraint impacts as directional, not additive. The impact forecasts reflect baseline growth, mix effects, and variable interactions.
North America Coffee Market Segment Analysis
By Product Type:
Instant Coffee Anchors Share, RTD Coffee Drives GrowthIn 2025, instant coffee held 42.85% of the market share, driven by strong demand from Hispanic households, where 84% in Mexico prefer instant formats, and older consumers who value speed and shelf stability. Leading brands like Nestlé's Nescafé and Starbucks VIA use freeze-dried and spray-dried technologies to retain aroma and enable preparation in under 30 seconds. While volume growth remains flat, premiumization drives value growth, with single-origin and micro-lot freeze-dried coffees priced 20-30% higher than standard blends. Ground and whole-bean coffee target similar demographics but differ in preferences. Whole-bean buyers, often specialty coffee enthusiasts, prioritize freshness and terroir, while ground coffee appeals to convenience-focused households using drip machines. Coffee pods and capsules face challenges like environmental concerns and rising material costs, but Keurig's K-Cup and Nespresso's aluminum capsules retain customer loyalty through brewer compatibility and consistent quality.
Ready-to-drink (RTD) coffee is the fastest-growing segment, with a 7.12% CAGR through 2031, driven by new formats and expanded distribution in convenience stores, gas stations, and vending machines. In March 2024, Starbucks launched multi-serve cold-brew bottles to target households, offering lower per-ounce costs compared to single-serve cans and competing with at-home brewing. Chameleon's shelf-stable cold-brew cans, with a 12-month shelf life, reduce refrigeration needs, cut distributor costs, and improve inventory turnover. Costa Coffee's 11-ounce Iced Coffee Lattes, placed in 7-Eleven and QuikTrip stores through Coca-Cola's direct-store-delivery network, capture impulse purchases by positioning near energy drinks. Nitro cold brew, infused with nitrogen for a creamy texture without dairy, has moved from specialty cafés to RTD cans, led by brands like La Colombe and Chameleon. RTD coffee growth depends on maintaining café-quality taste while managing costs for aseptic packaging, cold-chain logistics, and retail placement, favoring companies with strong co-packing and distribution capabilities.




By Category:
Conventional Coffee Holds Volume, Specialty Coffee Captures ValueIn 2025, conventional coffee dominated 63.70% of the market share, driven by its strong presence in grocery, club, and discount channels where affordability is key. Leading brands like Folgers, Maxwell House, and Dunkin' rely on extensive distribution, frequent promotions, and long-standing brand recognition. These brands achieve consistent flavor profiles through supply-chain efficiencies, blending multiple origins at scale, and benefit from lower marketing costs compared to specialty roasters. However, younger consumers, entering peak coffee-drinking years, show less loyalty to conventional brands and prefer experimenting with specialty and direct-to-consumer options. To adapt, conventional players are introducing premium sub-brands and limited-edition blends to protect shelf space and boost margins without affecting core products.
Specialty coffee is projected to grow at an 7.86% CAGR through 2031, the fastest among all segments, as third-wave roasters expand into retail and e-commerce. Defined by the Specialty Coffee Association as scoring above 80 on a 100-point scale, specialty coffee emphasizes origin transparency, processing, and precise roasting. In 2024, Blue Bottle Coffee, owned by Nestlé, expanded its e-commerce and subscription services, using data analytics to personalize recommendations and automate orders, increasing customer retention and value. Intelligentsia and La Colombe have entered mainstream retail through Whole Foods, Target, and regional chains, making specialty coffee more accessible. Single-origin coffees from Ethiopia, Colombia, and Guatemala, priced at USD 15-25 per 12-ounce bag, remain popular among Millennials and Gen Z, who value coffee as an experience and prioritize certifications like Fair Trade and Rainforest Alliance. Specialty roasters also benefit from direct-trade relationships, ensuring supply, enhancing traceability, and capturing margins typically taken by intermediaries.
By Coffee Species:
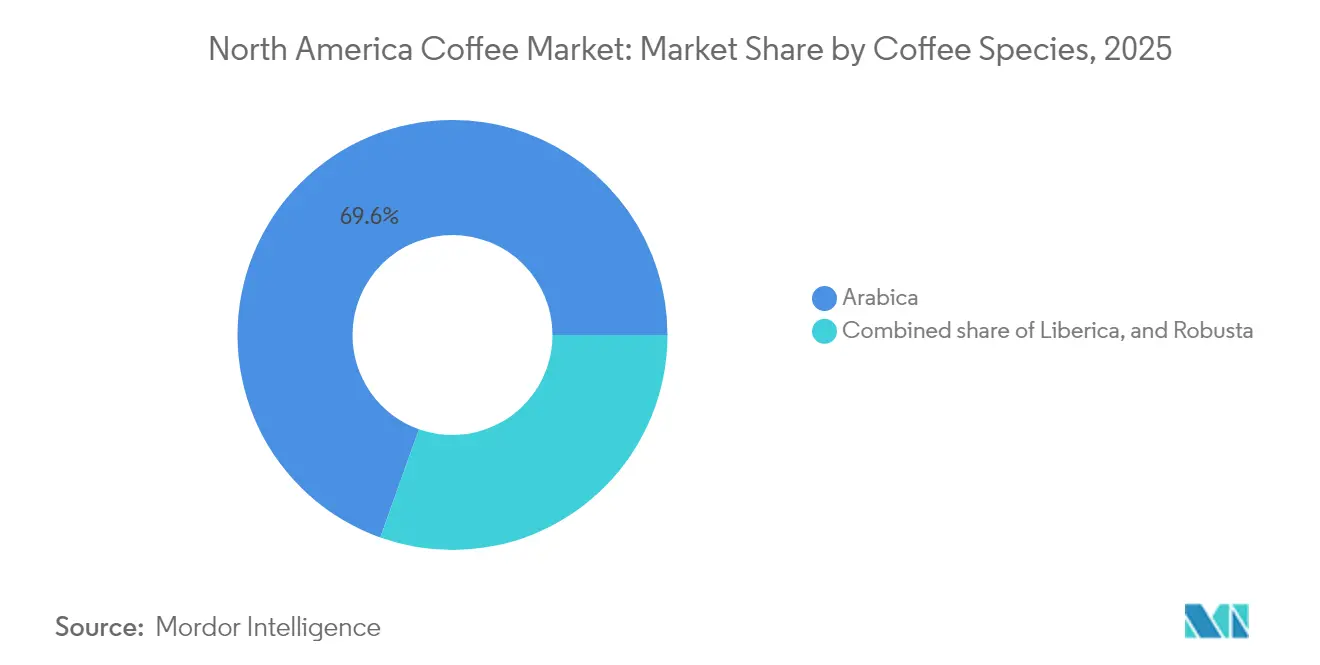
Arabica Dominates, Liberica Emerges as Differentiation PlayIn 2025, Arabica held a 69.55% market share, driven by North America's preference for its balanced acidity, sweetness, and aromatic complexity compared to Robusta's bitter and earthy profile. Colombia, Brazil, and Central America dominate Arabica's supply, with Colombia alone contributing 38.2% of Canada's green coffee imports in June 2024. Arabica's premium pricing, 20-40% higher than Robusta, reflects its higher production costs due to lower yields and greater vulnerability to pests and climate change, alongside consumer demand for quality. Specialty roasters exclusively use Arabica, sourcing micro-lots from estates or cooperatives to highlight terroir, supporting retail prices above USD 20 for a 12-ounce bag. Its dominance is reinforced by strong supply chains, cupping standards, and marketing, though climate change threatens key growing regions in Colombia and Central America by reducing suitable farmland and increasing disease risks.
Liberica, primarily grown in the Philippines, Malaysia, and West Africa, is the fastest-growing coffee species with a 6.62% CAGR through 2031, albeit from a small base. Its unique woody, floral, and smoky flavor appeals to adventurous consumers, but its growth is limited by low production (less than 2% of global output) and consumer unfamiliarity. Specialty roasters leverage its rarity to command premium prices and generate social media interest, branding it as a sophisticated discovery product. Robusta, which makes up the remaining market share, is widely used in instant coffee, espresso blends (for body and crema), and budget-friendly products. While its share is stable, Robusta faces challenges from premiumization trends favoring Arabica and sustainability concerns due to intensive agrochemical use and traceability issues in Vietnam and Brazil. Mexico’s PROSEC tariff program facilitates Robusta imports from Brazil and Vietnam for cost-effective products, but domestic roasters are increasingly promoting single-origin Arabica to capture higher-margin specialty demand.
By Distribution Channel:
Off-Trade Leads Volume, On-Trade Reclaims OccasionsIn 2025, off-trade channels held 67.45% of the market share, driven by supermarkets, hypermarkets, and club stores offering wide product ranges, discounts, and convenience. Major players like Walmart, Kroger, Costco, and Sam's Club dominate this space, leveraging private-label coffee priced 15-25% lower than branded options, appealing to cost-conscious consumers. Convenience and grocery stores focus on quick purchases, with single-serve RTD coffee and small-format ground coffee performing well. Specialty stores like Whole Foods and Sprouts cater to premium and organic buyers, showcasing artisanal and direct-trade brands that lack access to mass-market retailers. Online retail, which grew during the pandemic, remains strong with subscription models that simplify purchases. Brands like Trade Coffee and Blue Bottle use algorithms to personalize roast recommendations, offering a unique advantage over physical stores.
On-trade channels are projected to grow at a 6.98% CAGR through 2031, the fastest among distribution segments, as café culture and drive-thru formats gain popularity. Dutch Bros plans over 160 new locations in 2025, focusing on suburban and exurban areas where drive-thrus are cost-effective. Regional chains like Scooter's Coffee, which expanded 35.1% to 750 units in 2023, and 7 Brew, growing from 180 to over 200 locations in 2024, are rapidly scaling and challenging national brands. On-trade channels attract consumers with barista interactions, customization, ambiance, and the social appeal of branded cups, justifying price premiums of 200-300% over at-home coffee. They also serve as testing grounds for new products, with limited-time offers and seasonal drinks driving traffic, social media buzz, and off-trade sales of packaged versions.
Geography Analysis
United States Coffee Market
In 2025, the United States held 74.60% of North America's coffee market, driven by a 20-year high in daily coffee consumption (66-67%) and a strong retail network with 42,773 branded outlets and numerous independent cafés. Specialty coffee accounted for 46% of daily consumption in 2025, up from 39% in 2020, reflecting a shift to premium formats that boost value growth over volume. Starbucks, with over 16,300 United States stores, plans to expand to 20,000 by 2030, despite a 2% drop in comparable-store sales and a 5% decline in transactions in fiscal 2024. However, a 4% rise in average ticket prices, driven by mix improvements and pricing, offset these declines. The United States market is transitioning from volume-driven growth to higher margins through product mix enhancements, with RTD coffee, cold brew, and functional beverages gaining popularity over traditional hot drip coffee. Regulatory factors, such as the FDA's 400-milligram daily caffeine limit, influence product formulations and labeling. Additionally, single-serve pods face increasing environmental scrutiny, with states like California and New York implementing EPR regulations requiring manufacturer-funded recycling, pushing for compostable materials.
Mexico Coffee Market
Mexico is the fastest-growing market in North America, with a 6.61% CAGR through 2031, supported by rising incomes, urbanization, and a shift from instant coffee to brewed and specialty formats. Domestic consumption is projected at 1.3 million 60-kilogram bags in 2024-25, though per-capita consumption remains low at 700 grams annually compared to Brazil's 5.8-6 kilograms. As the 10th-largest coffee producer globally, Mexico produces 231,596 tons annually, mainly from Chiapas (31%), Veracruz (27.8%), and Puebla (25%). However, 90% of production comes from smallholders with an average of 2.9 hectares, limiting economies of scale and exposing them to price volatility. The government launched the Café Bienestar brand in 2024 to support smallholders and boost domestic consumption. Mexico imported 1.94 million bags of coffee in 2024-25, primarily Robusta from Brazil and Vietnam, under the PROSEC tariff program, which allows duty-free imports for re-export or domestic processing. In April 2024, Mexico raised import tariffs on coffee capsules from 0% to 20%, protecting local roasters and manufacturers but increasing costs for brands like Nespresso and Keurig. Specialty coffee is growing in cities like Mexico City and Monterrey, with third-wave cafés and micro-roasters emerging in affluent areas, mirroring U.S. trends but concentrated in top-tier urban centers.
Canada Coffee Market
Canada's coffee market, though mature, is seeing renewed growth in cold coffee and espresso-based beverages, which accounted for 21% and 30% of daily consumption in 2024, respectively, both rising significantly from prior years. In June 2024, Canada imported 20.5 million kilograms of green coffee, primarily from Colombia (38.2%), Brazil (21.4%), Guatemala (12.9%), and Honduras (9.9%). This diverse sourcing reduces supply risks but exposes roasters to climate and political challenges in multiple countries. Organic coffee sales grew 7% in 2024, while specialty coffee increased by 5%, reflecting consumer demand for sustainability and premium products. The coffee and tea manufacturing sector expanded to 637 businesses in June 2024, up from 591 in 2023, indicating new entrants. Consumer coffee prices rose 1.4% year-on-year in June 2024, modest compared to broader food inflation, while trade prices surged 60.56% in 2023-2024. Roasters absorbed these cost increases to maintain volume, compressing margins and delaying price hikes. The rest of North America, including smaller Caribbean and Central American markets, contributes minimally to regional revenue but serves as a re-export hub and a tourism-driven on-trade channel, with limited data available for detailed analysis.
Regulatory Landscape
In the United States, packaged coffee, instant coffee, and RTD coffee sold through retail channels come under FDA oversight for food safety and labeling under the Federal Food, Drug, and Cosmetic Act (FD&C Act) and the Fair Packaging and Labeling Act. This framework influences claims, ingredient statements, and Nutrition Facts/serving declarations for functional and low-sugar RTD formulations. FDA also applies its Uniform Compliance Date policy for food labeling regulations published between January 1, 2025 and December 31, 2026, which affects how quickly new labeling changes can be rolled out across multi-SKU coffee portfolios.
In Canada, coffee products are regulated under the Food and Drugs Act and the Food and Drug Regulations, with requirements spanning composition, packaging, and labeling, which is especially relevant for cross-border portfolios and bilingual packaging. Trade and import flows are also influenced by tariff classifications. Under the 2026 Harmonized Tariff Schedule of the United States (Heading 0901), green and roasted coffee are generally classified in ways that typically enter duty-free, supporting large-scale green coffee import and domestic roasting models in North America.
Value Chain Analysis
The North American coffee value chain starts with green coffee sourcing from producing origins, notably Brazil, Colombia, Vietnam, and Honduras. Importers and traders then act as importer of record, handling pre-shipment quality approval, customs clearance, and storage in specialized warehouses before delivery to roasters and manufacturers. Roasting, grinding, freeze-drying/spray-drying for instant coffee, and aseptic or cold-fill packaging for RTD are carried out in owned facilities or through co-manufacturers, after which products move through off-trade channels (mass retail, club, convenience, specialty, and e-commerce/subscriptions) and on-trade channels (cafes and QSR/drive-thru).
Operational performance is closely tied to logistics reliability and packaging system constraints. Congestion at key gateways such as Los Angeles, New York, and Vancouver can lead to rolled bookings and delays that extend from days to weeks, complicating freshness targets and promotional timing. Cross-border frictions and labor or infrastructure disruptions in Canada, including ports such as Vancouver/Prince Rupert and Montreal, add shipping risk for Canadian roasters moving into the United States. At the same time, faster scaling of RTD and single-serve platforms increases reliance on specialized inputs, including capsule materials, filters, and aseptic cartons or bottles, and on consistent last-mile execution into convenience and grocery networks.
Competitive Landscape
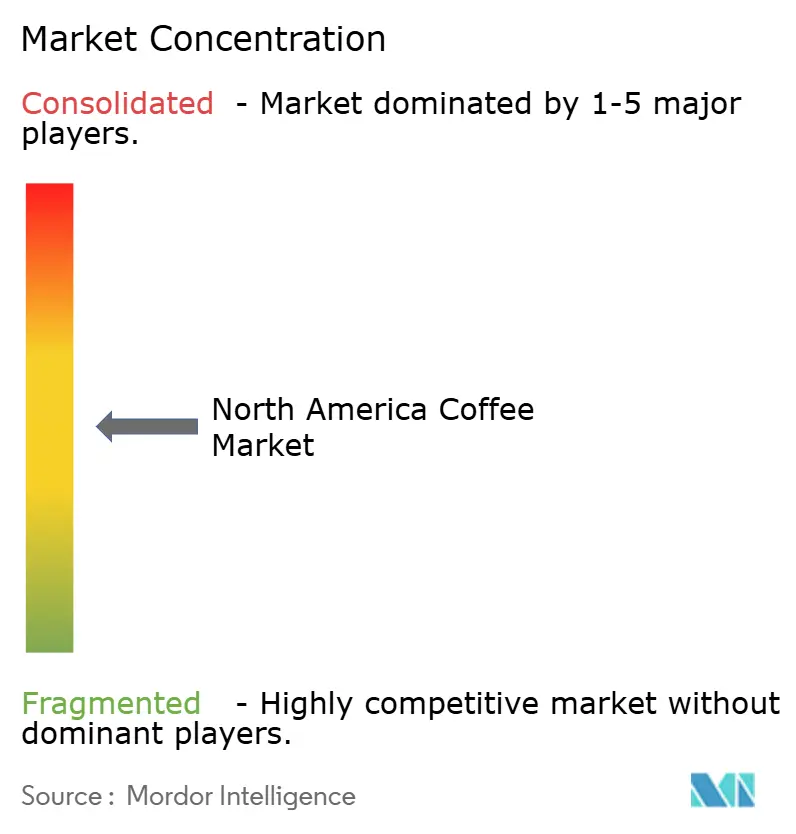
The North America coffee market is moderately consolidated, led by a mix of multinational brands and established regional roasters that influence pricing, distribution, and product innovation. Major players leverage strong retail partnerships, advanced supply-chain networks, and diversified portfolios spanning whole bean, ground, instant, and ready-to-drink formats. Key players in the market include Nestlé S.A., Starbucks Corporation, The J.M. Smucker Company, JAB Holding Company, and Luigi Lavazza S.p.A. Their dominance is reinforced by sustained investments in sustainability sourcing programs and premium product lines.
However, specialty roasters and local craft brands continue to gain traction by offering origin-specific, small-batch, and ethically sourced coffees that appeal to younger consumers. Despite this growing fragmentation at the craft level, high capital requirements and entrenched brand loyalty restrict rapid scaling of smaller entrants. As a result, competition centers on premiumization, convenience-driven formats, and differentiated flavor and roasting profiles.
Sustainability certifications like C.A.F.E. Practices (Starbucks), AAA Sustainable Quality (Nespresso), Fair Trade, Rainforest Alliance, serve as table-stakes differentiators in specialty segments but remain underutilized in conventional mass-market offerings, creating an opening for brands that can credibly communicate traceability and regenerative-agriculture practices at accessible price points. The competitive landscape will likely consolidate further through M&A as private-equity-backed platforms (JAB, Inspire Brands) pursue roll-up strategies, yet specialty and direct-to-consumer players will continue to fragment share by exploiting incumbents' slow product-development cycles and limited digital-native capabilities.
North America Coffee Industry Leaders
-
Nestlé S.A.
-
Starbucks Corporation
-
The J.M. Smucker Company
-
JAB Holding Company
-
Luigi Lavazza S.p.A.
- *Disclaimer: Major Players sorted in no particular order
North America Coffee Market Companies Covered in this Report
- Starbucks Corporation
- Nestle S.A.
- Keurig Dr Pepper Inc.
- JAB Holding Company
- The J.M. Smucker Company
- Luigi Lavazza S.p.A.
- Massimo Zanetti Beverage Group S.p.A.
- The Kraft Heinz Company
- Tchibo GmbH
- Tata Consumer Products Ltd.
- Inspire Brands Inc.
- JDE Peet's N.V.
- Blue Bottle Coffee, Inc.
- Caribou Coffee Company, Inc.
- Community Coffee Company, L.L.C.
- Death Wish Coffee Company
- La Colombe Coffee Roasters
- Intelligentsia Coffee & Tea, Inc.
- Restaurant Brands International Inc.
- The J.M. Smucker Company

Market Opportunities and Future Outlook
Cold coffee and RTD capacity build-outs are creating clear opportunities for brands and co-manufacturers to scale consistent cafe-style quality into multi-outlet retail, particularly as convenience and multi-outlet channels add measurable category gains (Circana reported coffee sales up 14.7% to USD 19.2 billion for the 52 weeks ending April 19, 2026). A concrete example is Chobani breaking ground in June 2026 on a USD 567 million, three-phase expansion tied to La Colombe manufacturing in Michigan to increase RTD latte capacity, targeted at 1 million cases per week. The planned build reflects branded players investing behind domestic production to support wider cold-chain and shelf-stable RTD distribution.
Sustainability and compliance-driven renovation of single-serve and sourcing practices also opens room for differentiated offerings that reduce environmental friction while supporting premium pricing. In July 2026, Single Cup Coffee launched commercially compostable, plant-based, PFAS-free pods, aligning product design with rising scrutiny on pod waste and materials. Upstream procurement and farm-support frameworks are becoming more formalized, including the March 2026 publication of common coffee procurement principles developed by Global Coffee Platform (GCP), IDH, and Solidaridad, signed by major traders and roasters. Large brands are also expanding regenerative sourcing programs, for example, Nescafe reported 53% of its green coffee sourced from farmers using regenerative agricultural practices in 2025, supporting traceability-forward specialty and premium conventional lines across the region.
Recent Industry Developments in North America Coffee Market
- May 2026: Starbucks and PepsiCo rolled out a marketing push for Starbucks Coffee and Protein RTD beverages via the North American Coffee Partnership, including a limited-time activation with a Strava in-app challenge running from May 21 through June 18. The campaign expands functional coffee positioning and drives higher-frequency engagement across on-shelf and digital touchpoints.
- April 2026: Keurig Dr Pepper and Nestle USA extended and expanded their strategic partnership covering manufacturing and distribution of Starbucks K-Cup pods across the United States and Canada. The renewal reinforces the installed-base brewer ecosystem as a key route to market for branded single-serve coffee and supports broader retail penetration through an established North American production and distribution footprint.
- February 2026: Starbucks and PepsiCo launched Starbucks Coffee and Protein ready-to-drink beverages through the North American Coffee Partnership. The launch expands the functional RTD coffee set with a protein-forward proposition, raising the bar for differentiation in convenience-led formats where shelf space and chilled placement are contested.


North America Coffee Market Report Scope and Research Methodology
Market Definition and Coverage
This market covers the value of coffee products sold across North America through retail and foodservice, counted at the point of sale in the supply chain. It includes common formats such as whole bean, ground, instant, pods and capsules, and ready-to-drink coffee.
Scope exclusions: We exclude coffee equipment and appliances, as well as non-coffee add-ins like creamers, sugar, and flavor syrups.
Segments Covered in This Report
-
By Product Type
- Whole Bean
- Ground Coffee
- Instant Coffee
- Coffee Pods and Capsules
- RTD Coffee
-
By Category
- Conventional Coffee
- Specialty
-
By Coffee Species
- Arabica
- Robusta
- Liberica
- Others
-
By Distribution Channel
- On-Trade
-
Off-Trade
- Supermarkets/Hypermarkets
- Convenience/ Grocery Stores
- Specialty Stores
- Online Retail Stores
- Other Off-trade Channels
-
By Country
- United States
- Canada
- Mexico
- Rest of North America
Data Sources, Market Sizing, and Validation
Desk Research
Desk research is used to build the basic fact base for supply, trade, and consumption signals that can be checked consistently year over year. For North America coffee, we refer to sources such as USDA (including FAS), USITC trade statistics, Statistics Canada, and Mexico INEGI, and then align those with customs import and export series and consumer price inflation releases.
Alongside official sources, we also review public company filings and investor presentations, trade association updates, and reputable business press coverage to understand how formats such as pods and capsules and ready-to-drink are shifting across retail and foodservice. When needed for gap filling, we use paid subscriptions for company financials and intelligence, news and financials, patent databases, and shipment-level import and export data to sanity check large moves in volumes and implied pricing. The desk sources listed here are illustrative only, and many additional sources were reviewed for data collection, validation, and clarification.
Primary Interviews and Surveys
Primary work is used to test the desk assumptions that most often swing the model, especially channel mix, typical pricing ladders by format, and how specialty versus conventional is being counted in practice. We speak with a mix of roasters, brand owners, importers, distributors, and retail and foodservice channel participants across the United States, Canada, Mexico, and the Rest of North America, and then reconcile differences through follow-up calls when estimates do not match.
Distribution of primary research fieldwork respondents
| Company type | Respondent position |
|---|---|
| Top tier: 28% | CXOs: 18% |
| Mid tier: 54% | Functional/Unit leaders: 28% |
| Smaller Players: 18% | Managers: 54% |
Market-Sizing & Forecasting
Market size is first reconstructed using a top-down approach where production, imports, and exports are mapped into a demand pool, and then converted into value using observed pricing and channel mark-ups by product format. Results are then corroborated with selective bottom-up approximations, such as sampled brand and retailer price checks paired with volume proxies, and distributor and channel checks that help adjust the split between on-trade and off-trade.
Inputs that matter in this coffee market include green coffee trade flows into North America, share shift across whole bean, ground, instant, pods and capsules, and ready-to-drink, on-trade recovery patterns, and inflation-driven changes in average selling prices by format. Because the forecast needs to reflect both stable habits and shocks, we use scenario analysis tied to a short list of drivers that primary respondents consider most sensitive, including price inflation, format penetration shifts, and channel mix changes. Where bottom-up views are incomplete for smaller formats or smaller geographies, we bridge the gap using ratios derived from nearby markets and validated ranges shared by interviewees, before totals are finalized.
Data Validation & Update Cycle
Totals and segment splits are cross-checked against independent signals, including trade statistics directionality, price trend consistency, and the implied per-capita consumption pattern by country. When a jump looks unusual, it is reviewed, the key assumptions are re-opened, and relevant respondents are re-contacted so the variance is explained rather than averaged away.
Before sign-off, the model goes through a multi-step analyst review where definitions, unit conversions, currency handling, and year-on-year movements are checked for logic. Reports are refreshed annually, and interim updates are made when material events change pricing, supply availability, or channel dynamics. Right before delivery, a fresh pass is completed so clients receive the latest updated view.
Mordor Intelligence's North America Coffee Market Size Compared Against Other Published Estimates
Published market sizes for North America coffee can vary widely, even when they appear to describe the same category. Most gaps come from what is counted as coffee revenue, which formats are included, and whether the number is tied to retail and foodservice sell-through or to an earlier point in the supply chain.
The main gap comes from format and channel coverage, where Mordor Intelligence counts ready-to-drink coffee along with whole bean, ground, instant, and pods and capsules across both on-trade and off-trade, instead of limiting the total to a narrower roasted and instant view or to only the US and Canada. Differences also show up when one estimate uses a single inflation assumption for pricing, while another rebuilds average selling price changes by format and channel, and when refresh timing affects currency conversion windows and the latest year inputs.
Benchmark comparison
| Source | Market Size | Gaps in Research Methodology |
|---|---|---|
| Mordor Intelligence | USD 44.13 B (2026) | |
| Global Consultancy A | USD 46.35 B (2025) | Uses a different base year and product grouping emphasis (roasted, instant, and RTD), and the timing difference can shift pricing and mix assumptions when inflation is changing quickly. |
| Industry Publisher B | USD 36.50 B (2024) | Covers a narrower geographic set (US and Canada only) and applies a longer-range forecast with lower growth, which can also reflect a more conservative approach to RTD and pods penetration. |
The table shows that the spread is mostly explained by scope and timing, rather than a math difference. By keeping the model tied to observable trade signals, format mix, and channel-level price logic, the final value is easier to trace and repeat when assumptions are updated.


Key Questions Answered in the Report
What is the North America coffee market size in 2026 and its forecast for 2031?
The North America coffee market size is USD 44.13 billion in 2026 and is forecast to reach USD 56.78 billion by 2031.
Which product type is expanding the fastest?
RTD coffee shows the highest momentum, with a projected 7.12% CAGR through 2031.
How large is Arabica’s share of sales?
Arabica accounts for 69.55% of 2025 revenue, reflecting consumer preference for its flavor profile.
Which country offers the strongest growth outlook?
Mexico is expected to grow at a 6.61% CAGR between 2026 and 2031, outpacing the United States and Canada.
Page last updated on:


 Your data is secure and never sold or shared.


