
Food Grade Alcohol Market Size and Share
Market Overview
| Study Period | 2021 - 2031 |
|---|---|
| Market Size (2026) | USD 4.62 Billion |
| Market Size (2031) | USD 5.49 Billion |
| Growth Rate (2026 - 2031) | 3.51 % |
| Fastest Growing Market | Asia Pacific |
| Largest Market | Europe |
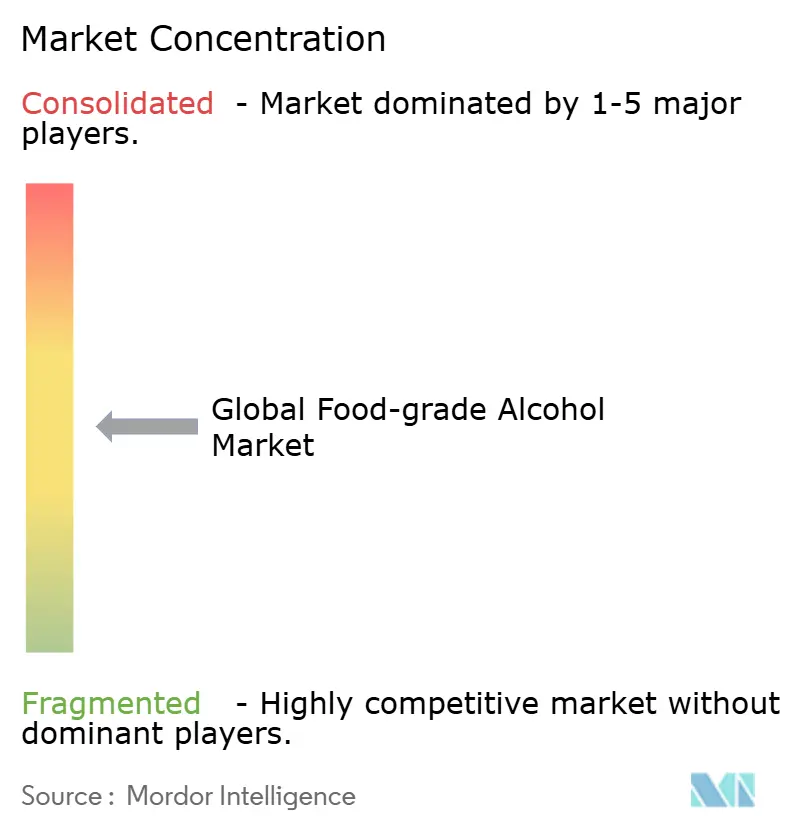
| Market Concentration | Medium |
Major Players
*Disclaimer: Major Players sorted in no particular order Image © Mordor Intelligence. Reuse requires attribution under CC BY 4.0. |
|
Food Grade Alcohol Market Analysis by Mordor Intelligence
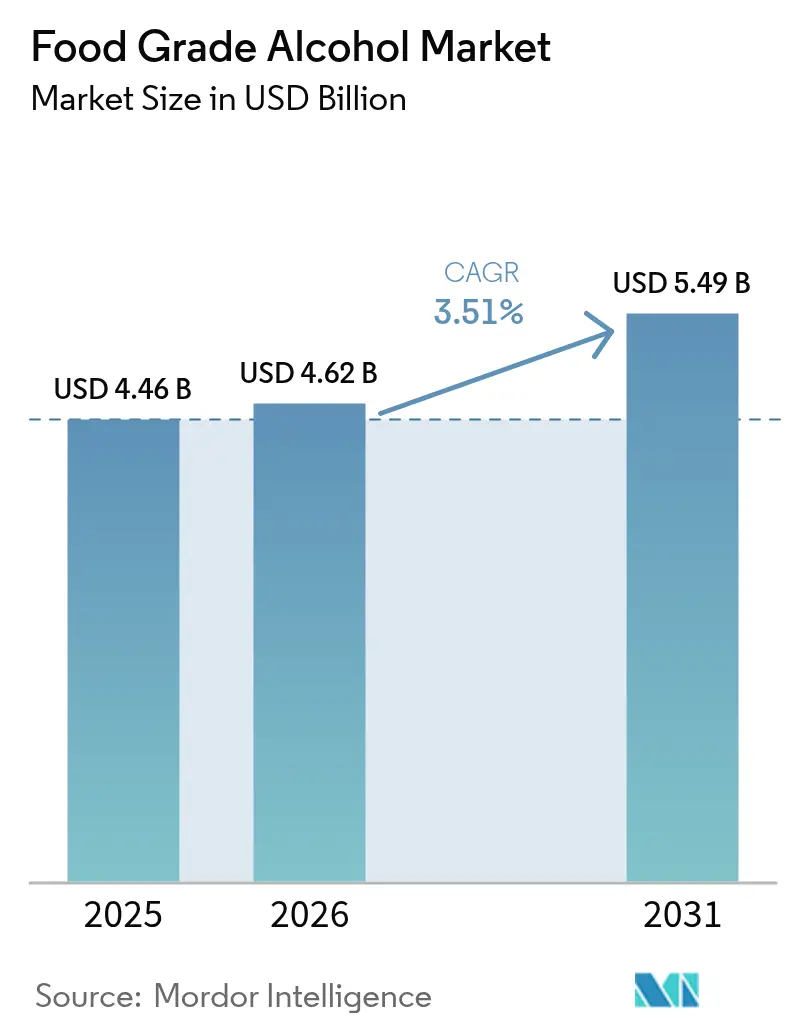
The food grade alcohol market size is expected to grow from USD 4.46 billion in 2025 to USD 4.62 billion in 2026 and is forecast to reach USD 5.49 billion by 2031 at 3.51% CAGR over 2026-2031. The market demonstrates stability through its diverse applications in food processing, beverages, dietary supplements, and pharmaceutical excipients. The Food and Drug Administration's (FDA) classification of ethanol as Generally Recognized as Safe (GRAS) provides manufacturers with clear regulatory compliance frameworks. The market growth is supported by the increasing adoption of clean-label ingredients, with food manufacturers replacing synthetic solvents with natural alternatives to address consumer demand for ingredient transparency. The growth of ready-to-drink beverages and hard seltzers creates additional demand, while the rise of plant-based and vegan products requires food-grade alcohol for extraction processes instead of conventional chemical solvents.
Key Report Takeaways
- By product type, ethanol commanded 78.12% of the food grade alcohol market share in 2025; polyols are forecast to rise at a 5.23% CAGR through 2031.
- By source, sugarcane and molasses led with 32.55% revenue in 2025, while corn-based output is poised for a 4.89% CAGR to 2031.
- By functionality, flavor carriers held 33.92% of the food grade alcohol market size in 2025; solvent and extraction roles show the fastest 5.05% CAGR through 2031.
- By application, food processing delivered 29.12% of 2025 revenue; dietary supplements represent the fastest 5.48% CAGR through 2031.
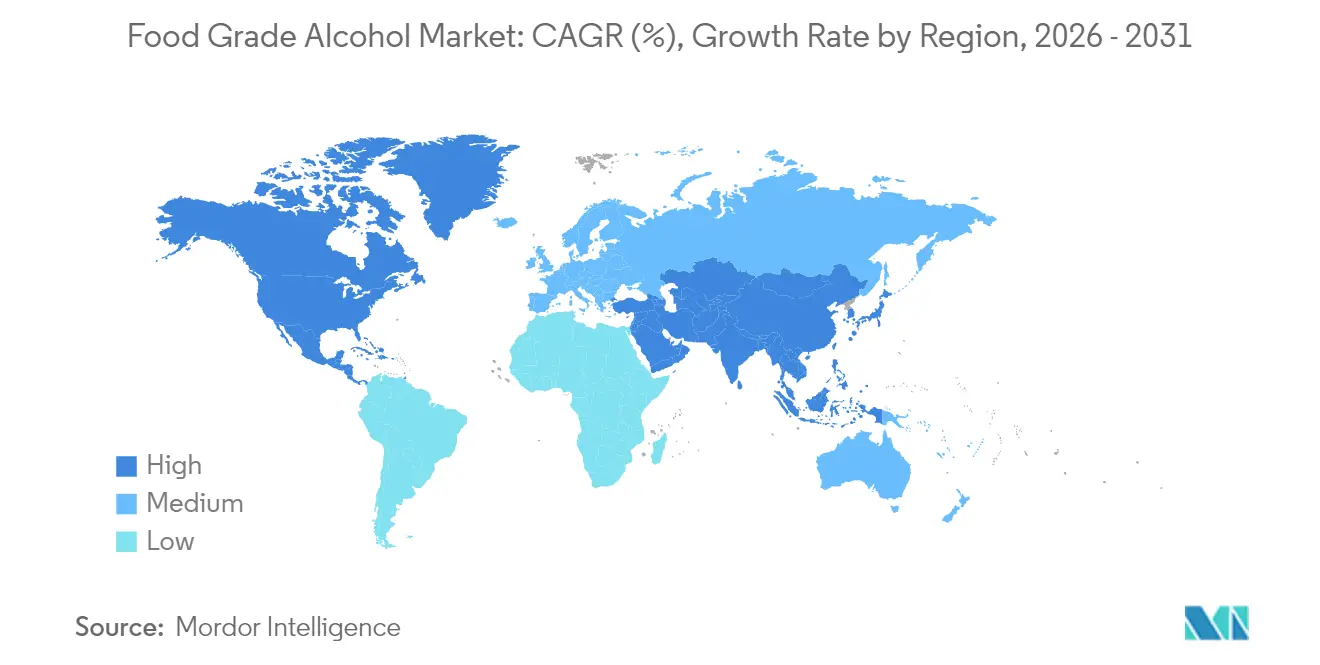
- By geography, Europe captured 33.05% of 2025 revenue; Asia-Pacific advances at a 5.11% CAGR to 2031.
Note: Market size and forecast figures in this report are generated using Mordor Intelligence’s proprietary estimation framework, updated with the latest available data and insights as of 2026.
Market Trends and Insights
Drivers Impact Analysis of Food Grade Alcohol Market*
| Driver | (~) % Impact on CAGR Forecast | Geographic Relevance | Impact Timeline |
|---|---|---|---|
| Growing demand for clean-label solvents in food and beverages | +0.8% | Global, with strongest adoption in North America and European Union | Medium term (2-4 years) |
| Expansion of ready-to-drink (RTD) and hard-seltzer categories | +0.6% | North America and the Europe core, expanding to Asia-Pacific | Short term (≤ 2 years) |
| Rising Consumer preference for Non-GMO and natural ingredients | +0.5% | Global, led by developed markets | Long term (≥ 4 years) |
| Growth of the functional foods and beverages market | +0.4% | APAC core, spill-over to North America and European Union | Medium term (2-4 years) |
| Use of food-grade alcohol in insect Protein extraction processes | +0.2% | European Union and North America early adoption, Asia-Pacific emerging | Long term (≥ 4 years) |
| Growing use of food-grade alcohol in plant-based and vegan product formulations | +0.3% | Global, concentrated in urban markets | Medium term (2-4 years) |
| Source: Mordor Intelligence | |||
Growing Demand for Clean-label Solvents in Food and Beverages
The shift toward clean-label solvents in food processing is driven by increased consumer demand for ingredient transparency and stricter regulations on chemical usage. The European Union's reclassification of hexane as a neurotoxicant has led manufacturers to adopt safer alternatives, particularly food-grade ethanol for extraction processes. This regulatory change influences global markets as multinational food companies align their formulations across regions to maintain product consistency. Clean-label reformulations command higher prices while reducing manufacturers' exposure to health-related liability claims. The Generally Recognized as Safe (GRAS) status of food-grade alcohol eliminates the need for extensive safety testing required for new solvents. The adoption of clean-label specifications by private-label retailers has created supply chain requirements that benefit established food-grade alcohol manufacturers.
Expansion of Ready to Drink (RTD) and Hard-Seltzer Categories
The Ready-to-Drink (RTD) and hard-seltzer segments have transformed alcohol consumption patterns, generating new demand for high-purity food-grade alcohol. These products appeal to health-conscious consumers by offering lower-calorie options, with hard seltzers containing approximately 100 calories per serving compared to 150-200 calories in beer. The production of these beverages requires high-purity ethanol to maintain their characteristic clean, neutral taste profiles, which has increased the premium pricing for food-grade alcohol suppliers. Asahi's strategic focus on health and wellness business expansion, including alcohol alternatives and functional ingredients, demonstrates the broader industry shift toward these trends. Despite market saturation concerns, the category continues to grow through innovations in flavors and functional additives. The production requirements create significant barriers to entry, benefiting established food-grade alcohol suppliers with existing purification infrastructure and consolidating market share among current manufacturers.
Rising Consumer Preference for Non-GMO and Natural Ingredients
Consumer preference for non-GMO and natural ingredients has shifted from niche demand to mainstream expectation, transforming sourcing strategies across the food industry. According to the International Food Information Council (IFIC), in 2023, 28% of respondents in the United States reported regularly purchasing food and beverages labeled as non-GMO [1]Source: International Food Information Council (IFIC), "2023 Food and Health Survey", foodinsight.org. This change significantly affects food-grade alcohol production, as feedstock selection influences product positioning and pricing. Organic and non-GMO certified ethanol commands higher prices compared to conventional alternatives, creating opportunities for producers who invest in supply chain verification and certification processes. The trend extends beyond food applications into pharmaceutical excipients and cosmetic ingredients, where natural origin claims provide differentiation in premium markets. Regulatory frameworks support this transition by emphasizing natural ingredient sourcing. The economic impact is significant, as non-GMO verification requires extensive supply chain documentation and third-party auditing. This creates operational complexity that benefits larger producers with established quality management systems while potentially limiting smaller competitors who lack certification resources.
Growth of the Functional Foods and Beverages Market
The growth of the functional foods and beverages market drives the food-grade alcohol market, as ethanol and other food-grade alcohols are essential in formulating, stabilizing, and delivering bioactive ingredients. These functional products require high-purity solvents to extract, preserve, and integrate active compounds. Food-grade ethanol serves as the primary solvent due to its safety for human consumption, effectiveness in dissolving both water- and fat-soluble components, and compliance with clean-label and organic certification requirements. The alcohol-based extraction method maintains the integrity and bioavailability of polyphenols, alkaloids, and flavonoids from herbal ingredients used in immunity boosters, energy drinks, nootropics, and digestive products. According to the China Nutrition and Health Food Association, China's functional food production reached 852,000 metric tons in 2023, increasing from 787,000 metric tons in the previous year [2]Source: China Nutrition and Health Food Association, "Total production volume of health and functional food in China", cnhfa.org.cn. This production increase aligns with China's focus on preventive health and nutraceutical development, generating higher demand for botanical extracts and natural bioactive delivery systems that utilize food-grade ethanol.
Restraints Impact Analysis of Food Grade Alcohol Market*
| Restraint | (~) % Impact on CAGR Forecast | Geographic Relevance | Impact Timeline |
|---|---|---|---|
| High taxation and excise duties on alcohol | -0.9% | Global, particularly severe in Australia an European Union | Short term (≤ 2 years) |
| Cultural, ethical, and religious restrictions | -0.4% | Middle East, South Asia, select regions | Long term (≥ 4 years) |
| Stringent regulatory frameworks for food-grade alcohol | -0.6% | Global, with varying intensity by jurisdiction | Medium term (2-4 years) |
| Volatility in aw material prices | -0.7% | Global, concentrated in agricultural regions | Short term (≤ 2 years) |
| Source: Mordor Intelligence | |||
High Taxation and Excise Duties on Alcohol
The increasing alcohol taxation across major markets poses a significant challenge to the food-grade alcohol market growth. Government policies prioritize revenue generation through higher taxes, impacting industry operations. In FY2023, the United States federal excise tax structure generated USD 11.1 billion annually, with spirits accounting for 61% of the total alcohol tax. [3]Source: Library of Congress, "Alcohol Excise Taxes", www.congress.gov. These tax increases affect the entire supply chain as food manufacturers experience higher input costs, which they must either absorb or transfer to consumers, potentially reducing the demand for alcohol-containing products. The varying tax rates across jurisdictions and evolving reporting requirements add regulatory complexity for manufacturers. For instance, New Zealand's recent adjustment of excise rates from 49.855 cents to 53.170 cents per liter demonstrates the ongoing trend of increasing alcohol taxation globally.
Stringent Regulatory Frameworks for Food-Grade Alcohol
Regulatory complexity in the food-grade alcohol industry continues to increase as jurisdictions implement comprehensive food safety frameworks. The Food Safety Modernization Act requires distilleries to implement preventive controls and hazard analysis protocols, which creates significant operational costs, particularly affecting smaller producers. The Current Good Manufacturing Practice regulations under 21 CFR Part 110 require extensive documentation, personnel training, and facility maintenance standards, necessitating substantial investment in quality management systems. International regulations add further complexity, as producers must comply with multiple frameworks to access global markets. For instance, the European Union's spirit drinks regulations mandate the use of agricultural-origin ethyl alcohol and prohibit synthetic alternatives, restricting supply chain flexibility. The evolving nature of food safety standards requires continuous monitoring and adaptation, resulting in ongoing compliance costs that typically favor larger producers with established regulatory affairs departments.
*Our forecasts treat driver/restraint impacts as directional, not additive. The impact forecasts reflect baseline growth, mix effects, and variable interactions.
Food Grade Alcohol Market Segment Analysis
By Product Type:
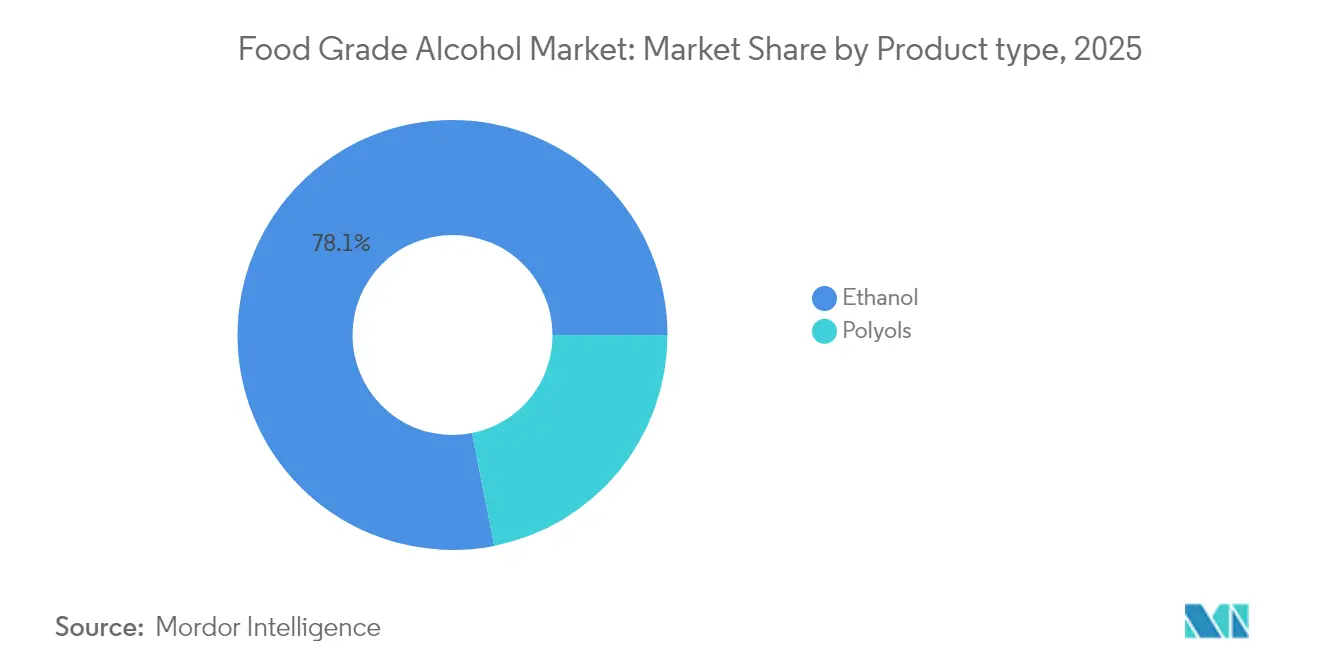
Ethanol Dominance Faces Polyol InnovationEthanol holds a dominant 78.12% market share in 2025, supported by its established regulatory framework and diverse applications in food processing, beverages, and pharmaceutical excipients. Polyols represent the fastest-growing segment, with a 5.23% compound annual growth rate (CAGR) through 2031, driven by increased adoption in sugar-free and diabetic-friendly products. This growth pattern indicates a market shift, as traditional ethanol applications stabilize while polyol applications expand to meet demand from health-conscious consumers and functional food manufacturers. Polyols offer distinct advantages, including lower caloric content and enhanced stability in specific formulations, making them suitable for specialized dietary products.
The regulatory framework offers advantages for polyols, particularly in applications where ethanol faces limitations due to its psychoactive properties, especially in products intended for children and health-conscious consumers. The Food and Drug Administration's guidelines under 21 CFR Part 172 provide specific parameters for polyol use in food applications, reducing compliance uncertainties for manufacturers. The production of polyols involves fewer regulatory requirements compared to ethanol distillation, which must comply with both food safety standards and alcohol taxation rules. In international trade, polyol-based products encounter fewer import barriers and tax complications than ethanol-containing products.



By Sources:
Feedstock Diversification AcceleratesSugarcane and molasses hold a 32.55% market share in 2025, maintaining their position as primary feedstocks due to established supply chains and economic advantages in tropical regions, particularly in Brazil's ethanol industry. Corn-based production demonstrates the highest growth rate at 4.89% CAGR, driven by North American agricultural strengths and improved corn-to-ethanol conversion efficiencies. Wheat and cassava serve as alternative feedstocks, each leveraging regional agricultural advantages. Alternative feedstocks, including agricultural waste and cellulosic materials, occupy niche segments with potential for expansion as sustainability requirements increase.
Brazil produced 35.3 billion liters of ethanol in 2023, a 15.3% increase from 2022, processing 713 million tons of sugarcane according to the Energy Research Office. This production volume provides cost advantages for sugarcane-based ethanol, especially in food-grade applications where established processes meet strict purity standards. Corn-based production operates under distinct economic conditions, primarily influenced by corn prices. The concentration of feedstock production in specific regions creates supply vulnerabilities, as adverse weather or regulatory changes in major producing areas can affect food-grade alcohol supply and prices.
By Functionality:
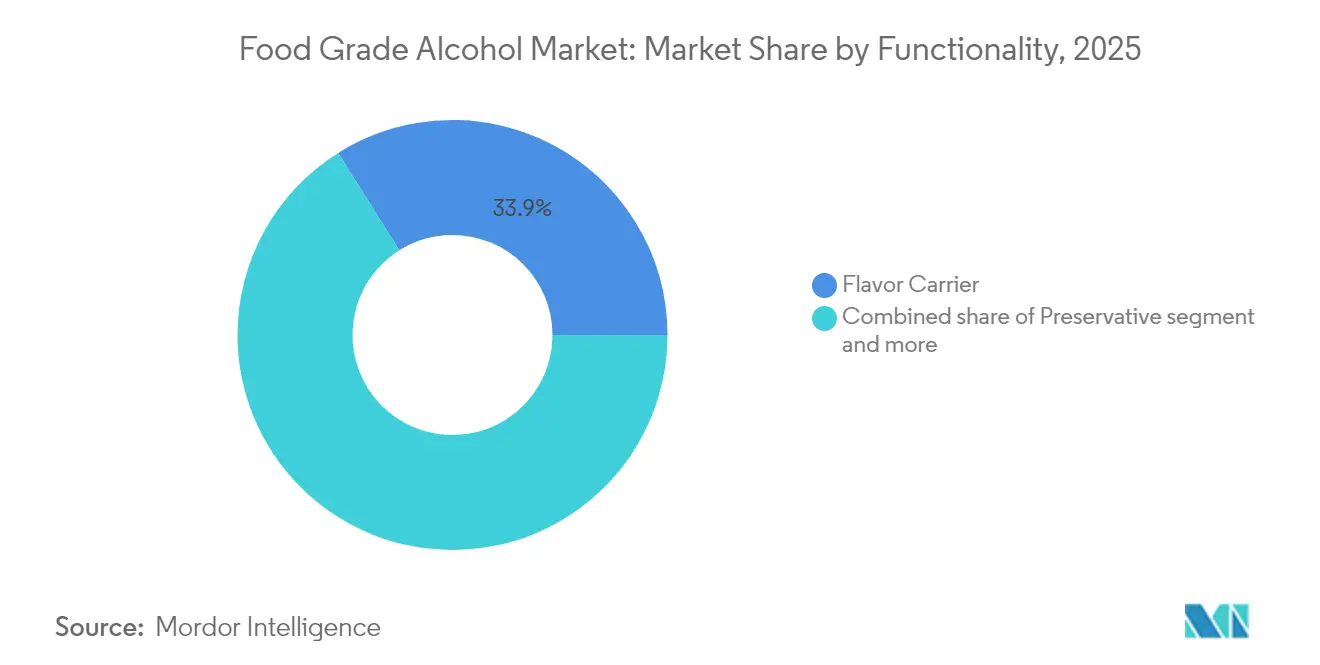
Extraction Applications Drive InnovationThe food-grade alcohol market demonstrates significant segmentation across functional applications, with flavor carriers maintaining the dominant position at 33.92% market share in 2025. This prominence stems from the fundamental role of food-grade alcohol in the extraction and delivery of taste compounds throughout the food and beverage manufacturing sector. The solvent and extraction agent applications exhibit substantial growth potential, projecting a 5.05% CAGR through 2031, primarily attributed to the increasing adoption in nutraceutical production and botanical extract manufacturing processes.
In the global market landscape, preservative applications continue to generate steady demand from food manufacturers, while texturizer and humectant functions demonstrate growth patterns that align with the overall food industry expansion. The diversification across functional applications positions food-grade alcohol as a versatile ingredient in the global food processing sector, establishing multiple revenue channels and reducing market susceptibility to disruptions within individual application segments.
By Application:
Dietary Supplements Lead GrowthFood processing maintains the largest application segment with a 29.12% market share in 2025, as food-grade alcohol serves as a key component in manufacturing processes across multiple food categories. Dietary supplements represent the fastest-growing application with a 5.48% CAGR through 2031, supported by expanding nutraceutical markets and increased consumer focus on preventive healthcare. The growth in dietary supplements stems from aging populations, higher healthcare costs, and greater consumer awareness of nutritional supplementation. Food-grade alcohol serves both in direct formulation and in the extraction and purification of botanical ingredients, where its safety profile and regulatory compliance make it preferable to alternative solvents.
Beverages constitute a significant and stable application segment, while pharmaceutical excipients demonstrate consistent growth in line with pharmaceutical sector expansion. The pharmaceutical excipients segment benefits from strict quality requirements, favoring established food-grade alcohol manufacturers with strong quality management systems and regulatory compliance. Manufacturers meeting both food and pharmaceutical quality standards can potentially secure premium pricing for pharmaceutical-grade food alcohol products. Additional applications in cosmetics and personal care products contribute to market diversity, though these remain smaller by volume.
Geography Analysis
Europe Food Grade Alcohol Market
Europe holds 33.05% of the global market share in 2025, driven by EU Regulation 2019/787 that requires agricultural-origin ethanol for spirit drinks. This regulation ensures consistent demand for food-grade alcohol while prohibiting synthetic alternatives. The region's market dominance is supported by its established distillation industries, advanced food processing sectors, and consumer demand for natural ingredients. The unified regulations across EU member states enable producers to achieve operational efficiencies while maintaining strict quality standards. European demand continues to grow through applications in plant-based and organic food products, aligned with the region's focus on sustainability.
APAC Food Grade Alcohol Market
Asia-Pacific shows the highest growth rate at 5.11% CAGR through 2031. This growth is attributed to the expansion of food processing industries, higher disposable incomes, and increased adoption of Western consumption patterns. The region's market potential is enhanced by its large population, urban development, and changing dietary preferences toward processed and convenience foods. China's regulatory environment continues to develop, with the State Administration for Market Regulation implementing new labeling requirements for alcohol-containing food products. Japan and Australia's regulatory standards align with global requirements, supporting international trade and investment in food-grade alcohol production.
The Americas Food Grade Alcohol Market
North America maintains a strong market position through its developed ethanol production infrastructure and food processing industries, despite showing moderate growth in mature markets. The region leverages its abundant corn resources and efficient supply chains for food-grade alcohol production. In South America, Brazil's significant ethanol production capacity contributes to global supply while developing local food processing applications that incorporate food-grade alcohol.

Regulatory Landscape
Food-grade alcohol compliance is anchored to food-safety specifications and additive frameworks, while alcohol taxation and other control regimes add separate requirements for producers and downstream users. In the United States, ethyl alcohol is affirmed as Generally Recognized as Safe (GRAS) under 21 CFR 184.1293, with compliance tied to Food Chemicals Codex specifications and FDA oversight through food substances listings and related guidance covering alcohol use in foods.
In the European Union, food additive permissions and conditions of use are governed by Regulation (EC) No 1333/2008 (including the Union list), and spirit-drinks rules emphasize agricultural-origin ethyl alcohol under Regulation (EU) 2019/787. As part of ongoing updates to the EU framework, Regulation (EU) 2024/374 took effect in January 2024 to clarify food category titles for alcoholic beverages and update additive usage terminology, which reinforces the need for exporters to track category definitions and permitted-use conditions across member states. Internationally, FAO/WHO Codex and JECFA specifications for ethanol (monograph specifications) are used by some countries as a reference point to align identity and purity expectations in cross-border trade.
Competitive Landscape
The food-grade alcohol market demonstrates moderate fragmentation with a concentration, reflecting balanced competition between multinational corporations and regional producers. This market structure enables both cost leadership strategies through scale and niche differentiation approaches across various market segments. Companies like Archer-Daniels-Midland Company, Cargill, Incorporated, Wilmar International Limited, and Roquette Frères leverage their vertical integration and global distribution networks to achieve economies of scale.
The market favors companies with strong regulatory compliance capabilities, as international food safety requirements create entry barriers for smaller producers without dedicated quality management systems. Companies increasingly prioritize sustainability credentials and clean-label positioning to support food manufacturers' sustainability commitments and transparency initiatives across global markets. Major producers focus on technology adoption for process optimization and quality enhancement, investing in advanced purification technologies and analytical capabilities to meet pharmaceutical-grade standards.
The food-grade alcohol industry presents opportunities in emerging applications such as insect protein processing and botanical extractions, where early market entry can establish leadership positions. The industry structure supports both acquisition-based consolidation and organic growth, particularly in developing regions. Regulatory requirements and capital investments create entry barriers while rewarding operational efficiency and strong international customer relationships, shaping the competitive landscape across different geographical markets.
Food Grade Alcohol Industry Leaders
-
Archer-Daniels-Midland Company
-
Cargill, Incorporated
-
Wilmar International Limited
-
Roquette Frères
-
Manildra Group
- *Disclaimer: Major Players sorted in no particular order
Food Grade Alcohol Market Companies Covered in this Report
- Archer-Daniels-Midland Company
- Cargill, Incorporated
- Wilmar International Limited
- Roquette Frères
- Manildra Group
- MGP Ingredients
- Cristalco S.A.S.
- Grain Processing Corporation
- Greenfield Global
- Tereos SCA
- Südzucker AG
- Merck Group
- Illovo Sugar Limited
- Thai Alcohol Public Company Limited
- Sasol Fermentation
- Green Plains Inc
- Lallemand Inc.
- Flint Hills Resources
- Sekab Biofuels
- Pure Alcohol Solutions

Market Opportunities and Future Outlook
Opportunities center on higher-purity, compliance-ready alcohol streams for beverages, dietary supplements, and extraction applications, supported by capacity additions that improve supply reliability and help producers tighten specifications. Regulatory clarity continues to support commercialization, with FDA GRAS positioning in the United States (21 CFR 184.1293) and EU frameworks for additives and spirit drinks (Regulation (EC) No 1333/2008 and Regulation (EU) 2019/787) supporting ingredient standardization across multinational formulations. Suppliers that can document consistent quality and traceability can benefit from these alignment requirements.
On the supply side, several 2026 capacity moves point to room for producers that expand flexible feedstock capability and add purification infrastructure that can serve both food and pharma-adjacent customers. In India, BCL Industries commissioned a 150 KLPD expansion at Bathinda in June 2026, lifting the site to 550 KLPD, while Godavari Biorefineries commissioned a 200 KLPD corn and grain-based distillery at Sameerwadi in July 2026, bringing facility capacity to 800 KLPD. In the Americas, CerradinhoBio started operating a corn ethanol plant expansion in Chapadao do Ceu, Brazil in June 2026, increasing corn processing capacity from 800,000 to 1.2 million tonnes per year, and POET Bioprocessing broke ground in June 2026 on an expansion at Shelbyville to double production capacity. These additions expand the pool of ethanol that can be upgraded into food-grade and extraction-grade streams, and they also support co-product economics, such as DDGS, that can underpin competitive supply into food processing and supplement extraction value chains.
Recent Industry Developments in Food Grade Alcohol Market
- July 2026: Godavari Biorefineries commissioned a 200 KLPD corn and grain-based distillery at its Sameerwadi facility in Karnataka, increasing total site capacity to 800 KLPD. The added fungible grain capability improves feedstock optionality and supports tighter supply continuity for higher-spec alcohol streams used across beverage and extraction applications.
- June 2025: Cargill transferred its small-pack specialty business in food and pharma grade alcohol to chemical distributor Brenntag. The move shifts route-to-market for smaller-volume, specialty customers toward distribution-led fulfillment while allowing Cargill to concentrate internal resources on large-scale ethanol supply and production efficiency.
- December 2024: Godavari Biorefineries announced an investment of INR 130 crore to set up a new 200 KLPD corn and grain-based distillery alongside existing operations. The planned dual-feedstock configuration expands operating flexibility, helping manage raw-material volatility and supporting customers that require consistent quality and documentation for food-grade use.


Food Grade Alcohol Market Report Scope and Research Methodology
Market Definition and Coverage
This market covers food grade alcohol used as an ingredient or processing aid in food, beverage, and related ingestible applications, where purity and food-safety compliance are required. We track values in revenue terms across major producing and consuming regions.
Scope exclusions: We exclude fuel ethanol, denatured industrial alcohol, and non-food solvent grades sold without food-grade certification.
Segments Covered in This Report
-
By Product Type
- Ethanol
- Polyols
-
By Sources
- Sugarcane and Molasses
- Corn
- Wheat
- Cassava
- Other Feedstocks
-
By Functionality
- Preservative
- Flavor Carrier
- Solvent and Extraction Agent
- Texturizer and Humectant
-
By Application
- Food Processing
- Beverages
- Dietary Supplements
- Pharmaceutical Excipients
- Other Applications
-
By Geography
-
North America
- United States
- Canada
- Mexico
- Rest of North America
-
Europe
- Germany
- United Kingdom
- Italy
- France
- Spain
- Netherlands
- Poland
- Belgium
- Sweden
- Rest of Europe
-
Asia-Pacific
- China
- India
- Japan
- Australia
- Indonesia
- South Korea
- Thailand
- Singapore
- Rest of Asia-Pacific
-
South America
- Brazil
- Argentina
- Colombia
- Chile
- Peru
- Rest of South America
-
Middle East and Africa
- South Africa
- Saudi Arabia
- United Arab Emirates
- Nigeria
- Egypt
- Morocco
- Turkey
- Rest of Middle East and Africa
-
North America
Data Sources, Market Sizing, and Validation
Desk Research
Desk research was used to map the supply chain and to anchor the model with measurable signals before assumptions were taken into interviews. We relied on public sources such as the US Alcohol and Tobacco Tax and Trade Bureau (TTB), US FDA references for food-contact and ingredient compliance, Eurostat trade statistics, UN Comtrade, and FAO crop balance and production data for key feedstocks.
Along with these, we reviewed company annual reports, investor presentations, and reputable press coverage to understand capacity moves, plant utilization discussions, and demand shifts across end uses like beverages and flavor extraction. A paid subscription for company financials and another for shipment-level import and export data were used selectively to cross-check producer scale and trade flows where public data was too aggregated. These desk research sources are illustrative only, and other public documents and datasets were also used to collect, verify, and clarify the analysis.
Primary Interviews and Surveys
Primary work focused on validating how food grade specifications affect pricing and mix, and what gets counted as food grade versus adjacent industrial grades. We spoke with a mix of producers, distributors, procurement teams at food and beverage manufacturers, and technical stakeholders, then pressure-tested regional assumptions across APAC, EMEA, and the Americas until the drivers matched what was seen in trade and capacity signals.
Distribution of primary research fieldwork respondents
| Company type | Respondent position | Region |
|---|---|---|
| Top tier: 32% | CXOs: 15% | APAC: 51% |
| Mid tier: 50% | Functional/Unit leaders: 34% | EMEA: 30% |
| Smaller Players: 18% | Managers: 51% | Americas: 19% |
Market-Sizing & Forecasting
Sizing starts with a top-down build where production, trade, and end-use demand signals are reconstructed into a food-grade demand pool, then converted into value using price ladders that reflect purity, certification, and typical contract structures. To keep totals realistic, we corroborated results with selective bottom-up checks, such as sampling key suppliers, applying observed price ranges to plausible volumes, and running channel checks on distribution intensity.
Key inputs (illustrative) included: regional beverage output trends, growth in flavor and extract manufacturing, availability and price direction of major feedstocks (like grains and sugar-based inputs), import and export movements for ethanol and relevant polyols, and observed spreads between industrial and food grade pricing. Forecasting was done using scenario analysis supported by simple regression relationships between end-use growth and consumption intensity, then adjusted with expert feedback when policy, feedstock shocks, or capacity additions were expected to change the usual pattern. Where bottom-up data was missing for smaller markets, gaps were handled by applying validated per-capita or per-output intensity factors to the closest comparable country group, and then cross-checking against trade and producer presence.
Data Validation & Update Cycle
Outputs were checked through triangulation across independent signals, so volumes implied by demand drivers were compared against trade flow direction, known capacity changes, and realistic utilization bands. When a country or end use showed a sudden jump, it was re-reviewed, the underlying price and mix assumptions were revisited, and respondents were re-contacted if the variance could not be explained by a clear event.
Before sign-off, the model and assumptions go through a multi-step analyst review to keep arithmetic, unit conversions, and currency timing consistent across regions. The report is refreshed annually, and interim updates are made when material events occur (for example, major capacity announcements, regulatory shifts, or feedstock disruptions). Right before delivery, we run a fresh pass on key indicators so clients receive the latest updated view.
Mordor Intelligence's Food Grade Alcohol Market Size Compared Against Other Published Estimates
Published market sizes for food grade alcohol can look far apart because different studies do not always count the same products, end uses, or even the same grade definitions. The spread also comes from how prices are applied, how quickly assumptions are refreshed, and whether trade and capacity signals are used to keep results grounded.
The main gap comes from whether industrial and fuel ethanol streams are blended into the total, and how polyols are treated when they are used in foods but sold through broader chemical channels. Some estimates also apply aggressive price escalation without separating certification-driven price spreads, which can lift the value line quickly even if volumes are not changing at the same speed. In our work, the market total is kept tied to food-safety compliant volumes and realistic price ladders, and Mordor Intelligence only counts volumes as food grade when they meet food-grade certification and are directed to ingestible applications, which removes denatured and fuel-linked streams that inflate some published totals.
Benchmark comparison
| Source | Market Size | Gaps in Research Methodology |
|---|---|---|
| Mordor Intelligence | USD 4.62 B (2026) | |
| Industry Data Publisher A | USD 6.70 B (2024) | Uses a broader application mix that includes personal care and does not clearly separate food-grade certified volumes from adjacent industrial supply, which can raise the starting value. |
| Global Publisher B | USD 6.74 B (2025) | Counts a wider set of end uses and provides limited visibility on price ladder construction across regions, so certification-driven spreads and currency timing may be applied more aggressively. |
The comparison shows that the biggest differences usually come from scope choices first, then from price and mix handling. By keeping inclusions specific to certified food-grade supply, and by cross-checking implied demand with trade and capacity signals, the sizing steps stay traceable and repeatable when users want to rebuild the logic for their own planning.


Key Questions Answered in the Report
What is the current value of the food grade alcohol market?
In 2026 the food grade alcohol market is valued at USD 4.62 billion and is projected to reach USD 5.49 billion by 2031.
Which product type dominates the food grade alcohol market?
Ethanol dominates with a 78.12% share in 2025, while polyols are growing fastest at a 5.23% CAGR.
Why is Asia-Pacific the fastest-growing region?
Rapid expansion of food processing facilities, higher disposable incomes, and evolving dietary patterns push Asia-Pacific to a 5.11% CAGR through 2031.
How do excise taxes affect the food grade alcohol market?
Rising excise taxes, such as Australia’s above-inflation hikes and the US federal levy, raise input costs and can dampen demand in downstream food and beverage sectors.
Page last updated on:


 Your data is secure and never sold or shared.


