
Market Overview
| Study Period | 2021 - 2031 |
|---|---|
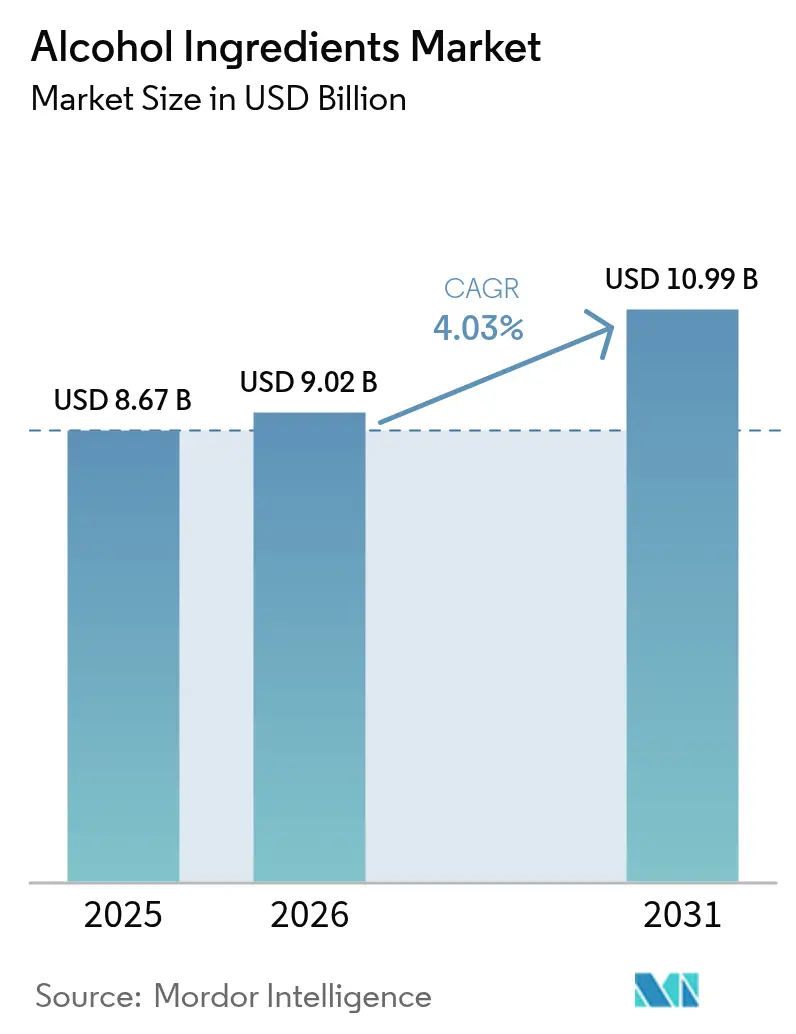
| Market Size (2026) | USD 9.02 Billion |
| Market Size (2031) | USD 10.99 Billion |
| Growth Rate (2026 - 2031) | 4.03 % |
| Fastest Growing Market | North America |
| Largest Market | Europe |
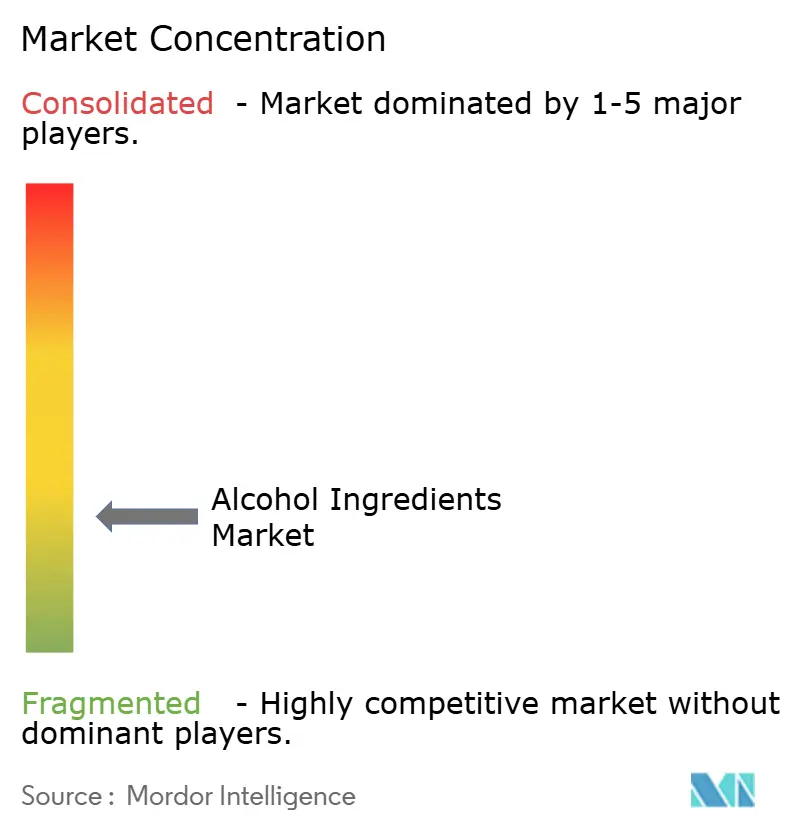
| Market Concentration | Low |
Major Players *Disclaimer: Major Players sorted in no particular order Image © Mordor Intelligence. Reuse requires attribution under CC BY 4.0. | |
Alcohol Ingredients Market Analysis by Mordor Intelligence
The global alcohol ingredients market size in 2026 is estimated at USD 9.02 billion, growing from 2025 value of USD 8.67 billion with 2031 projections showing USD 10.99 billion, growing at 4.03% CAGR over 2026-2031. This growth stems from consumers increasingly favoring premium, craft, and natural alcohol products, which has pushed manufacturers to adapt their ingredient selections. The spirits segment has shown particular strength, growing at 5.1% annually over the past decade compared to traditional beer categories. However, manufacturers must navigate complex regulatory requirements, including the FDA's synthetic dye restrictions and EFSA's ingredient evaluations, while also managing climate-related supply chain challenges. The industry is also responding to sustainability demands, as major beverage companies target net-zero emissions by 2040-2045, driving a shift toward regenerative agriculture and carbon-neutral production in ingredient sourcing.
Key Report Takeaways
- By ingredient type, malt ingredients led with 75.88% of alcohol ingredients market share in 2025, type, flavors and salts are projected to expand at a 4.87% CAGR to 2031.
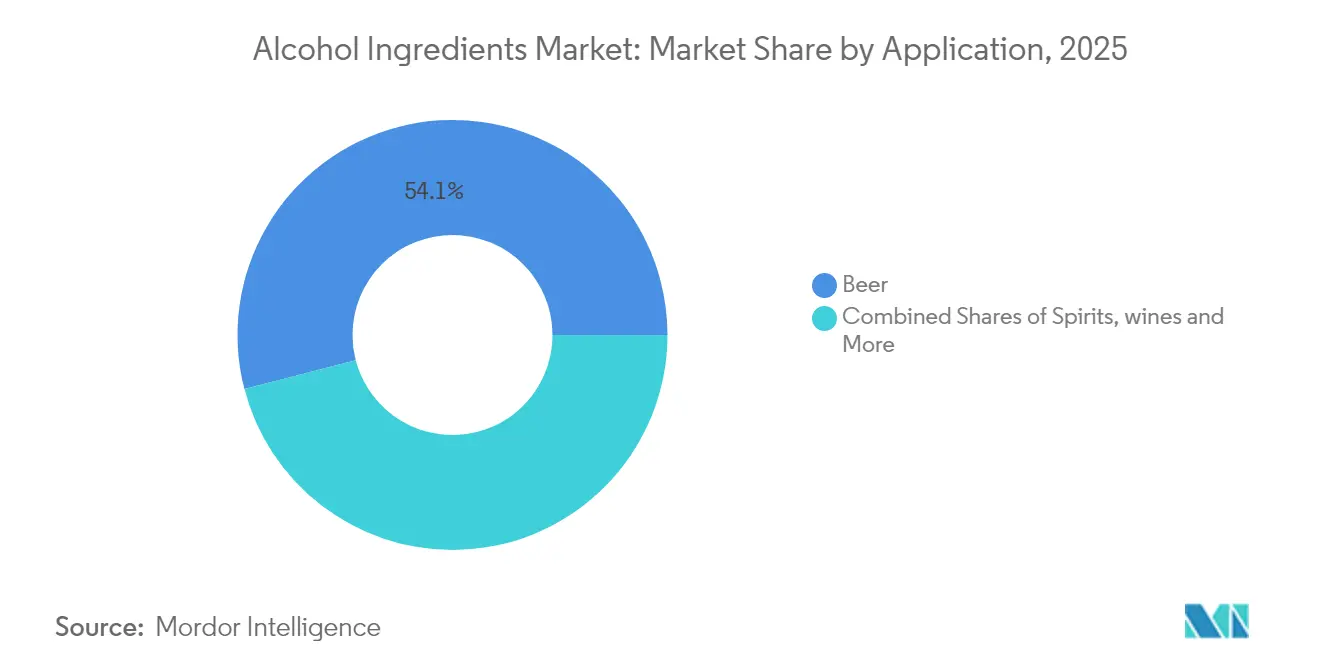
- By application, beer accounted for a 54.05% share of the alcohol ingredients market size in 2025.wine is forecast to advance at a 4.68% CAGR through 2031.
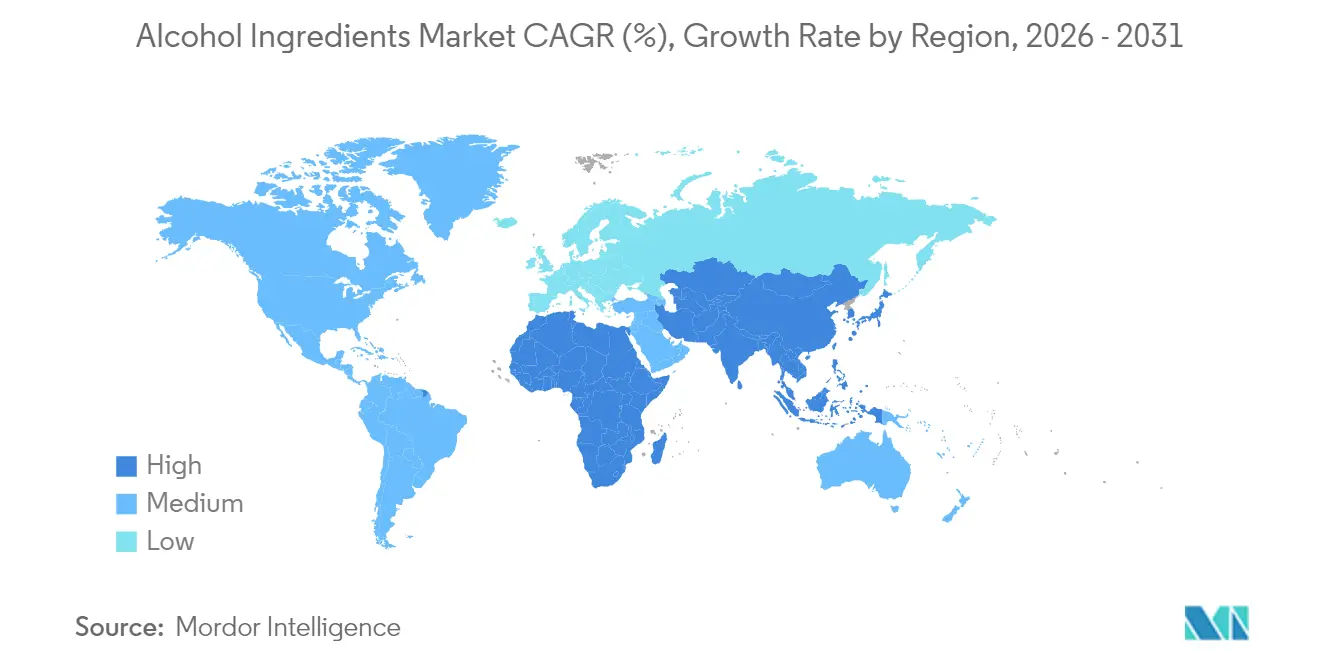
- By geography, Europe commanded 33.29% revenue share in 2025,North America is projected to record the fastest regional CAGR at 4.79% between 2026 and 2031.
Note: Market size and forecast figures in this report are generated using Mordor Intelligence’s proprietary estimation framework, updated with the latest available data and insights as of 2026.
Market Trends and Insights
Drivers Impact Analysis of Alcohol Ingredients Market*
| Driver | (~) % Impact on CAGR Forecast | Geographic Relevance | Impact Timeline |
|---|---|---|---|
| Rising demand for premium and craft alcoholic beverages | +1.2% | Global, with concentration in North America & Europe | Medium term (2-4 years) |
| Ongoing innovations in ingredient formulations | +0.7% | Global, led by North America & Asia-Pacific | Long term (≥ 4 years) |
| Trend toward natural, organic, and clean-label alcohol ingredients | +0.8% | Europe & North America core, expanding to APAC | Medium term (2-4 years) |
| Advancements in fermentation and production technologies | +0.6% | Global, with early adoption in developed markets | Long term (≥ 4 years) |
| Shift in consumer preferences toward exotic and unique flavors | +0.5% | North America & APAC primarily | Short term (≤ 2 years) |
| Increasing interest in botanical extracts, adaptogens, and functional additives | +0.4% | North America & Europe, emerging in APAC | Medium term (2-4 years) |
| Source: Mordor Intelligence | |||
Rising Demand for Premium and Craft Alcoholic Beverages
Premium spirits have significantly increased their share of international spirits value over the last decade, with super-premium segments experiencing substantial growth compared to standard tiers. This shift toward premium products has led ingredient suppliers to develop specialized formulations that provide complex sensory profiles and authenticity markers for quality-focused consumers. Craft distilleries now source botanical extracts, heritage grains, and specialized yeast strains to create distinctive products, generating demand for ingredients that command higher premiums than standard alternatives. This trend benefits suppliers of specialty flavor compounds and natural colorants, as craft producers avoid synthetic additives to maintain their artisanal identity. While North America and Europe dominate this market due to their established craft beverage sectors, the Asia-Pacific region shows increasing premiumization trends that indicate potential growth opportunities.
Ongoing Innovations in Ingredient Formulations
Advances in fermentation technology enable ingredient manufacturers to develop compounds that address beverage formulation challenges. For example, Novozymes introduced specialized enzymes for distilling applications that optimize production efficiency while maintaining flavor profiles. The company's fermentation platforms produce functional ingredients, including adaptogens and nootropics, which combine alcohol and wellness attributes to meet evolving consumer preferences for relaxation without alcohol's effects. These technological developments particularly benefit low- and no-alcohol beverage formulations, where ingredients must replicate alcohol's sensory characteristics through alternative compounds. The implementation timeline continues to extend due to stringent regulatory approval requirements and the complex process of commercial scaling for biotechnology-derived ingredients in the beverage industry.
Trend Toward Natural, Organic, and Clean-Label Alcohol Ingredients
Organic alcohol represents a small portion of global wine sales and is projected to experience significant growth through the end of this decade, driven by consumer demand for transparent and sustainable production methods. This market shift creates supply constraints for organic barley and other certified ingredients, as agricultural conversion requires a multi-year transition period, limiting immediate availability. The demand for natural colorants is increasing as producers move away from synthetic dyes, with anthocyanins and carotenoids receiving regulatory approval across multiple regions despite their higher costs and stability challenges. The clean-label trend is particularly strong in European and North American markets, where regulatory frameworks support organic certification and consumers demonstrate willingness to pay premiums for natural ingredients. Major beverage companies, including Diageo, source the majority of raw materials locally in key markets, supporting the traceability requirements necessary for clean-label positioning.
Advancements in Fermentation and Production Technologies
Precision fermentation technologies enable the production of complex ingredients that were previously only available through traditional extraction methods. Liberation Labs secured substantial funding to construct large-scale fermentation facilities for producing animal-free proteins and functional compounds at commercial scale [1]. These platforms benefit alcohol ingredient manufacturers by ensuring consistent quality and supply security for specialty compounds that traditional agriculture cannot reliably produce. Precision fermentation also enables the conversion of food waste streams into fermentable materials, reducing costs while addressing sustainability goals. The technology's widespread adoption depends on significant capital investment in fermentation infrastructure and regulatory approval timelines for new ingredients.
Restraints Impact Analysis of Alcohol Ingredients Market*
| Restraint | (~) % Impact on CAGR Forecast | Geographic Relevance | Impact Timeline |
|---|---|---|---|
| Stringent regulations governing alcohol production, use, and labeling | -0.5% | Global, with varying intensity by jurisdiction | Short term (≤ 2 years) |
| Consumer skepticism toward synthetic additives | -0.3% | Europe & North America primarily | Medium term (2-4 years) |
| Difficulty in maintaining ingredient purity and quality | -0.4% | Global, particularly in emerging markets | Medium term (2-4 years) |
| Shelf-life limitations and stability issues with certain ingredients | -0.3% | Global, affecting natural ingredients primarily | Short term (≤ 2 years) |
| Source: Mordor Intelligence | |||
Stringent Regulations Governing Alcohol Production, Use, and Labeling
The regulatory landscape for alcoholic beverage ingredients continues to evolve with increased oversight of safety and labeling requirements. The FDA's initiative to phase out synthetic dyes affects colorant supplier compliance [2], while EFSA's evaluation of botanical ingredients impacts suppliers of herbal extracts and adaptogens [3]. In the United States, TTB labeling regulations require detailed ingredient disclosure, which enhances transparency but challenges suppliers' ability to protect proprietary formulations. The regulatory requirements differ across regions, with European markets typically requiring more comprehensive safety documentation compared to emerging markets. This creates variations in ingredient approval timelines and compliance expenses. These regulations directly influence product launches and market entry strategies.
Consumer Skepticism Toward Synthetic Additives
Consumer awareness regarding ingredient lists has driven a significant shift toward natural alternatives over synthetic additives in the beverage industry. Despite synthetic versions providing enhanced functionality and cost advantages, consumers consistently choose natural options. This preference notably impacts preservatives, colorants, and flavor enhancers, as consumers associate these ingredients with industrial manufacturing processes rather than authentic beverage craftsmanship. To address this market evolution, ingredient suppliers are making substantial investments in natural extraction technologies and organic certification programs, though these changes result in higher production expenses and potential challenges with product longevity and uniformity. While ingredient manufacturers continue their efforts to educate consumers about the safety of synthetic ingredients through various communication channels, the market demonstrates an unwavering preference for natural ingredients, regardless of the functional compromises this choice may entail.
*Our forecasts treat driver/restraint impacts as directional, not additive. The impact forecasts reflect baseline growth, mix effects, and variable interactions.
Alcohol Ingredients Market Segment Analysis
By Ingredient Type:
Malt Dominance Faces Flavor InnovationMalt ingredients continue to dominate the market share, maintaining their strong position as the primary component in the global alcohol consumption landscape, particularly in beer production. The flavors and salts category has emerged as the segment experiencing the most rapid growth, showcasing the industry's evolution toward sophisticated taste profiles and premium offerings that extend beyond conventional brewing applications.
Leading malting companies, including Malteurop and Boortmalt, have made significant investments in innovative malting technologies and environmentally conscious malt processing methods. These advancements not only minimize environmental impact but also provide brewers and distillers with an extensive range of flavor possibilities. The malt segment's growth is further supported by industry-wide sustainability initiatives, exemplified by major brewing companies like Molson Coors, which has established comprehensive sustainable barley sourcing goals while implementing measures to reduce water consumption in agricultural processes.


By Application:
Beer Leadership Yields to Wine InnovationBeer applications currently dominate the market share, maintaining a substantial portion of the total market value. Meanwhile, the wine segment has emerged as the segment with the highest growth rate, projected to expand significantly over the forecast period. The wine segment's expansion is primarily attributed to the implementation of sustainable fining agents and innovations in natural production methods.
This notable market development reflects wine's increasing premium market positioning and the widespread adoption of clean-label ingredients that align with evolving consumer health preferences. Recent advancements in wine ingredients include the development of plant-based fining alternatives to replace traditional animal-derived products, organic nitrogen additives for natural fermentation processes, and wine lees valorization methods that transform production waste into valuable compounds. The regulatory framework in Europe, which actively supports organic certification and biodynamic production methods, continues to strengthen the wine segment's growth trajectory.
Geography Analysis
Europe Alcohol Ingredients Market
Europe stands as the cornerstone of the market, commanding a robust 33.29% share in 2025, built upon generations of brewing and distilling expertise. The region's success stems from its deep-rooted philosophy of prioritizing quality craftsmanship over mass production. Under the vigilant oversight of EFSA and national quality standards, European ingredient suppliers must maintain comprehensive safety documentation and organic certifications to operate in the market. The craft brewing industry, while growing steadily, remains firmly anchored in its heritage, utilizing traditional ingredients and time-tested production methods that justify premium pricing. Environmental consciousness shapes the industry's future, with companies like Carlsberg leading the charge through their commitment to 100% regenerative raw materials by 2040. The region's strong cultural connection to terroir and protected designation of origin creates valuable opportunities for ingredient suppliers who can authenticate their products' heritage and traditional production methods.
North America Alcohol Ingredients Market
North America demonstrates remarkable market momentum, projecting a 4.79% CAGR through 2031, fueled by an innovative craft beverage movement that continuously pushes boundaries in flavor and production techniques. The region's maturing craft brewing segment actively seeks specialized ingredients, from unique botanical extracts to heritage grains and novel yeast strains, enabling brewers to distinguish themselves in competitive markets. The regulatory environment, overseen by the FDA and TTB, creates distinct compliance pathways that encourage innovation in fermentation technology and ingredient processing. Industry leaders like AB InBev are reshaping the supply chain through ambitious sustainability goals, including their net-zero target by 2040 and successful implementation of 100% renewable energy brewing operations in Europe.
APAC, South America and MEA Alcohol Ingredients Market
The Asia-Pacific region represents a frontier of opportunity, where rapid economic growth drives premium product demand and evolving regulatory frameworks support ingredient innovation. The region's immense population base and growing middle class present substantial volume potential, despite having less standardized regulatory processes than Western markets. Traditional fermentation expertise in China and Japan provides a unique foundation for ingredient innovation, effectively combining ancient wisdom with modern production requirements. In parallel, South America and Middle East & Africa, while smaller in market share, offer strategic value through opportunities in local ingredient sourcing and climate-adapted production methods, particularly for suppliers who understand regional preferences and regulatory landscapes.
Regulatory Landscape
Regulation for alcohol ingredients is increasingly shaped by tighter additive specifications and greater label transparency across major markets. In the European Union, Commission Regulation (EU) 2024/374 amended the food additives framework under Regulation (EC) No 1333/2008 for alcoholic beverages, refining category definitions relevant to ingredient selection and permissible uses in beverage formulations. In the United States, the Alcohol and Tobacco Tax and Trade Bureau (TTB) advanced proposed changes in January 2025 toward mandatory "Alcohol Facts"-style disclosures and major food allergen labeling for wine, distilled spirits, and malt beverages, raising the compliance burden for suppliers supporting multi-SKU portfolios.
Ingredient specifications and approval pathways are also shifting, with direct implications for stabilizers and novel inputs used by brewers, vintners, and distillers. Commission Regulation (EU) 2026/196 updated use conditions and specifications for several thickeners and stabilizers (including carrageenan (E 407) and locust bean gum (E 410)), with an application date of 18 August 2026, prompting suppliers to reconfirm documentation, specifications, and downstream formulation impacts. Commission Implementing Regulation (EU) 2026/397 authorized lacto-N-tetraose produced by Escherichia coli K-12 MG1655 as a novel food. This highlights ongoing scrutiny of biotechnology-derived ingredients and reinforces the need for robust dossiers when introducing new fermentation-derived components.
Value Chain Analysis
The alcohol ingredients value chain starts with agricultural and bio-based inputs (barley and other grains, hops, grapes, sugar sources, and botanicals) plus industrial intermediates used to produce yeast, enzymes, colorants, flavors, and processing aids. Upstream volatility is driven by seasonality and climate sensitivity of key crops, limited extraction capacity for high-value botanicals, and strain-specific constraints in yeast supply. Ingredient manufacturers then convert these feedstocks through malting, extraction, fermentation, and enzyme processing, while differentiating via application support (beer, spirits, wine) and regulatory documentation packages tied to customer labeling and quality systems.
Distribution runs from global ingredient companies and specialized distributors into breweries, distilleries, wineries, and contract beverage producers, with logistics and packaging costs shaping formulation economics. Shipping and port congestion can extend lead times and working capital cycles, while documentation and labeling requirements create friction for cross-border movements of ingredients and finished beverages. Trade groups such as FIVS and the World Spirits Alliance help coordinate trade and standards engagement for market access. Downstream operational variability, including reported production pauses at some distilleries amid cost pressures, can translate into order volatility for ingredient suppliers, particularly for specialty inputs used in premium and craft launches.
Competitive Landscape
The alcohol ingredients market is led by multinational suppliers who command significant market share through their extensive product portfolios and global reach. Companies like Cargill, DSM-Firmenich, and Kerry Group dominate the commodity ingredients segment through their economies of scale, while smaller firms maintain strong positions in specialized applications such as botanical extraction, fermentation optimization, and natural colorant production.
The fastest-growing segment within the market is driven by companies focusing on sustainable and innovative solutions. This growth is exemplified by strategic moves such as Novonesis's EUR 1.5 billion acquisition of DSM-Firmenich's Feed Enzyme Alliance share to enhance enzyme production capabilities. Companies in this segment are rapidly expanding their presence in sustainable ingredient production, fermentation-derived functional compounds, and natural alternatives to synthetic additives that align with clean-label consumer preferences.
Other market segments include biotechnology companies and regional producers who are gradually gaining market share through specialized offerings. These companies are investing in technological advancements, including precision fermentation platforms, AI-enhanced ingredient optimization, and blockchain traceability systems. Success in these segments increasingly depends on environmental credentials, regulatory compliance, and technical innovation rather than price competition in commodity-grade ingredients.
Alcohol Ingredients Industry Leaders
-
Cargill Inc.
-
Archer Daniels Midland
-
Kerry Group plc
-
DSM-Firmenich
-
Novozymes A/S
- *Disclaimer: Major Players sorted in no particular order
Alcohol Ingredients Market Companies Covered in this Report
- Cargill Inc.
- Archer Daniels Midland
- Kerry Group plc
- DSM-Firmenich
- Novozymes A/S
- Sensient Technologies Corp.
- Döhler GmbH
- Lallemand Inc.
- Lesaffre
- Novozymes A/S
- Treatt plc
- DDW, The Color House
- AB Enzymes
- Givaudan SA
- International Flavors & Fragrances
- Angel Yeast Co. Ltd.
- Ashland Global Holdings
- Ingredion Inc.
- Savory Flavors Ltd.
- Symrise AG
Market Opportunities and Future Outlook
Product development for low- and no-alcohol beverages is creating a focused opportunity for enzymes, flavors, and fermentation solutions that deliver mouthfeel, body, and sensory complexity without ethanol. In April 2026, IFF launched Diazyme Nolo (a transglucosidase enzyme) positioned to help produce fuller-bodied non-alcoholic beer, and dsm-firmenich filed a global patent for flavor molecules designed to replicate alcohol-like warming and mouthfeel. Together, these moves point to active R&D investment focused on sensory reconstruction. Separately, academic and applied innovation in yeast and fermentation, including published work on improving wine-yeast thiol release via targeted genetic approaches, is expanding the toolkit available to ingredient suppliers supporting premium beer, spirits, and wine producers seeking differentiated aromas and clean-label positioning.
Industrial alcohol and ethanol capacity build-outs also reshape sourcing optionality for beverage and beverage-adjacent applications, particularly where customers prioritize consistent quality, traceability, and sustainability credentials. In June 2026, POET broke ground on an expansion at its POET Bioprocessing Shelbyville facility in Indiana to increase annual bioethanol capacity from 98 million gallons to 193 million gallons. In March 2026, Gevo announced plans for a second ethanol facility at its Richardton, North Dakota site, signaling continued investment in large-scale fermentation infrastructure. Even where new capacity is not dedicated to beverage-grade alcohol, these projects illustrate the scale-up of fermentation assets and the associated opportunity for suppliers of enzymes, processing aids, and fermentation inputs to support efficiency, yield optimization, and specification control across industrial and beverage-linked production pathways.
Recent Industry Developments in Alcohol Ingredients Market
- June 2026: Archer Daniels Midland (ADM) expanded its Customer Creation and Innovation Center in Hungary to support beverage development across Eastern Europe. The upgraded center increases formulation and prototyping support for beverage customers using functional ingredients, accelerating regional innovation cycles and shortening time-to-market for differentiated alcohol and alcohol-adjacent beverage concepts.
- February 2026: dsm-firmenich announced an agreement to divest its Animal Nutrition and Health business to CVC Capital Partners. The transaction reshapes the company portfolio and clarifies the separation of feed-enzyme activities, influencing how fermentation and enzyme capabilities are prioritized and marketed across food and beverage ingredient end uses.
- February 2025: Novonesis completed its EUR 1.5 billion acquisition of DSM-Firmenich's share in the Feed Enzyme Alliance, dissolving the joint venture. Full control over enzyme production and commercialization strengthens its ability to scale specialized enzymes used in fermentation-driven industries, including applications where distillers and brewers use enzymes to optimize conversion efficiency and flavor outcomes.
Alcohol Ingredients Market Report Scope and Research Methodology
Market Definition and Coverage
For this study, the alcohol ingredients market covers the commercially supplied inputs that are added during alcoholic beverage production to support fermentation, stability, flavor, and finished product consistency, and the market is measured in sales value.
Scope exclusions: It does not include the finished alcoholic beverages themselves or general farm commodities that are sold without ingredient-level value addition.
Segments Covered in This Report
- By Ingredient Type
- Yeast
- Enzymes
- Colorants
- Flavors and Salts
- Malt Ingredients
- Other Ingredients
- By Application
- Beer
- Spirits
- Whiskey
- Vodka
- Rum
- Brandy
- Gin
- Other Spirits
- Wine
- Others
- By Geography
- North America
- United States
- Canada
- Mexico
- Rest of North America
- Europe
- Germany
- United Kingdom
- Italy
- France
- Spain
- Netherlands
- Rest of Europe
- Asia-Pacific
- China
- India
- Japan
- Australia
- Rest of Asia-Pacific
- South America
- Brazil
- Argentina
- Rest of South America
- Middle East and Africa
- South Africa
- Rest of Middle East and Africa
- North America
Data Sources, Market Sizing, and Validation
Desk Research
Desk work starts by building the demand picture for beer, wine, and spirits production and then connecting that activity back to ingredient use. We used public sources such as USDA datasets, Eurostat, the US TTB, FAO statistics, and UN Comtrade to track beverage output signals, trade flows, and shifts in agricultural inputs that influence ingredient pricing.
We also reviewed company filings, investor decks, technical notes from brewer and distiller associations, patents, and credible news coverage to map product positioning, typical use cases, and channel structure. Where needed, paid subscriptions for company financials and patent databases were used to cross-check revenue exposure and innovation activity for relevant ingredient categories. These desk research sources are illustrative only, and many other references were also used for collection, validation, and clarification.
Primary Interviews and Surveys
Primary work was used to pressure-test assumptions that desk sources cannot confirm cleanly, such as how ingredient inclusion varies by beverage type and how pricing moves through contracts versus spot buying. We spoke with a mix of ingredient suppliers, beverage producers, and distributors across APAC, EMEA, and the Americas so the model reflects regional production patterns and real-world formulation practices, including premium and craft requirements.
Distribution of primary research fieldwork respondents
| Company type | Respondent position | Region |
|---|---|---|
| Top tier: 29% | CXOs: 14% | APAC: 46% |
| Mid tier: 57% | Functional/Unit leaders: 35% | EMEA: 36% |
| Smaller Players: 14% | Managers: 51% | Americas: 18% |
Market-Sizing & Forecasting
Sizing was built using a top-down approach where alcoholic beverage production and consumption indicators are translated into an ingredient demand pool using practical usage factors, and then priced to value using observed and interview-validated ranges. Results were then checked with selective bottom-up approximations, such as supplier revenue exposure to alcohol applications, sampled price points by ingredient group, and channel feedback on volume movement, with totals adjusted when gaps showed up.
Key inputs tracked included beer and spirits production volumes, trade intensity for relevant ingredient groups, changes in product mix toward premium and craft, average inclusion rates for yeast and enzymes by process type, and price movement linked to agricultural and energy cost signals. When forecasts were built, scenario analysis was used so different outcomes for premiumization, regulatory tightening on additives, and raw material volatility could be reflected without forcing a single path.
If a country or ingredient line had thin public data, we used regional proxies and interview ratios, followed by a second check against beverage output trends so the final number stays anchored to a realistic production base.
Data Validation & Update Cycle
Validation is done through stepwise checks so the market does not drift away from real demand signals. Model outputs are compared against independent indicators, including beverage production direction, ingredient trade movement, and reported pricing changes, and then variances are investigated before sign-off.
Reviews are completed across analysts so assumptions on usage rates, currency conversion timing, and price progression are rechecked for consistency. Reports are refreshed annually, with interim updates when material events occur, such as sharp raw material price shocks or regulatory changes that affect permissible additives. Before delivery, a final pass is completed so clients receive the latest updated view.
Mordor Intelligence's Alcohol Ingredients Market Size Versus Other Published Estimates
Published market values for alcohol ingredients often differ because each publisher makes its own calls on what counts as an ingredient, which year is treated as the starting point, and how pricing is carried forward across regions. Differences also show up when some studies emphasize a single beverage category more heavily, or when exchange-rate timing and inflation treatment are not aligned.
Some external estimates appear to cover a narrower set of specialty additives and exclude large value pools tied to core brewing inputs. In Mordor Intelligence's view, malt ingredients and other routinely used inputs are counted alongside yeast, enzymes, and flavor or color systems, and values are kept consistent by linking them back to beverage production signals and validated inclusion rates.
Benchmark comparison
| Source | Market Size | Gaps in Research Methodology |
|---|---|---|
| Mordor Intelligence | USD 9.02 B (2026) | |
| Global Consultancy A | USD 3.14 B (2025) | Uses a smaller starting year and commonly focuses on a tighter ingredient basket, which can understate markets where malt-related inputs represent a large share of spend. |
| Industry Research House B | USD 2.91 B (2024) | Anchors sizing to an earlier base year and may treat parts of the brewing input stack as raw materials rather than ingredients, which shifts value outside the counted scope. |
The spread in the table is mainly explained by what is included in the ingredient basket and how the base year is anchored. By tying demand to beverage output and then applying transparent usage and pricing logic, the estimate stays repeatable and easier to reconcile when assumptions need to be updated.
Key Questions Answered in the Report
What is the projected value of the alcohol ingredients market in 2031?
The alcohol ingredients market is expected to reach USD 10.99 billion by 2031.
Which ingredient type currently holds the largest revenue contribution?
Malt ingredients account for 75.88% of revenue owing to beer’s volume dominance.
Which application segment is forecast to grow fastest through 2031?
Wine ingredients are projected to expand at a 4.68% CAGR as producers adopt sustainable fining and clean-label inputs.
Which region will record the highest CAGR during 2026-2031?
North America is set to grow at a 4.79% CAGR, driven by craft beverage innovation and premiumization.
What regulatory trend most affects ingredient formulation strategies?
Upcoming phase-outs of certain synthetic dyes and stricter botanical assessments by FDA and EFSA elevate compliance costs and favor natural alternatives.