Market Overview
| Study Period | 2021 - 2031 |
|---|---|
| Market Size (2026) | USD 19.92 Billion |
| Market Size (2031) | USD 26.71 Billion |
| Growth Rate (2026 - 2031) | 6.05% CAGR |
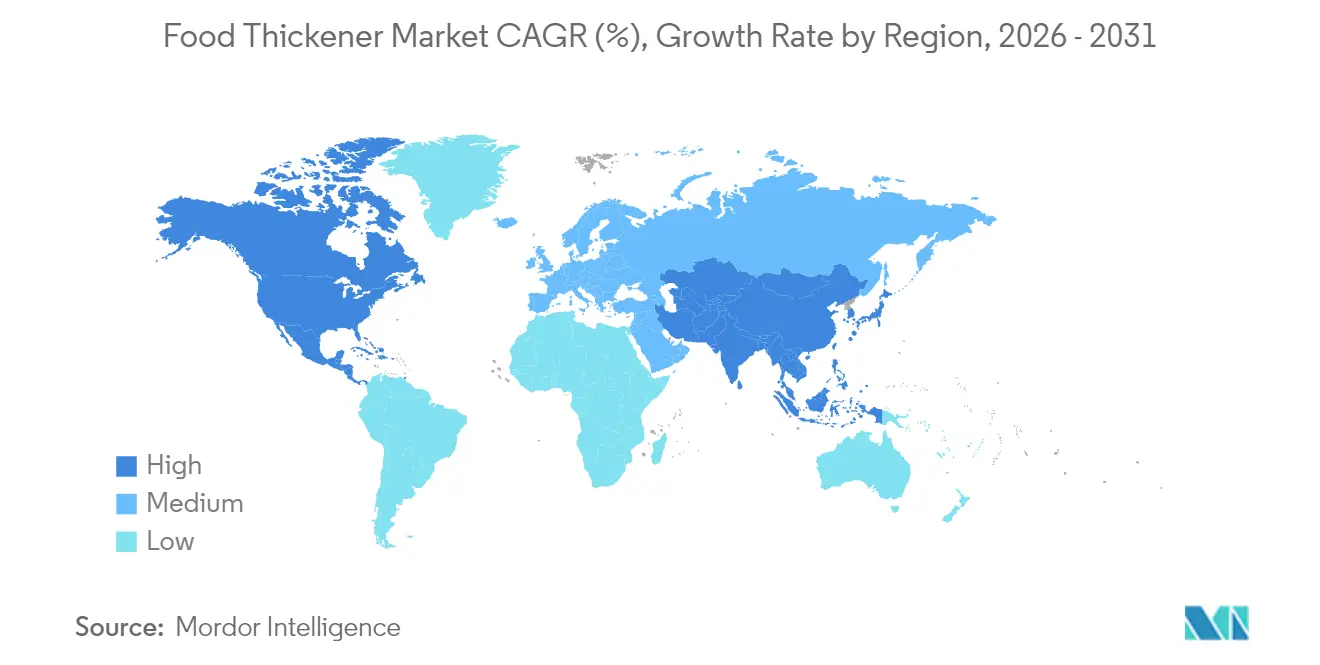
| Fastest Growing Market | Asia Pacific |
| Largest Market | North America |
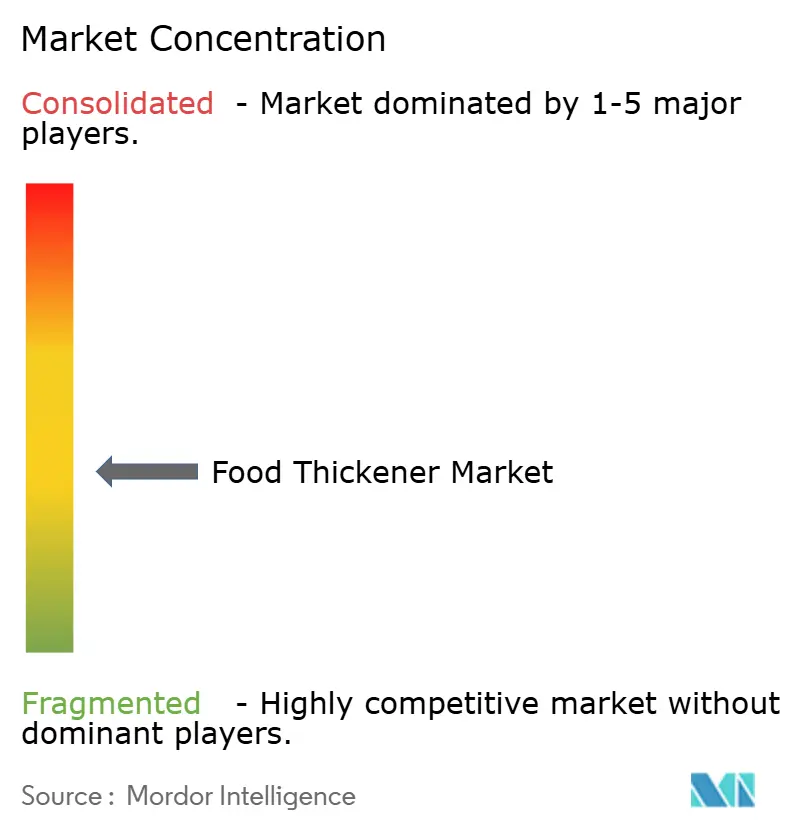
| Market Concentration | Medium |
Major Players
*Disclaimer: Major Players sorted in no particular order Image © Mordor Intelligence. Reuse requires attribution under CC BY 4.0. |
|
Food Thickener Market Analysis by Mordor Intelligence
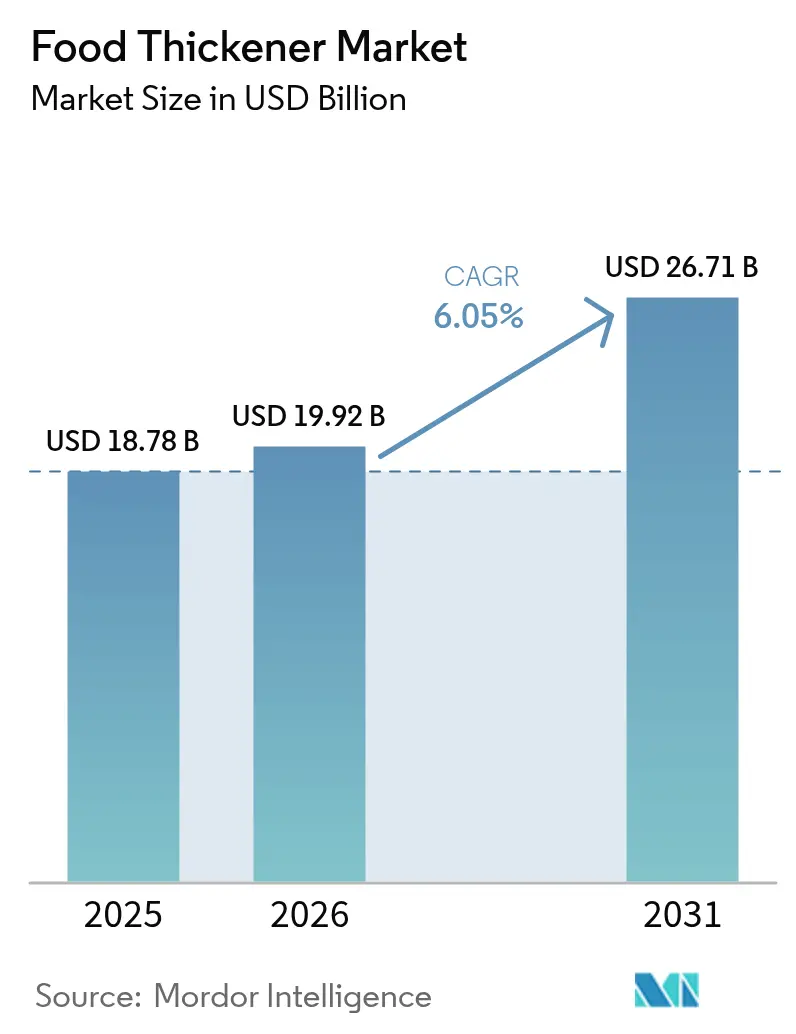
Food thickener market size in 2026 is estimated at USD 19.92 billion, growing from 2025 value of USD 18.78 billion with 2031 projections showing USD 26.71 billion, growing at 6.05% CAGR over 2026-2031. The steady rise reflects the ingredient's role in delivering stable texture across premium beverages, gluten-free lines and emerging plant-based foods. The versatility of food thickeners in these applications has led to increased adoption by manufacturers seeking to improve product mouthfeel and stability. Clean-label positioning, supported by wider GRAS recognition, raises adoption in North America, while Asia-Pacific processing capacity and regulatory alignment accelerate regional uptake. This trend is further strengthened by consumers' growing preference for natural and recognizable ingredients on product labels. Hydrocolloid blending now delivers dairy-like creaminess in vegan products, and precision fermentation reduces reliance on weather-sensitive crops. These technological advancements have enabled manufacturers to create plant-based alternatives that closely mimic traditional dairy products. At the same time, supply constraints for locust bean gum and heightened scrutiny of E-numbers push manufacturers toward familiar botanical names and alternative microbial sources. The shift towards botanical alternatives has opened new opportunities for ingredient suppliers to develop innovative natural solutions. A moderate level of market fragmentation allows both global suppliers and niche innovators to pursue differentiated strategies. This market structure has fostered healthy competition and continuous product development, benefiting both manufacturers and end-users.
Key Report Takeaways
- By category, natural thickeners led with 68.74% of the food thickener market share in 2025; their share of the food thickener market size is projected to expand at a 6.72% CAGR to 2031.
- By type, hydrocolloids accounted for 46.22% of the food thickener market size in 2025, while protein-based thickeners are set to grow at a 7.01% CAGR through 2031.
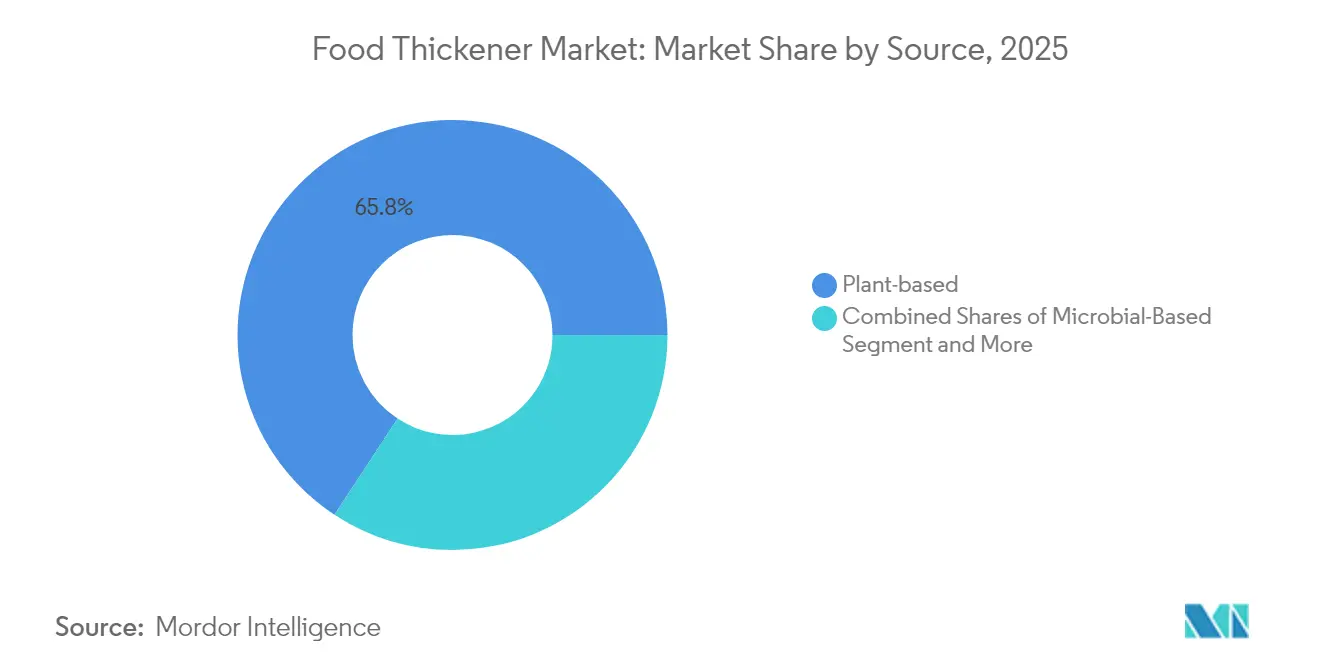
- By source, plant-derived inputs commanded 65.75% of the food thickener market size in 2025; microbial sources post the fastest 8.21% CAGR to 2031.
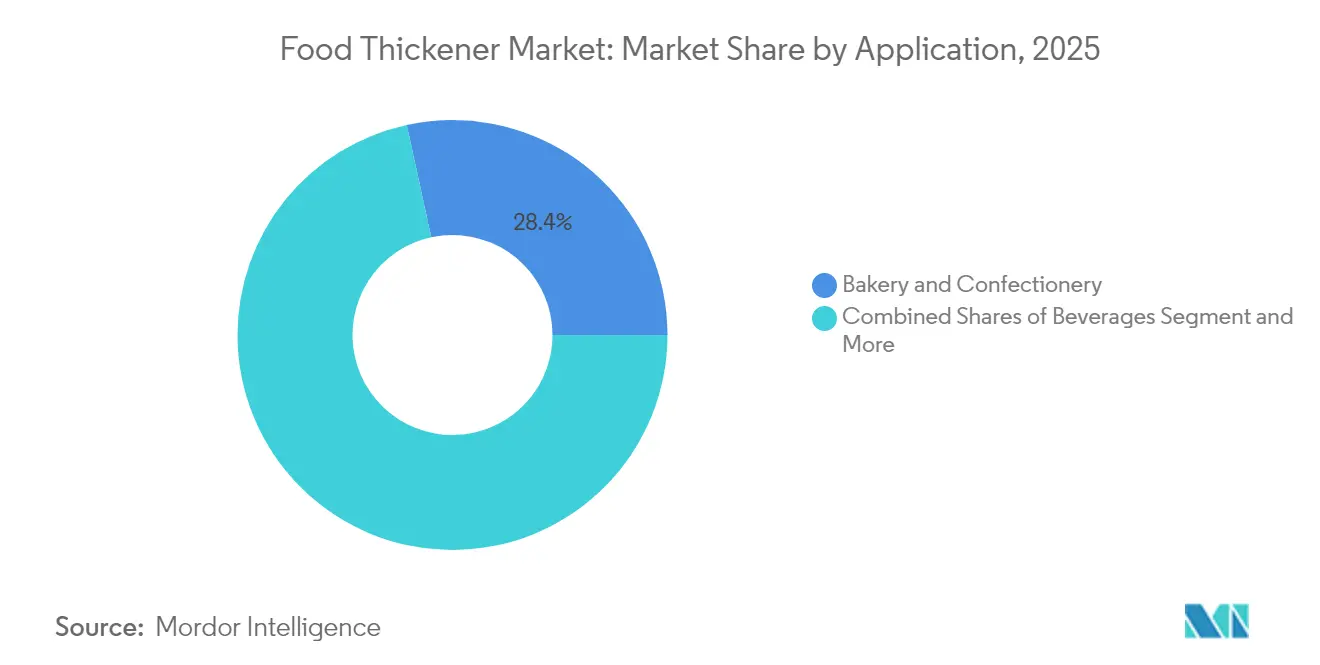
- By application, bakery and confectionery maintained 28.41% revenue share in 2025; beverages are forecast to expand at an 7.74% CAGR.
- By geography, North America held 38.02% of the food thickener market in 2025; Asia-Pacific records the highest 8.45% CAGR through 2031.
Note: Market size and forecast figures in this report are generated using Mordor Intelligence’s proprietary estimation framework, updated with the latest available data and insights as of 2026.
Global Food Thickener Market Trends and Insights
Drivers Impact Analysis*
| Driver | (~) % Impact on CAGR Forecast | Geographic Relevance | Impact Timeline |
|---|---|---|---|
| Rising demand for texture-enhanced processed food | +1.8% | Global, North America & Europe focus | Medium term (2-4 years) |
| Growth in gluten-free and allergen-free lines | +1.2% | North America & EU, extending to APAC | Long term (≥ 4 years) |
| Popularity of plant-based dairy and meat alternatives | +1.5% | Global, led by North America & Europe | Short term (≤ 2 years) |
| Rising use of clean-label ingredients | +1.1% | Global, strongest in developed markets | Long term (≥ 4 years) |
| Demand from bakery and confectionery | +0.9% | Global, APAC highest growth | Medium term (2-4 years) |
| Expansion in premium and artisanal beverages | +0.8% | North America & Europe, emerging in APAC | Short term (≤ 2 years) |
| Source: Mordor Intelligence | |||
Rising Demand for Texture-Enhanced Processed Food
Texture engineering has progressed from simple viscosity control to precise mouthfeel design, enabling manufacturers to create products with specific textural attributes that meet consumer preferences. The development of sophisticated texture analysis tools and methods has further enhanced the ability to measure and replicate desired mouthfeel characteristics. FDA [1]U.S Food and Drug Administration, "ood Additives Permitted for Direct Addition to Food for Human Consumption", www.ecfr.govrecognition of modified starches under 21 CFR Part 172 allows cross-linked variants to hold viscosity during thermal processing, while also ensuring product stability and shelf-life extension through improved heat and shear resistance. Sensory studies show that particle size in pea- and potato-based drinks determines perceived chalkiness, giving formulators clear targets for consumer acceptance, with research indicating that particles below 50 microns significantly reduce detection of graininess. Advanced hydrocolloid blends now mimic dairy creaminess in vegan items, opening premium pricing opportunities, as these innovative solutions address the growing demand for plant-based alternatives that maintain traditional dairy textures. Manufacturers that couple regulatory compliance with sensory science secure a competitive edge, boosting volume in convenience meals and ready-to-drink beverages, while also benefiting from increased consumer trust and market differentiation. Robust demand in these categories keeps the food thickener market on its upward course, with particular growth observed in clean-label and naturally-derived thickening agents.
Growth in Gluten-Free and Allergen-Free Product Lines
Gluten-free producers need thickening systems that replace wheat protein structure yet avoid cross-contamination. The absence of gluten necessitates specialized thickening agents that can replicate the binding and structural properties of wheat proteins. Research combining high-acyl gellan gum and low-methoxyl pectin improves fibrous texture in soy-based meats, helping brands satisfy celiac and allergen-free claims. These innovative combinations have demonstrated superior performance in maintaining product integrity and mouthfeel compared to traditional alternatives. EU Regulation EC 1333/2008 [2]European Commission, "EU regulates food additives under Regulation EC 1333/2008", food.ec.europa.eu imposes stringent labeling, concentrating innovation among suppliers with regulatory expertise. The regulation has led to increased investment in research and development of compliant thickening solutions. Hydrocolloids providing freeze-thaw stability are gaining traction as brands seek shelf-life parity with gluten-containing products. These specialized hydrocolloids have proven essential in maintaining product quality throughout the distribution chain and storage period. Demand has spread from North America to Asia-Pacific, inflating the food thickener market in bakery mixes, snacks and meat analogues. The expansion has been particularly notable in emerging economies where awareness of gluten-free diets is rapidly increasing.
Increasing Popularity of Plant-Based Dairy and Meat Alternatives
Precision fermentation yields animal-identical proteins for cheese or yogurt without livestock inputs, reducing environmental impact while preserving functionality. This technology enables manufacturers to create dairy alternatives that closely match conventional products in taste and texture. The growing consumer acceptance of these alternatives has accelerated research and development in this space. Xanthan gum in oat or almond milks maintains stable emulsions over long distribution chains. The stability provided by xanthan gum ensures consistent product quality and extends shelf life, making plant-based beverages more commercially viable. Achieving meat-like bite in plant proteins requires synergistic hydrocolloid–protein networks, which lifts ingredient value above commodity status. The development of these specialized protein networks has led to significant improvements in plant-based meat alternatives, driving increased investment in research and development. Brands that reach sensory parity command shelf premiums, reinforcing food thickener market growth across dairy-free desserts and hybrid meat products. The success of these products has encouraged more manufacturers to enter the alternative protein market, further expanding the demand for specialized food thickeners.
Rising Use of Clean-Label Ingredients
Most of the North American manufacturers rank clean labeling as highly important, with some citing revenue gains after reformulation. This trend reflects manufacturers' strategic response to evolving consumer preferences and market dynamics. Consumers pay more for recognizable inputs like tapioca flour over lettered additives, demonstrating their willingness to invest in products with transparent ingredient lists. FDA extensions of GRAS lists broaden natural thickener options, easing formulation, while enabling manufacturers to expand their clean-label product portfolios. Demand rises fastest among educated shoppers, spreading to mass channels as price differentials narrow, indicating a broader market acceptance of natural thickeners across consumer segments. The shift sustains natural options' dominance within the food thickener market, as manufacturers continue to innovate and develop new formulations to meet this growing demand.
Restraints Impact Analysis*
| Restraint | (~) % Impact on CAGR Forecast | Geographic Relevance | Impact Timeline |
|---|---|---|---|
| Stringent food additive regulation | -0.7% | Global, strictest in EU & North America | Long term (≥ 4 years) |
| Instability of thickeners over shelf life | -0.5% | Global, challenging in tropical climates | Medium term (2-4 years) |
| Labeling limits in organic-certified items | -0.4% | North America & EU organic markets | Long term (≥ 4 years) |
| Negative perception of E-numbers | -0.6% | Europe & developed APAC | Short term (≤ 2 years) |
| Source: Mordor Intelligence | |||
Stringent Food Additive Regulation
Jurisdictional differences elevate compliance costs across global markets. Japanese regulations list 472 designated additives, with approval processes taking nearly a year, significantly slowing the rollout of novel thickening systems. The stringent Japanese framework also requires extensive stability testing, local safety assessments, and detailed manufacturing process documentation. EFSA dossiers can exceed USD 1 million per ingredient, tilting advantage to multinationals able to fund comprehensive safety studies. The European approval process demands thorough toxicological data, clinical trials, and extensive documentation of production methods. Additionally, manufacturers must conduct regular audits and maintain detailed traceability records. China's GB 2760 mandates dosage caps that oblige separate SKUs for different regions, fragmenting inventories. The Chinese regulatory environment further necessitates regional testing facilities, local partnerships, and market-specific formulation adjustments. While consumer confidence rises, smaller firms struggle to absorb documentation costs, slightly restraining the food thickener market's pace. The burden of maintaining multiple certifications, conducting ongoing safety assessments, and adapting to evolving regulatory requirements particularly impacts emerging market players. The complexity of international compliance also creates barriers for new entrants seeking to expand their geographical presence.
Negative Consumer Perception of E-Numbers
Consumer distrust of E-numbers stems from communication failures rather than safety concerns, creating market opportunities for ingredients with familiar names regardless of their chemical similarity to synthetic alternatives. Research indicates that 55% of the European population actively avoids food additives due to health concerns, with perceived risks outweighing recognized benefits for most consumers. The Netherlands Nutrition Centre identifies negative past communications and media portrayals as primary drivers of E-number distrust, suggesting that transparent ingredient explanations could rebuild consumer confidence more effectively than defensive marketing approaches. Food manufacturers increasingly list thickening agents by common names rather than E-numbers, particularly for ingredients like xanthan gum (E415) that face consumer skepticism despite widespread use and safety approval. The perception gap between natural and synthetic thickeners creates pricing premiums for plant-derived alternatives even when their functional performance is identical to synthetic equivalents. This consumer behavior pattern rewards marketing sophistication over technical innovation, potentially slowing adoption of cost-effective thickening solutions that could reduce food prices.
*Our forecasts treat driver/restraint impacts as directional, not additive. The impact forecasts reflect baseline growth, mix effects, and variable interactions.
Segment Analysis
By Application: Bakery Leadership Faces Beverage Challenge
The bakery and confectionery segment maintains market leadership with 28.41% share in 2025, leveraging established formulation expertise and consumer acceptance of thickening agents in traditional baked goods applications. However, the beverages segment demonstrates the highest growth at 7.74% CAGR, driven by functional drink innovation and plant-based milk alternatives that require sophisticated stabilization systems. Beverage applications demand thickeners that maintain stability across temperature fluctuations, pH variations, and extended shelf life requirements while delivering clean taste profiles that don't interfere with flavor systems.
Sauces, dressings, and marinades represent mature applications where thickening performance is well-understood, creating competitive pressure based on cost efficiency rather than innovation. The snacks and savory segment benefits from texture innovation trends that use thickening agents to create novel mouthfeel experiences in processed snack foods. Dairy and frozen desserts require thickeners that perform across freeze-thaw cycles while maintaining creamy textures that justify premium pricing in competitive categories. The "Others" category includes emerging applications in meat alternatives, nutraceuticals, and specialty dietary products where thickening agents serve both functional and nutritional roles. Application diversification reduces supplier dependence on any single food category while creating opportunities for specialized thickening systems that command premium pricing through superior performance in specific use cases.


By Type: Hydrocolloids Lead Despite Protein Surge
Hydrocolloids maintain market leadership with 46.22% share in 2025, leveraging decades of application development and regulatory approval across global jurisdictions. However, protein-based thickeners demonstrate the highest growth velocity at 7.01% CAGR, indicating fundamental market evolution toward multifunctional ingredients that provide both thickening and nutritional benefits. The protein segment's growth reflects consumer demand for ingredients that contribute to daily protein intake while delivering functional performance, particularly relevant in sports nutrition and elderly care applications where texture modification addresses swallowing difficulties.
Starch-based thickeners occupy the middle ground between hydrocolloids and proteins, offering cost advantages in bulk applications while lacking the premium positioning of either category. The "Others" category includes emerging alternatives like bacterial nanocellulose and extremophilic exopolysaccharides that demonstrate superior performance characteristics but require additional regulatory approval and consumer acceptance. Hydrocolloid suppliers face supply chain challenges, particularly for locust bean gum where agricultural limitations drive price volatility, creating opportunities for protein and microbial alternatives to gain market share through consistent availability and pricing.
By Source: Plant Dominance Challenged by Microbial Innovation
Plant-based sources control 65.75% market share in 2025, reflecting established supply chains and consumer familiarity with ingredients like guar gum, locust bean gum, and pectin derived from traditional agricultural sources. The plant-based leadership position aligns with clean label trends and sustainability concerns, as consumers associate plant-derived ingredients with environmental responsibility and health benefits. However, microbial-based alternatives surge at 8.21% CAGR, driven by precision fermentation advances that enable consistent quality and supply reliability independent of agricultural variables.
Animal-based sources face declining market acceptance due to dietary restrictions, sustainability concerns, and regulatory complexity around halal and kosher certification requirements. The "Others" category includes synthetic alternatives and novel sources like algae-derived thickeners that offer unique functional properties but require market education and regulatory approval. Microbial production offers advantages in quality consistency, contamination control, and production scalability that traditional plant-based sources cannot match, particularly for high-value applications requiring pharmaceutical-grade purity. Supply chain disruptions affecting plant-based sources, including climate-related crop failures and geopolitical trade restrictions, create market opportunities for microbial alternatives that can maintain consistent supply through controlled fermentation processes.
By Category: Natural Dominance Drives Innovation
Natural thickeners command 68.74% market share in 2025 while simultaneously achieving the fastest growth at 6.72% CAGR through 2031, reflecting consumer preference alignment with regulatory trends favoring recognizable ingredients. The dual leadership position indicates market maturation where consumer education has successfully differentiated natural from synthetic alternatives based on perceived health benefits rather than functional performance. Synthetic thickeners maintain technical advantages in specific applications requiring extreme temperature stability or precise viscosity control, particularly in industrial food processing where cost efficiency outweighs consumer perception concerns. The European starch industry's production of 10.5 million tonnes annually, with 53% used in food applications, demonstrates the scale advantage that natural thickeners maintain over synthetic alternatives in established markets.
Precision fermentation technology enables natural thickener production at scales previously achievable only through synthetic routes, eliminating the cost penalty traditionally associated with natural positioning. The convergence of consumer preference, regulatory support, and production technology creates sustainable competitive advantages for natural thickener suppliers who can achieve synthetic-level consistency and cost structure. Synthetic alternatives face increasing regulatory scrutiny and consumer resistance, limiting their growth potential to niche applications where natural alternatives cannot achieve required performance specifications.
Geography Analysis
North America accounted for 38.02% of global revenue in 2025. FDA clarity under 21 CFR Part 170 accelerates GRAS ingredient launches, giving incumbents predictable pathways while limiting low-cost imports fda.gov. The region's robust regulatory framework promotes innovation while maintaining strict quality standards, ensuring product safety and consumer trust. Ingredion's 2023 results showed specialty texturizers delivering 34% of USD 8.2 billion net sales, highlighting scale advantages. Clean-label demand keeps natural starches and citrus fibers in the spotlight, anchoring the region's leadership in the food thickener market. The increasing consumer preference for clean-label products has prompted manufacturers to invest heavily in natural ingredient research and development.
Asia-Pacific is projected to grow at an 8.45% CAGR. China's GB 2760 update, recognizing 215 new additives, aligns local standards with Codex references, lowering barriers for global suppliers according to CIRS Group. The harmonization of regulations has created a more accessible market for international manufacturers, fostering increased competition and innovation. Investments in precision fermentation infrastructure in Singapore and rising disposable income in Southeast Asia multiply opportunities. Localization of supply chains mitigates import dependence, sustaining rapid expansion across beverage and ready-meal categories within the food thickener market. The region's growing middle class and increasing urbanization continue to drive demand for processed and convenience foods.
Europe remains a mature but sizable contributor. Strict safety assessments under Regulation 1333/2008 uphold consumer confidence, though compliance costs favor large enterprises. The region's commitment to food safety has established it as a benchmark for global quality standards in food additives. Public avoidance of E-numbers motivates reformulation toward pantry-friendly labels, rewarding pectin and starch suppliers with transparent sourcing. The continent's starch sector manufactures 10.5 million tonnes per year, half for food use, ensuring stable supply to the regional food thickener market according to the European Starch Industry. The strong focus on sustainability and traceability in European food production continues to shape product development and sourcing strategies.
Note: Segment shares of all Individual segments will be available upon report purchase

Regulatory Landscape
Global food thickener compliance is anchored in national additive frameworks that increasingly reference Codex Alimentarius. The Codex General Standard for Food Additives (GSFA, CXS 192-1995) remains the key international benchmark for permitted uses and maximum levels. In 2025, the Codex Alimentarius Commission updated additive provisions within the GSFA, reinforcing the need to monitor GSFA changes when serving multiple geographies.
In the European Union, Regulation (EC) No 1333/2008 continues to govern food additives, with EFSA supporting the authorization and re-evaluation system for additives and use conditions. A major 2026 compliance milestone is Commission Regulation (EU) 2026/196 (published 28 January 2026), which updates specifications for widely used thickeners such as locust bean gum (E 410), guar gum (E 412), gum arabic (E 414), xanthan gum (E 415), pectins (E 440), and starch sodium octenyl succinate (E 1450), applying from 18 August 2026. In India, the Food Safety and Standards Authority of India (FSSAI) moved prior-approval workflows to a single digital channel, requiring that applications be submitted via the ePAAS portal from 1 June 2026, which changes submission planning and documentation management for ingredient launches and line extensions.
Value Chain Analysis
The food thickener value chain starts with agricultural and microbial feedstocks (corn, cassava/tapioca, citrus peels for pectin, guar and carob/locust bean, and fermentation substrates for xanthan and gellan), followed by extraction or fermentation, purification and drying, and blending into application-specific systems. Distribution then runs through direct-to-manufacturer contracts and ingredient system houses. Large suppliers differentiate through formulation support and regulatory documentation, including specifications, allergen controls, and region-specific additive compliance under frameworks such as EU Regulation 1333/2008 and Codex GSFA alignment. Downstream food manufacturers incorporate thickeners into bakery, beverages, sauces, snacks, and dairy/frozen desserts, where performance across heat, shear, pH, and freeze-thaw is a key requirement.
Supply-side risks underscore dependencies in both natural-gum origins and upstream industrial inputs that feed into broader food additive manufacturing. In early 2026, disruption tied to the Sudan conflict tightened availability of gum acacia (E414), prompting buyers to diversify sourcing toward other African origins (such as Chad, Senegal, and Kenya) and to re-qualify suppliers for traceability and continuity. In parallel, geopolitical shocks around the Strait of Hormuz in 2026 exposed vulnerabilities in upstream chemical and energy supply chains (for example, methanol and sulfur availability), which can spill into ingredient processing costs, lead times, and procurement strategies even when the thickener is bio-based. This, in turn, increases the value of multi-origin sourcing, inventory buffers, and regional manufacturing footprints.
Competitive Landscape
The food thickener market exhibits moderate fragmentation with a competitive intensity of 4, creating opportunities for both multinational corporations and specialized innovators. Tate & Lyle's USD 1.8 billion acquisition of CP Kelco in 2024 combines pectin expertise with global reach, with cost synergies expected by 2026. Ingredion leverages Idea Labs to co-create customer recipes, deepening formulation partnerships. The market structure encourages continuous product development and customization capabilities. The emergence of regional players has intensified competition, leading to increased investment in research and development.
Biotechnology companies are establishing strong positions in high-purity xanthan, gellan, and bacterial cellulose niches. Jungbunzlauer's USD 200 million Canadian xanthan plant underscores green manufacturing commitments while shortening North American lead times. Competitive levers cluster around traceable supply, allergen control, and application-specific blends rather than headline price. The integration of sustainable practices has become increasingly important for market participants. The demand for clean-label and naturally-derived thickeners continues to influence manufacturing strategies.
Regulatory expertise remains a key competitive advantage in the market. GRAS notices and EFSA dossiers protect novel systems, allowing premium pricing until generic production scales. Collaboration between hydrocolloid firms and fermentation start-ups accelerates product pipelines, enlarging the collective food thickener industry footprint. The complexity of international food safety regulations creates significant barriers to entry. The investment in regulatory compliance capabilities has become a crucial factor in maintaining market position.
Food Thickener Industry Leaders
-
Cargill, Incorporated
-
Ingredion Inc.
-
Archer Daniels Midland Co.
-
Kerry Group plc
-
Tate and Lyle plc
- *Disclaimer: Major Players sorted in no particular order

Market Opportunities and Future Outlook
Clean-label reformulation and traceability demands are creating room for botanical-named and vertically integrated thickener supply, especially where agricultural volatility affects key hydrocolloids. A clear 2026 anchor is Nexira's acquisition of Moroccan carob specialist Keragum (July 2026), which strengthens control over locust bean gum supply, quality, and documentation, and reflects a broader supplier push to move upstream to secure critical raw materials and reduce exposure to single-origin disruptions.
Fermentation-derived and upcycled functional ingredients also open practical opportunities, backed by manufacturing investments and evolving regulatory workflows. In the United States, the FDA Human Foods Program 2026 priority deliverables include a proposed rule on mandatory submission of notices for substances claimed to be GRAS, which raises the importance of substantiation packages and transparent safety dossiers for new thickener-adjacent innovations. Industry actions in 2026, including Manus announcing commercial-scale fermentation production at its Augusta, Georgia facility (June 2026) and LBB Specialties partnering with Ruby Bio to commercialize fermentation-derived emulsifiers (July 2026), point to active scaling of fermentation platforms that can be extended toward texture and stability solutions, where supply consistency and label positioning are central buying criteria.
Recent Industry Developments
- April 2026: Manus announced commercial-scale fermentation production at its Augusta, Georgia facility, enabling fermentation-derived hydrocolloid ingredients for texture and stability applications. The initiative expands Manus' product capabilities and strengthens supply readiness for hydrocolloid based formulations.
- January 2025: Solina acquired Advanced Food Systems Inc. to strengthen its presence in the United States for customized ingredient systems that use stabilizers, emulsifiers, gums, and hydrocolloids. The deal broadens Solina's formulation and customer-facing application capabilities in a market where thickeners are often integrated into system solutions.
- September 2024: Jungbunzlauer announced a USD 200 million investment in Port Colborne, Ontario, to build Canada's first xanthan gum production facility. The project expands North American xanthan capacity and supports supply security for a core hydrocolloid used across sauces, dressings, and beverage stabilization.


Research Methodology Framework and Report Scope
Market Definition and Coverage
For this study, the food thickener market is defined as the value of thickening ingredients sold for use in food and beverage formulations to increase viscosity and improve texture, including starches, hydrocolloids, and protein-based thickeners.
Scope exclusions: Excluded from this sizing are feed thickeners, pharmaceutical or personal-care grades, and ready-to-eat thickened foods.
Segmentation Overview
-
By Category
- Natural
- Synthetic
-
By Type
-
Hydrocolloids
- Gelatin
- Xanthan Gum
- Agar
- Pectin
- Others
- Protein
- Starch
- Others
-
Hydrocolloids
-
By Source
- Plant-based
- Animal-based
- Microbial-based
- Others
-
By Application
- Bakery and Confectionery
- Sauces, Dressings, and Marinades
- Snacks and Savory
- Beverages
- Dairy and Frozen Desserts
- Others
-
By Geography
-
North America
- United States
- Canada
- Mexico
- Rest of North America
-
Europe
- Germany
- United Kingdom
- Italy
- France
- Spain
- Poland
- Rest of Europe
-
Asia-Pacific
- China
- India
- Japan
- Australia
- Rest of Asia-Pacific
-
South America
- Brazil
- Argentina
- Rest of South America
-
Middle East and Africa
- South Africa
- Saudi Arabia
- United Arab Emirates
- Rest of Middle East and Africa
-
North America
Data Sources, Market Sizing, and Validation
Desk Research
Desk research was used to set the market boundary and build the first set of assumptions on demand drivers and supply availability. We relied on public references such as food additive standards and approvals, trade association materials, national customs statistics for key gums and starches, and government agriculture and food processing statistics to understand raw material availability and use.
To keep the model practical, secondary inputs were also taken from company annual reports and investor presentations, technical literature on hydrocolloid and starch functionality, and reputable press coverage on pricing and capacity additions. Where needed, a paid subscription covering company financials and another covering patent activity were used to cross-check supplier footprints and innovation intensity, without depending on any single dataset. This list is not exhaustive, and many other public and subscription sources were reviewed for data collection, validation, and clarification.
Primary Interviews and Surveys
Primary discussions were run with a mix of ingredient suppliers, food manufacturers, distributors, and subject experts who track formulation trends across major application areas like sauces, bakery, dairy, and beverages. We used these conversations to pressure-test usage rates, typical dosage ranges, substitution between starches and hydrocolloids, and how pricing resets are being negotiated across regions. For a global view, inputs were balanced across APAC, EMEA, and the Americas so assumptions could be adjusted for local product mix and cost differences.
Distribution of primary research fieldwork respondents
| Company type | Respondent position | Region |
|---|---|---|
| Top tier: 26% | CXOs: 18% | APAC: 48% |
| Mid tier: 53% | Functional/Unit leaders: 35% | EMEA: 34% |
| Smaller Players: 21% | Managers: 47% | Americas: 18% |
Market-Sizing & Forecasting
Sizing was built using a top-down and bottom-up approach. On the top-down side, we reconstructed the demand pool by linking processed food output and mix to thickener intensity, then translating that into value using validated price bands for starches, hydrocolloids, and protein thickeners.
The model was then checked with selective bottom-up approximations, where supplier revenue splits, channel checks, and sampled price per kg multiplied by estimated consumption volumes were used to correct any over-counting. When a country-level split was not directly available, the gap was handled through proxy indicators such as packaged food sales mix, import dependence for key gums, and local production presence.
Forecasting was carried out using scenario analysis supported by multivariate regression on a small set of drivers that can be tracked consistently. The variables used (illustrative) included processed food volume growth, share shift toward clean-label stabilizers, relative pricing movement of key raw materials, import and export momentum for specialty gums, and application growth in sauces, bakery, and dairy, which then rolls up into the total.
Data Validation & Update Cycle
Outputs were validated through consistency checks across independent signals, followed by a second-pass review to confirm that country totals roll up cleanly to regional and global values. We also checked for unusual jumps in pricing or demand by comparing the modeled results with trade flows, raw material availability signals, and feedback from interviewees.
When a variance looked material, assumptions were revisited and respondents were re-contacted to confirm whether the change was structural or temporary. Reports are refreshed annually, with interim updates when major events affect pricing, supply, or demand. Before publication, an analyst runs a fresh pass so clients receive the latest updated view.
Mordor Intelligence's Food Thickener Market Size Compared Against Other Published Estimates
Published market sizes for food thickeners can look different because studies often draw the line around what counts as a thickener, which applications are included, and what year and pricing basis is used. Differences also show up when one estimate is built from food output signals, while another leans more on supplier revenue splits or a narrower product basket.
The benchmark table shows a noticeable spread across current-year values, and in Mordor Intelligence's model the number is tied to ingredient sales of starches, hydrocolloids, and protein-based thickeners used in food formulations, with feed, pharma or personal-care grades, and ready-to-eat thickened foods kept outside scope. That scope choice can shift totals versus approaches that bundle adjacent texturizers or count non-food end uses, and it also interacts with how price progression is applied across regions and contracts.
Benchmark comparison
| Source | Market Size | Gaps in Research Methodology |
|---|---|---|
| Mordor Intelligence | USD 19.92 B (2026) | |
| Global Consultancy A | USD 18.98 B (2025) | Uses a different base year and pricing basis, and the type and application basket may be defined more broadly or narrowly, which can move totals even before forecasting assumptions are applied. |
| Industry Publisher B | USD 16.06 B (2025) | The definition is presented as "thickening agents" with limited visibility on exclusions, and the forecast path appears to assume a faster expansion rate, which can imply different adoption and price uplift logic than a formulation-led demand pool build. |
Taken together, the table suggests that year selection, what is counted as a food-only ingredient sale, and the way prices and adoption are progressed over time are the main drivers behind the range. By keeping inputs traceable to food production and application intensity checks, and then confirming with targeted supplier and buyer feedback, the final total stays repeatable and easier to audit when assumptions change.


Key Questions Answered in the Report
What is the current value of the food thickener market?
The food thickener market stands at USD 19.92 billion in 2026 and is projected to grow to USD 26.71 billion by 2031.
Which region holds the largest share of food thickener sales?
North America leads with 38.02% of global revenue due to clear FDA regulations and high processed-food consumption.
Which segment is expanding fastest within the food thickener industry?
Microbial-derived thickeners are growing at an 8.21% CAGR thanks to precision fermentation improving cost and consistency.
How do clean-label trends influence thickener selection?
Brands increasingly opt for botanical or fermentation-derived names consumers recognize, boosting demand for pectin, citrus fiber and tapioca starch.
What role does precision fermentation play in future supply?
Precision fermentation enables scalable production of animal-identical or rare hydrocolloids, reducing reliance on climate-sensitive crops and broadening functional options.
Page last updated on:


