
Market Overview
| Study Period | 2021 - 2031 |
|---|---|
| Forecast Data Period | 2026 - 2031 |
| Base Year Market Size (2025) | USD 45.26 Billion |
| Market Size (2026) | USD 47.2 Billion |
| Market Size (2031) | USD 58.19 Billion |
| Growth Rate (2026 - 2031) | 4.29 % |
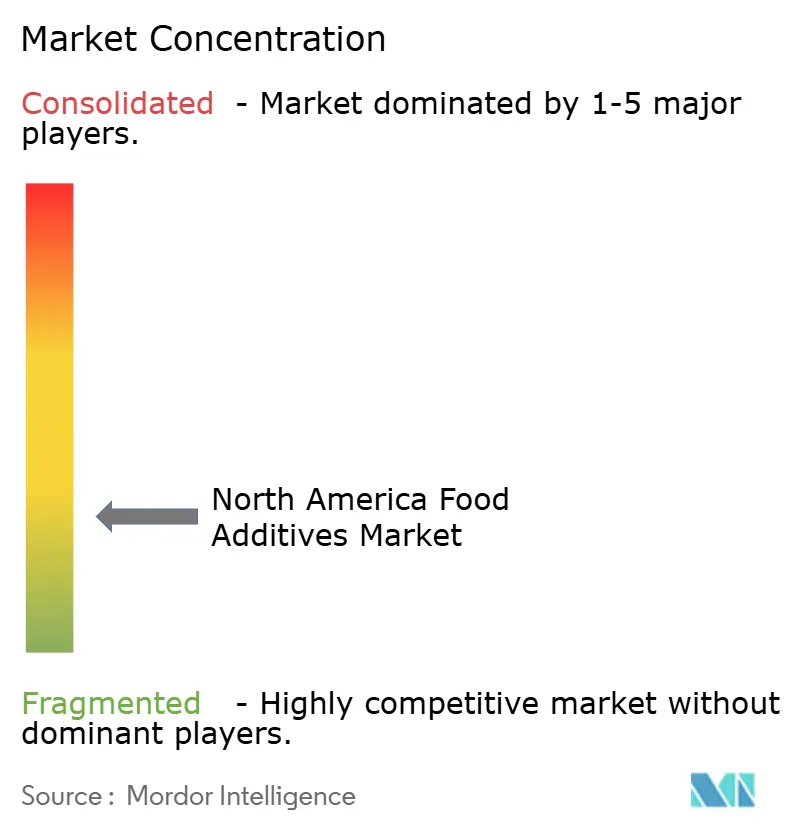
| Market Concentration | Low |
Major Players
*Disclaimer: Major Players sorted in no particular order Image © Mordor Intelligence. Reuse requires attribution under CC BY 4.0. |
|
North America Food Additives Market Analysis by Mordor Intelligence
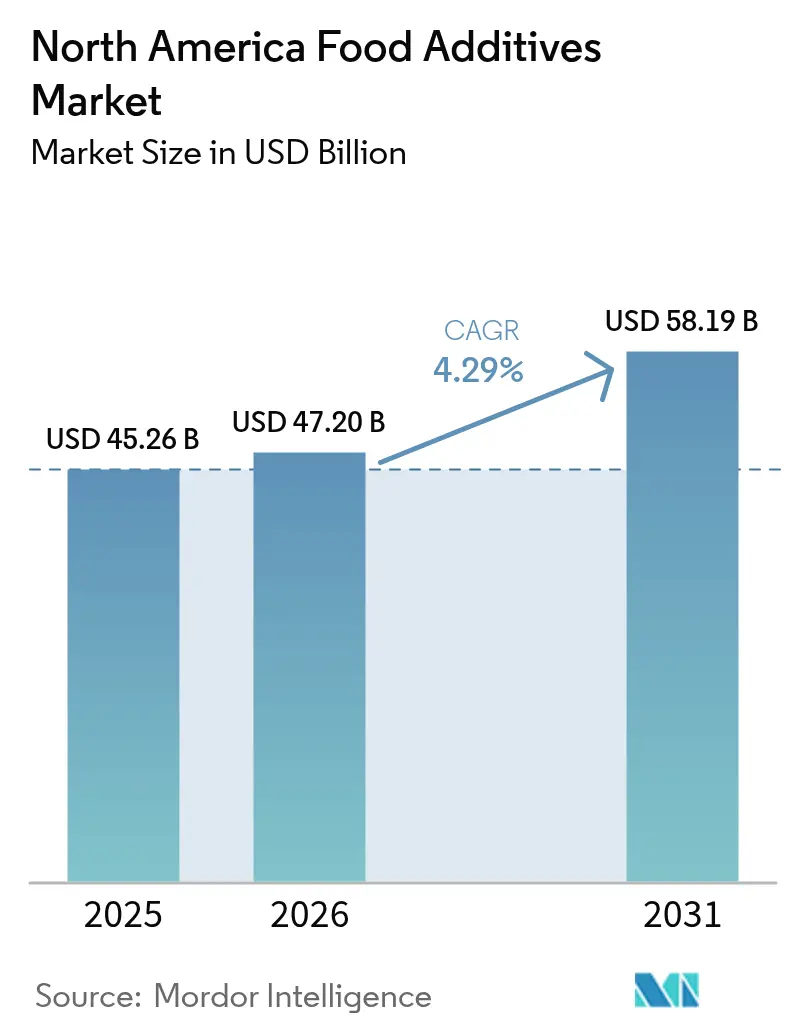
North America food additives market size in 2026 is estimated at USD 47.2 billion, growing from 2025 value of USD 45.26 billion with 2031 projections showing USD 58.19 billion, growing at 4.29% CAGR over 2026-2031. Robust demand comes from a mature food processing base that balances regulatory change with consumer wellness goals. Reformulation toward reduced sugar, natural colors, and clean-label preservation keeps functional additives at the center of product innovation. Manufacturers also prioritize texture systems that safeguard quality in omnichannel supply chains. Strategic public funding in Canada and state-level programs in the United States improve plant capacity and stimulate new ingredient solutions. Intensifying regulatory scrutiny favors suppliers with strong compliance capabilities, creating structural barriers that shelter incumbents while still welcoming specialized entrants.
Key Report Takeaways
- By product type, sweeteners led with 59.62% revenue share in 2025; colorants are forecast to expand at a 5.42% CAGR through 2031.
- By source, synthetic additives held 55.83% of the North America food additives market share in 2025, while natural alternatives are growing at a 5.78% CAGR through 2031.
- By application, bakery and confectionery accounted for 31.12% of the North America food additives market size in 2025, and beverages are advancing at a 5.46% CAGR through 2031.
- By geography, the United States captured a 53.21% share in 2025; Canada is projected to post the fastest 5.55% CAGR to 2031.
Note: Market size and forecast figures in this report are generated using Mordor Intelligence’s proprietary estimation framework, updated with the latest available data and insights as of 2026.
North America Food Additives Market Trends and Insights
Drivers Impact Analysis*
| Drivers | (~)% Impact on CAGR Forecasts | Geographic Relevance | Impact Timeline |
|---|---|---|---|
| Growing demand for processed and convenience foods | +1.2% | United States & Canada, with spillover to Mexico | Medium term (2-4 years) |
| Rising demand for natural, clean-label, and organic food additives | +1.8% | North America-wide, strongest in urban centers | Long term (≥ 4 years) |
| Government initiatives supporting food processing industry growth | +0.7% | Canada-focused, with US state-level programs | Short term (≤ 2 years) |
| Technological advancements in additive formulation | +0.9% | Global, with North America as innovation hub | Medium term (2-4 years) |
| Growing popularity of functional foods and fortified products | +1.1% | United States & Canada, premium market segments | Long term (≥ 4 years) |
| Rising export opportunities | +0.6% | Canada-led, leveraging natural ingredient positioning | Medium term (2-4 years) |
| Source: Mordor Intelligence | |||
Growing Demand for Processed and Convenience Foods
With the acceleration of consumer lifestyles, the demand for shelf-stable, ready-to-consume products is on the rise. These products increasingly depend on advanced additive systems to ensure quality and safety. The segment's growth is driven by demographic changes, particularly the increase in dual-income households and urbanization trends. These changes highlight the need for convenience while maintaining nutritional standards. Food manufacturers are addressing this demand by utilizing advanced systems, including preservative systems, texture modifiers, and flavor enhancers. These innovations extend shelf life and preserve sensory appeal, even under varying temperature and storage conditions. USDA [1] U.S. Department of Agriculture, “USDA's Food Price Outlook, 2025,” USDA, usda.govprojections indicate that spending on food away from home will grow by 3.6% in 2025, significantly outpacing the 1.3% growth expected for food at home. This trend highlights a growing institutional demand for processed ingredient solutions. Consequently, there is sustained demand for emulsifiers, stabilizers, and antimicrobial systems, which are essential for maintaining quality across extended supply chains in food service operations. Additionally, as convenience foods shift toward premium positioning, there is an increasing need for additive solutions that replicate restaurant-quality sensory experiences in packaged formats. This demand is driving innovation in flavor delivery systems and texture enhancement technologies.
Rising Demand for Natural, Clean-Label, and Organic Food Additives
Regulatory momentum and growing consumer skepticism toward synthetic additives are driving a shift toward plant-derived and fermentation-based alternatives across all functional categories. For example, the FDA's plan to eliminate petroleum-based synthetic dyes by 2026 has prompted manufacturers to secure natural colorant supplies, which often require 10 to 20 times higher inclusion rates compared to synthetic options. Additionally, state-level restrictions in California, West Virginia, and Illinois have introduced additive bans, compelling manufacturers to reformulate nationwide to avoid market fragmentation. The clean-label trend extends beyond colorants to preservatives, where rosemary extract systems and fermented vinegar solutions are replacing synthetic antioxidants, despite higher costs and increased formulation complexity. Supply chain constraints for natural alternatives have caused pricing volatility, with some botanical extracts experiencing price increases of 40-60% due to demand surpassing cultivation capacity. Companies focusing on vertical integration and sustainable sourcing partnerships are gaining a competitive edge through enhanced supply security and cost stability.
Government Initiatives Supporting Food Processing Industry Growth
By February 2025, Alberta's Agri-Processing Investment Tax Credit has approved USD 1.18 billion in projects spanning 16 corporations, reflecting the Canadian federal and provincial focus on advancing food processing. These efforts aim to enhance processing capabilities by utilizing advanced additive systems to achieve product differentiation and improve export competitiveness. The USD 725.5 million National School Food Program highlights institutional demand for additive solutions that comply with nutritional standards while appealing to child-friendly sensory preferences, as noted by the Federal Economic Development Agency for Southern Ontario[2]Government of Canada, "Healthy Meals for up to 400,000 more kids", www.canada.ca. "Healthy Meals for up to 400,000 more kids," the agency stated in a news release on June 20, 2024. Additionally, Protein Industries Canada has dedicated USD 29.02 million in technology leadership funding to drive innovations in ingredient manufacturing and food processing. This funding creates opportunities for additive companies specializing in plant-protein solutions and co-product valorization technologies. While US state-level programs support federal initiatives, they lack the coordinated impact of Canada's systematic approach. These government investments significantly reduce capital barriers for food processors, expediting the adoption of advanced additive technologies.
Technological Advancements in Additive Formulation
Nanotechnology applications are transforming additive delivery systems by utilizing microencapsulation techniques for targeted release, improved bioavailability, and enhanced stability in complex food matrices. Iron-loaded microcapsules made with whey protein isolate and gum arabic achieve a 17-fold higher retention rate compared to free iron after 21 days, providing 22% of the daily iron requirement for children per serving. Fermentation-derived colorants are emerging as scalable alternatives to extraction-based natural colors. Companies are creating β-carotene and betalain analogs that offer better stability and color intensity while reducing land-use needs. Advanced flavor masking technologies, such as dsm-firmenich's ModulaSense platform, are enabling higher inclusion rates of plant proteins by addressing off-note pathways before receptor interaction, broadening formulation options for protein-fortified products. Progress in enzyme technology is driving co-product valorization, with IFF's FOODPRO® portfolio improving protein extraction yields and reducing energy consumption through optimized processing conditions. These technological innovations provide companies investing in R&D and intellectual property development with opportunities for competitive differentiation.
Restraints Impact Analysis*
| Restraints | (~)% Impact on CAGR Forecasts | Geographic Relevance | Impact Timeline |
|---|---|---|---|
| Stringent and evolving regulations governing food additive usage and safety | -0.8% | North America-wide, with state-level variations | Short term (≤ 2 years) |
| Consumer skepticism and negative health perceptions regarding synthetic additives | -0.6% | United States & Canada, urban markets primarily | Medium term (2-4 years) |
| Volatility and fluctuation in raw material prices | -0.5% | Global impact with North American supply chains | Short term (≤ 2 years) |
| Supply chain disruptions impacting ingredient availability and pricing | -0.4% | North America-wide, concentrated supplier dependencies | Short term (≤ 2 years) |
| Source: Mordor Intelligence | |||
Stringent and Evolving Regulations Governing Food Additive Usage and Safety
Federal agencies are conducting systematic reviews of existing additives, while states are introducing independent restrictions, creating a fragmented market landscape. The FDA's proposal to remove self-affirmed GRAS pathways requires manufacturers to submit formal notifications supported by peer-reviewed safety data. This change could extend product development timelines by 12-18 months and increase regulatory costs by USD 200,000-500,000 per submission. At the same time, Health Canada is updating its food additive regulations. Although some processes are being streamlined, new specification requirements and compliance obligations are being introduced, requiring advanced technical expertise and robust documentation systems. State-level regulatory variations further complicate compliance. For example, California's Food Safety Act, West Virginia's school nutrition restrictions, and Illinois's additive bans necessitate unique formulation strategies for each market. These growing regulatory demands disproportionately affect smaller additive suppliers, who often lack dedicated regulatory affairs teams. Consequently, the market is experiencing consolidation, with companies that have established compliance infrastructures gaining an advantage.
Consumer Skepticism and Negative Health Perceptions Regarding Synthetic Additives
Public health advocacy and social media amplification of additive concerns create sustained pressure for reformulation away from synthetic ingredients, regardless of safety assessments by regulatory authorities. The ultra-processed food debate, elevated to federal policy discussions through HHS and FDA workshops, positions additives as markers of nutritional inferiority rather than functional necessities. Consumer willingness to pay premiums for clean-label alternatives creates market bifurcation, with premium brands investing in natural additive systems while value-oriented products maintain synthetic formulations to control costs. The perception challenge extends beyond individual additives to processing methods, with consumers viewing fermentation-derived ingredients more favorably than chemically synthesized equivalents despite identical molecular structures. Educational initiatives by industry associations struggle against simplified messaging that equates synthetic with harmful, creating sustained headwinds for conventional additive categories. This skepticism drives innovation investment toward natural alternatives but constrains pricing power for synthetic additives, compressing margins across traditional product lines.
*Our forecasts treat driver/restraint impacts as directional, not additive. The impact forecasts reflect baseline growth, mix effects, and variable interactions.
Segment Analysis
By Product Type: Sweeteners Lead While Colorants Accelerate
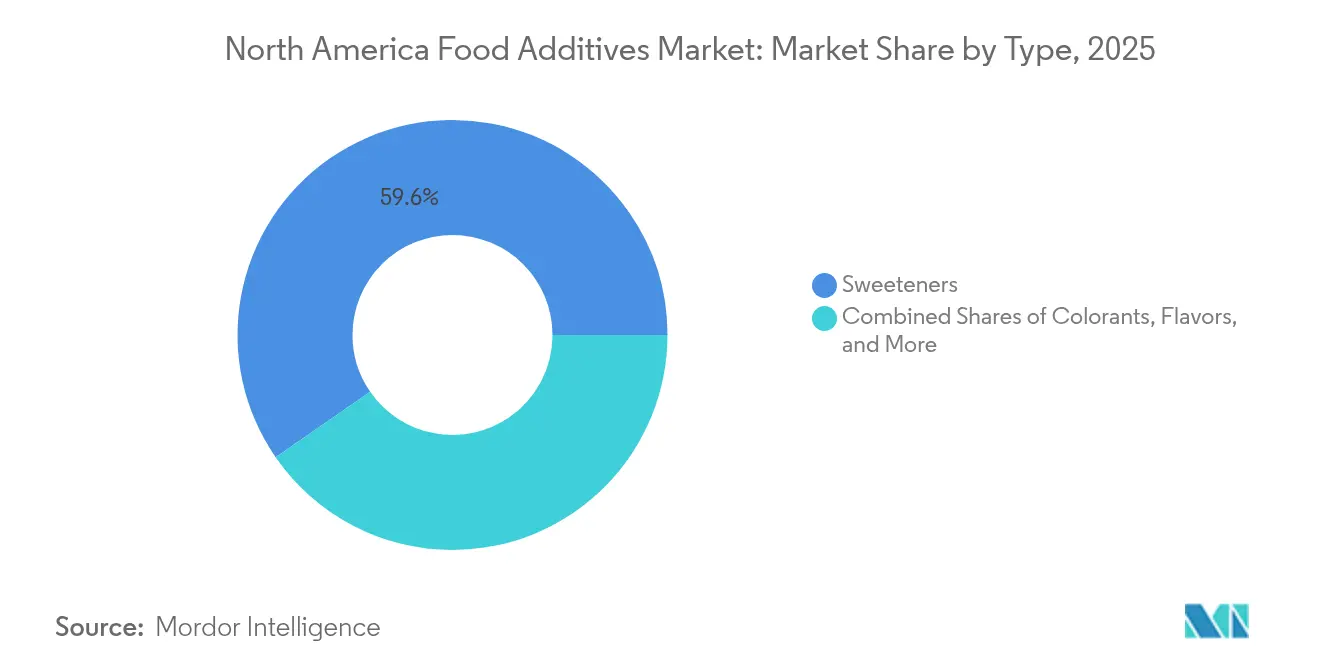
In 2025, sweeteners lead the market with a 59.62% share, highlighting North America's focus on reducing sugar in beverages, baked goods, and confections while maintaining taste quality. This segment's dominance is driven by regulatory mandates, increasing health awareness, and advancements in high-intensity sweeteners that replicate sugar's sensory profile at significantly lower inclusion rates. Meanwhile, colorants are the fastest-growing segment, with a projected 5.42% CAGR through 2031. This growth is attributed to the FDA's gradual elimination of petroleum-based synthetic dyes, which has created a surge in demand for natural alternatives that are more expensive and require higher inclusion rates.
Preservatives continue to see stable demand due to innovations in antimicrobial solutions and the shift toward clean-label formulations. Emulsifiers benefit from the growing popularity of plant-based products, which require advanced stabilization systems. Anti-caking agents maintain steady but modest growth in industrial applications. Enzymes are gaining traction by enhancing value through co-product utilization and processing optimization. Hydrocolloids experience strong demand for their role in texture modification, particularly in reduced-fat and plant-based formulations. Food flavors and enhancers are expanding their market presence, supported by advancements in masking technology that enable greater inclusion of functional ingredients. Lastly, acidulants maintain a stable market position by offering versatile functionality in preservation and flavor enhancement across various applications.



By Source: Natural Alternatives Gain Despite Synthetic Dominance
Synthetic additives retain 55.83% market share in 2025 through established supply chains, cost advantages, and proven performance characteristics that meet industrial-scale production requirements. However, natural additives accelerate at a 5.78% CAGR through 2031, driven by regulatory restrictions, consumer preferences, and technological advances that improve natural ingredient functionality and stability. The growth differential reflects structural market transformation as manufacturers invest in natural sourcing partnerships and reformulation capabilities despite higher costs and technical complexity.
Natural additive adoption varies significantly by functional category, with colorants leading the transition due to regulatory mandates, while preservatives and antioxidants follow through clean-label positioning strategies. Supply chain constraints for natural alternatives create pricing volatility and availability challenges, particularly for botanical extracts requiring specific growing conditions and seasonal harvesting. Companies developing fermentation-based natural additives gain competitive advantages through scalable production and consistent quality profiles that bridge the gap between natural positioning and industrial requirements. The synthetic-natural divide will likely persist, with premium brands adopting natural systems while value-oriented products maintain synthetic formulations for cost control.
By Application: Beverages Drive Growth Despite Bakery Leadership
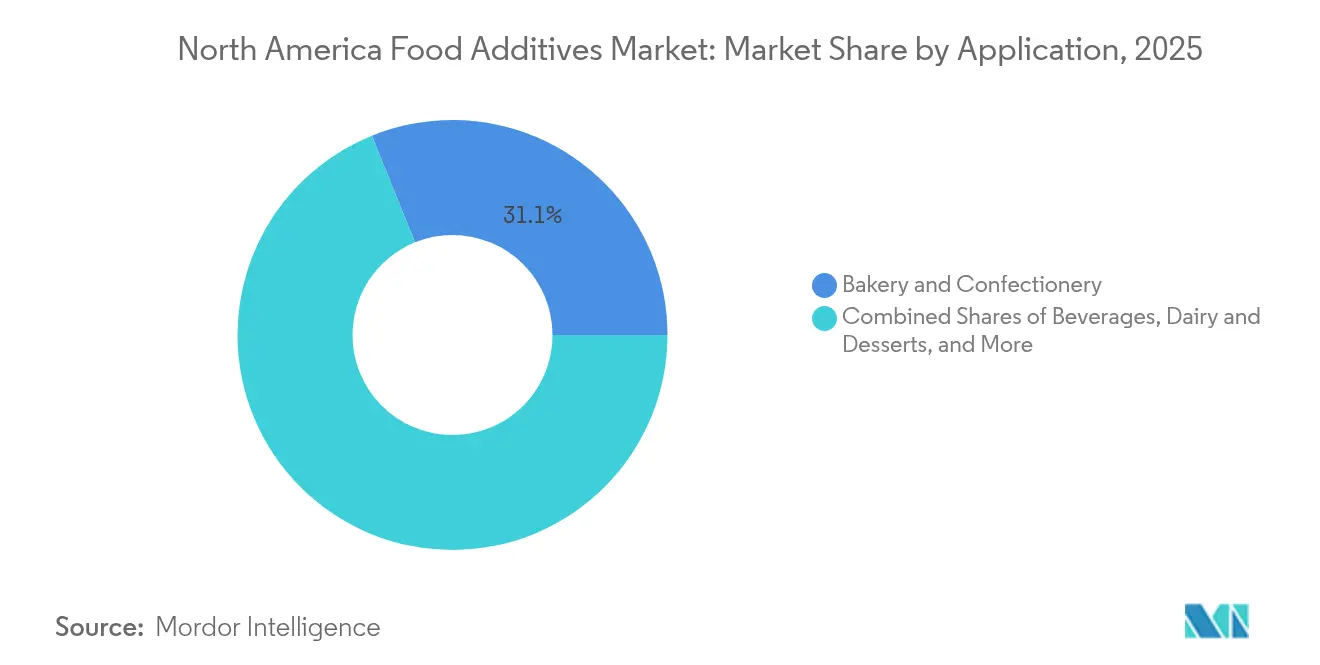
Bakery and confectionery applications dominate with 31.12% market share in 2025, leveraging North America's established snacking culture and the segment's requirement for diverse additive systems including emulsifiers, preservatives, flavors, and texture modifiers. The segment's stability reflects consistent consumption patterns and manufacturers' expertise in balancing functionality with sensory appeal across shelf-stable products. Beverages represent the fastest-growing application at 5.46% CAGR through 2031, driven by functional drink innovation, plant-based alternatives, and sophisticated flavor systems that mask off-notes while delivering health benefits.
Dairy and desserts maintain steady demand through premium positioning and clean-label reformulation, while meat and meat products benefit from natural preservation systems and plant-based analog development. Soups, sauces, and dressings leverage emulsification and flavor enhancement technologies, with growth tied to convenience food trends and restaurant-quality expectations in retail formats. The application shift toward beverages signals manufacturers' focus on higher-margin, health-positioned products that command premium pricing while requiring sophisticated additive solutions for stability, bioavailability, and sensory optimization across diverse pH and storage conditions.
Geography Analysis
The United States anchors the North American food additives market with a 53.21% share in 2025, leveraging its USD 1.8 trillion food system and sophisticated regulatory framework that enables rapid product innovation and market entry. The market's depth stems from established relationships between additive suppliers and food manufacturers, advanced R&D capabilities concentrated in major metropolitan areas, and distribution networks that efficiently serve diverse regional preferences. FDA's modernization initiatives, including the systematic phase-out of synthetic dyes and GRAS pathway reforms, create both challenges and opportunities for domestic suppliers while potentially raising barriers for international competitors lacking regulatory expertise. The US market's maturity enables premium positioning for innovative additive solutions, with companies like Innophos successfully launching clean-label alternatives such as VersaCal® Bright calcium phosphate as a titanium dioxide replacement.
Canada demonstrates the highest growth trajectory at 5.55% CAGR through 2031, supported by strategic government investments totaling over CAD 3 billion in food processing infrastructure and natural ingredient development programs. The country's positioning as a natural ingredient sourcing hub gains momentum through projects like Louis Dreyfus Company's pea protein isolate facility in Saskatchewan and Jungbunzlauer's xanthan gum manufacturing complex in Ontario, representing combined investments exceeding CAD 400 million. Health Canada's regulatory modernization streamlines additive approval processes while maintaining safety standards, creating competitive advantages for companies establishing Canadian operations. The country's trade relationships and USMCA benefits enable efficient export to US markets while avoiding potential trade tensions affecting other regions.
Mexico and Rest of North America contribute growing shares through manufacturing cost advantages and strategic positioning within USMCA trade frameworks that eliminate tariffs on qualifying food ingredients. Mexico's food processing sector benefits from proximity to US markets while maintaining lower labor costs, creating opportunities for additive manufacturing and processing operations serving regional demand. The USMCA agricultural quotas for Canadian products, including dairy and sugar-containing items totaling over 50 million kilograms annually, demonstrate the integrated nature of North American food supply chains that require consistent additive specifications across borders, according to the U.S. Customs and Border Protection. Regional harmonization efforts reduce regulatory complexity while enabling economies of scale for additive suppliers serving multiple markets within the trade bloc.
Regulatory Landscape
North America operates under three distinct oversight regimes for food additives, led by the US FDA, Health Canada, and Mexico's COFEPRIS, which pushes suppliers selling across the region toward multi-market compliance planning. In January 2026, the FDA Human Foods Program published its 2026 priority deliverables, pointing to a tighter posture around GRAS-related oversight and broader chemical safety activities, which increases documentation and regulatory affairs requirements for new substances and reformulated systems.
Canada continued moving to a more dynamic administrative model. In December 2024, Health Canada published SOR/2024-244, modernizing the Food and Drug Regulations by consolidating food additive provisions into Lists of Permitted Food Additives (incorporated by reference), with further administrative list updates in October 2025 to remove duplication and harmonize naming. Mexico also moved on colorants, with COFEPRIS publishing an official agreement in May 2026 that removes Erythrosine (FD&C Red 3) and its lakes from authorized additive lists tied to acceptable daily intake, reinforcing regionwide reformulation momentum for synthetic dyes.
Value Chain Analysis
The value chain runs from agricultural and petrochemical feedstocks (sugars, starches, oils, botanical extracts, and chemical intermediates) to additive manufacturing and formulation (including blends and delivery systems), then distribution through ingredient specialists and broadline distributors, and finally downstream use by food and beverage processors across bakery and confectionery, beverages, dairy, and prepared foods. Large multinational suppliers and toll manufacturers typically produce sweeteners, acids, emulsifiers, and preservatives at scale, while specialized players focus on natural colors, enzyme systems, and clean-label preservation solutions. Customers often qualify multiple sources to manage consistency, regulatory dossier needs, and sensory performance requirements.
Operational resilience remains tied to logistics and plant reliability. In May 2026, Ingredion reported a USD 40 million impact from production challenges at its Argo facility, underscoring how disruptions at major sweetener and starch assets can quickly affect customer inventories. Inbound planning is also shaped by ocean freight and tariff calendars, with Maersk citing peak-season import volumes of 2.25 million TEUs for North America and retailer frontloading ahead of the July 24, 2026 Section 122 tariff expiration, which supports forward buying, safety stocks, and alternate sourcing for additive precursors and packaging-linked inputs.
Competitive Landscape
The North American food additives market is defined by a fragmented competitive landscape, with a concentration index of 3 out of 10. This fragmentation creates opportunities for specialized suppliers to target niche segments by leveraging innovation, regulatory expertise, and strategic partnerships with food manufacturers. Leading companies such as Cargill, ADM, and IFF utilize vertical integration and global supply chains to achieve cost advantages while heavily investing in clean-label alternatives and natural ingredient platforms.
The fragmented nature of the market allows smaller players to compete effectively in specialized areas like natural colorants, enzyme systems, and plant-based protein solutions, where technical expertise and regulatory compliance provide competitive advantages. Strategic consolidation is gaining momentum as companies aim to develop comprehensive additive portfolios and capitalize on synergies across functional categories. Recent acquisitions, such as Glanbia's USD 300 million purchase of Flavor Producers and Mars' USD 35.9 billion acquisition of Kellanova, highlight the industry's focus on expanding capabilities and market reach.
Technology-driven differentiation is becoming increasingly critical, with companies investing in proprietary formulation tools like Tate & Lyle's Sensation™ platform for optimizing mouthfeel and advanced delivery systems that enhance functionality while reducing inclusion rates. Patented innovations, such as Kerry's Accel plant-based curing agent, provide temporary competitive advantages and drive continued R&D investment across the industry. FDA compliance requirements favor established players with dedicated regulatory affairs teams, creating barriers for new entrants who may lack the resources to navigate complex approval processes and maintain ongoing compliance.
North America Food Additives Industry Leaders
-
Cargill Incorporated
-
Archer Daniels Midland Company
-
Novozymes AS
-
Tate and Lyle Plc
-
DuPont Numerous Ltd.
- *Disclaimer: Major Players sorted in no particular order

Market Opportunities and Future Outlook
Reformulation tied to colorant and clean-label shifts is already translating into capacity and capability investments, which creates room for suppliers that can deliver stable natural color systems, taste-masking, and turnkey application support. ADM pointed to reformulation demand in January 2026 when it announced a USD 26 million investment in its Erlanger, Kentucky, flavor and color facility (following a USD 15 million investment in 2025), while Sensient began work in March 2026 on its St. Louis natural color expansion (Project Prism) as part of a broader U.S. manufacturing program, indicating active scaling of natural-color supply and technical services.
Opportunities also cluster around compliance-ready portfolios and faster regulatory execution as the FDA expands post-market chemical assessments and adjusts color additive permissions. In May 2026, the FDA initiated a formal post-market safety review of BHT and azodicarbonamide (ADA) under its enhanced assessment process, which raises the value of suppliers with strong toxicology data packages, traceability, and customer-facing risk management support. At the same time, capacity additions across flavors and functional ingredients, including Monin's July 2026 announcement of a USD 111 million flavoring production and distribution facility in Florida and Jungbunzlauer's Spring 2026 Phase 1 operational expansion at Port Colborne, Ontario (xanthan gum), reflect continued build-out of regional supply for beverage and texture systems, where performance, consistency, and lead-time reliability influence purchasing.
Recent Industry Developments
- July 2026: ADM and The EVERY Company announced a partnership to begin US-based commercial-scale production of OvoPro egg white protein at ADM's Clinton, Iowa, facility using precision fermentation. The move expands scalable access to animal-free protein functionality for formulations and supports broader innovation in functional foods and beverages that rely on advanced ingredient systems.
- May 2026: Cargill and Voyage Foods launched a commercial partnership to distribute NextCoa, a cocoa-free confectionery alternative, in North America. The collaboration targets confectionery reformulation needs and adds an alternative supply option that can help manage commodity volatility while supporting new product development in sweets and snacks.
- November 2024: Tate & Lyle completed its acquisition of CP Kelco from J.M. Huber Corporation, strengthening its specialty food and beverage solutions platform. The combination broadened access to texturants and system solutions, supporting customers seeking multifunctional stabilizers and clean-label texture optimization across processed food applications.


Research Methodology Framework and Report Scope
Market Definition and Coverage
For this report, the market covers the value of food additives sold for use in food and beverage manufacturing across North America, where additives are used to improve taste, texture, appearance, stability, and shelf life.
Scope exclusions: It excludes on-farm inputs and finished packaged food sales values, and it does not count food processing equipment or packaging materials as additives.
Segmentation Overview
-
By Product Type
- Preservatives
- Sweeteners
- Sugar Substitutes
- Emulsifiers
- Anti-Caking Agents
- Enzymes
- Hydrocolloids
- Food Flavors & Enhancers
- Food Colorants
- Acidulants
-
By Source
- Natural
- Synthetic
-
By Application
- Bakery and Confectionery
- Dairy and Desserts
- Beverages
- Meat and Meat Products
- Soups, Sauces, and Dressings
- Other Applications
-
By Geography
- United States
- Canada
- Mexico
- Rest of North America
Data Sources, Market Sizing, and Validation
Desk Research
Desk work started with building a clean demand map for additives across the United States, Canada, Mexico, and the rest of the region, then checking where volumes and pricing signals could be supported by public data. We leaned on official and open sources such as the US Food and Drug Administration for regulatory and permitted-use context, Statistics Canada and other US government economic statistics for processed food production signals, and UN Comtrade plus national customs releases for trade flows tied to key additive groups.
To keep the model realistic, we also reviewed company filings and investor presentations from ingredient suppliers and large food manufacturers, along with association websites and reputable press for capacity changes and reformulation trends (like clean-label moves and reduced sugar). Where needed, internal paid subscriptions were used only for company financials and patent lookups to validate commercialization direction, and for shipment-level trade checks when public trade categories were too broad. The sources listed above are illustrative, and many other references were also used for data collection, cross-checks, and clarification.
Primary Interviews and Surveys
Primary work focused on checking real selling patterns and mix shifts that are not visible in public datasets, especially for how additives are bundled and priced by application. We interviewed a mix of additive suppliers, distributors, contract manufacturers, and packaged food producers across North America, so assumptions on penetration, typical dosage ranges, and price movement could be verified and adjusted based on what they see in procurement and formulation cycles.
Distribution of primary research fieldwork respondents
| Company type | Respondent position |
|---|---|
| Top tier: 37% | CXOs: 12% |
| Mid tier: 47% | Functional/Unit leaders: 42% |
| Smaller Players: 16% | Managers: 46% |
Market-Sizing & Forecasting
The sizing model was built using a top-down structure, where processed food and beverage output by major category was converted into an additives demand pool using usage intensity and adoption rates, then translated into value using average selling price ranges. Once the regional total was shaped, it was corroborated through selective bottom-up approximations, such as rolling up revenues for a sampled set of suppliers, checking channel splits with distributors, and validating volume-to-value logic using trade-linked unit values where it made sense.
Key inputs that moved the model were the mix of processed and convenience food production, reformulation activity toward natural colors and clean-label preservatives, sweetener substitution trends, import dependence for specific additive groups, and observed price movement linked to raw material tightness and energy costs. When interviews surfaced gaps, such as limited disclosure on private company sales or mixed reporting across additive blends, we applied conservative gap-fill rules based on closest comparable product groups, then re-tested totals against the interview feedback.
For forecasting, we relied on scenario analysis, where macro drivers such as packaged food volumes and category mix were combined with additive-specific drivers like regulatory pressure, natural versus synthetic switching pace, and expected pricing progression. Final growth paths were only accepted after the forecast direction aligned with what industry participants described as realistic procurement and reformulation timelines.
Data Validation & Update Cycle
Outputs were checked in multiple ways so the final numbers stayed tied to real-world signals. We compared results against independent indicators, such as processed food output direction, trade movement for relevant chemical and ingredient categories, and supplier commentary on pricing and demand, then investigated any large variances before sign-off.
A second analyst review was used to re-check formulas, units, and currency handling, followed by a final sense-check on whether country shares and growth rates were consistent with the market story. Reports are refreshed annually, and interim updates are done when material events occur, such as regulatory changes, major capacity additions, or sharp input cost swings. Before delivery, a fresh update pass is completed so clients receive the most current view available.
Mordor Intelligence's North America Food Additives Market Sizing Compared With Other Published Estimates
Different publishers often end up with different market sizes in this space because they draw the boundary line in different places, and they also vary on what they treat as a food additive versus a broader ingredient. The base year chosen, the handling of currency conversions, and the way pricing is averaged across natural and synthetic mixes can also shift the final number by a meaningful margin.
By tracking application-level demand signals and refreshing price and mix assumptions through repeated checks with manufacturers and distributors, Mordor Intelligence counts additive value only when it is sold for use in food and beverage processing within North America, which keeps adjacent specialty ingredients and finished food values from being blended into the total.
Benchmark comparison
| Source | Market Size | Gaps in Research Methodology |
|---|---|---|
| Mordor Intelligence | USD 45.26 B (2025) | |
| Industry Publisher A | USD 15.24 B (2025) | This estimate appears to use a narrower value boundary that can undercount additive systems sold as part of broader ingredient solutions, and it may apply lower average pricing by weighting commodity-grade additives more heavily. |
| Industry Publisher B | USD 16.57 B (2024) | The number is for a different base year and seems built on a tighter additive list with a shorter forecast frame, which can exclude higher-value categories and reduces the impact of mix shifts toward natural colors and specialty functional additives. |
Overall, the spread mainly comes from scope boundaries and how pricing and product mix are treated, not from arithmetic differences. Our approach stays traceable because the demand pool is built from processed food output and validated usage logic, and then the value is checked against supplier and channel feedback before finalizing totals.


Key Questions Answered in the Report
How large is the North America food additives market in 2026?
The market is valued at USD 47.2 billion in 2026 and is forecast to reach USD 58.19 billion by 2031.
Which product type currently holds the highest share?
Sweeteners lead with 59.62% of sales thanks to sugar-reduction mandates and broad application in beverages and confectionery.
What is driving the fastest growth among applications?
Beverages post the quickest 5.46% CAGR as functional drinks and plant-based formulations demand advanced stability and flavor systems.
Which country offers the most attractive growth outlook?
Canada is projected to expand at a 5.55% CAGR through 2031 due to substantial government investment in processing capacity and natural ingredients.
Page last updated on:


 Your data is secure and never sold or shared.


