Flight Inspection Market Size and Share
Market Overview
| Study Period | 2019 - 2030 |
|---|---|
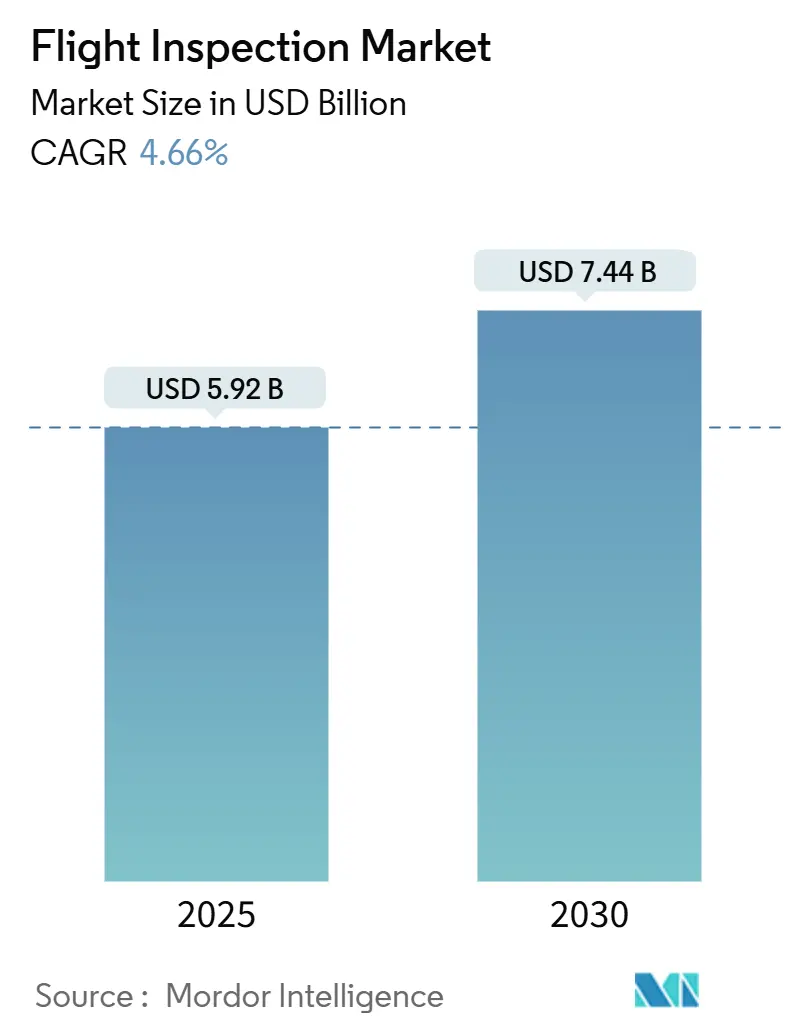
| Market Size (2025) | USD 5.92 Billion |
| Market Size (2030) | USD 7.44 Billion |
| Growth Rate (2025 - 2030) | 4.66% CAGR |
| Fastest Growing Market | Asia Pacific |
| Largest Market | North America |
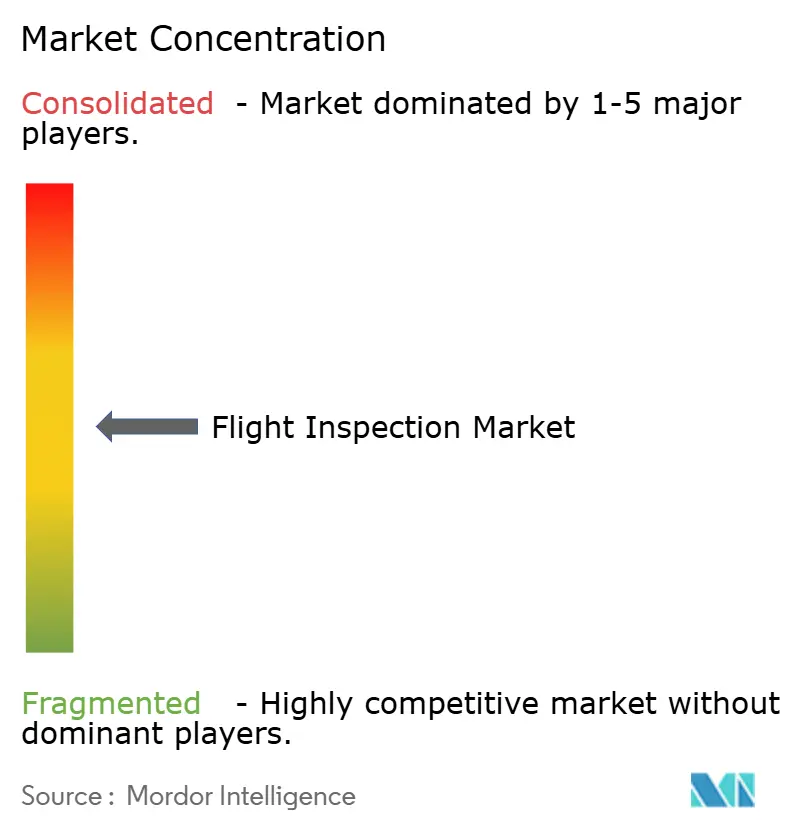
| Market Concentration | Medium |
Major Players *Disclaimer: Major Players sorted in no particular order Image © Mordor Intelligence. Reuse requires attribution under CC BY 4.0. | |
Flight Inspection Market Analysis by Mordor Intelligence
The flight inspection market reached USD 5.92 billion in 2025 and is projected to advance at a 4.66% CAGR to USD 7.44 billion by 2030, underscoring a resilient outlook built on mandatory safety compliance and continual modernization of communication, navigation, and surveillance infrastructure. Substantial investment in satellite-enabled communications, navigation, and surveillance/air traffic management (CNS/ATM) systems, growing performance-based navigation (PBN) deployments, and the gradual introduction of unmanned platforms are widening addressable demand across developed and emerging airspaces. Procurement cycles for replacement of aging flight-check fleets are accelerating, while Flight Inspection-as-a-Service (FIaaS) contracts appeal to authorities seeking leaner balance sheets. Concurrently, airport expansion programs in the Asia-Pacific and capacity optimization projects in Europe and the Middle East translate infrastructure growth directly into recurring inspection requirements. Digital data analytics layers are improving mission efficiency, giving first movers a clear competitive edge and reinforcing the commercial rationale for integrated software–hardware offerings within the flight inspection market.
Key Report Takeaways
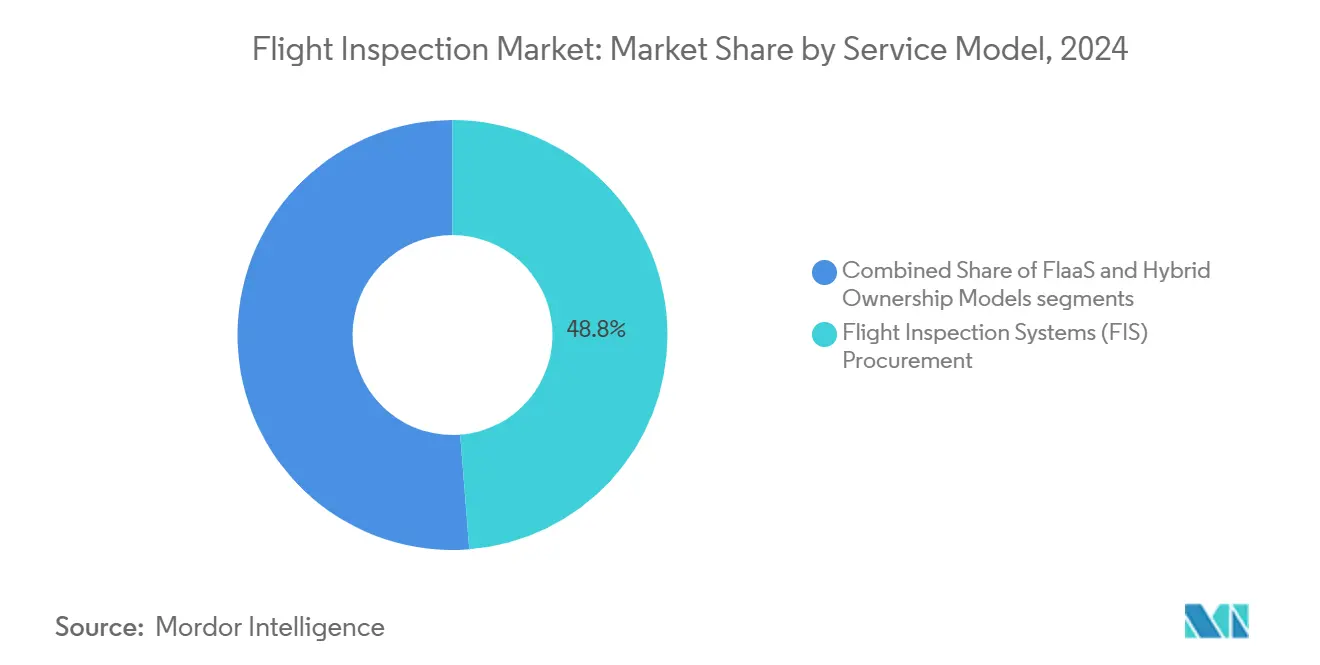
- By service model, procurement of flight inspection systems retained 48.75% of the market share in 2024, while FIaaS is expanding at a 6.21% CAGR through 2030.
- By platform type, fixed-wing aircraft led with 70.43% revenue share in 2024; the rotary-wing segment is forecasted to post the fastest 5.55% CAGR to 2030.
- By system architecture, on-board integrated systems accounted for 57.89% of the flight inspection market size in 2024, whereas portable roll-on/roll-off solutions are projected to grow at a 4.98% CAGR.
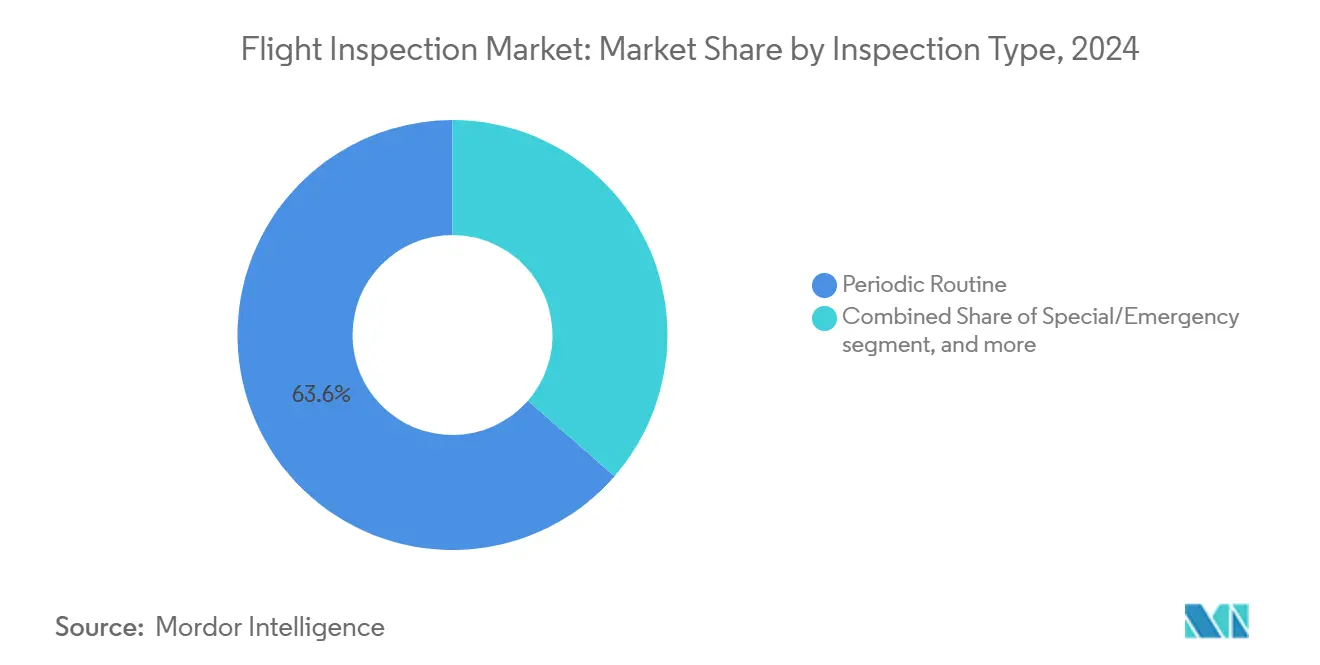
- By inspection type, periodic routine missions captured 63.59% of the flight inspection market share in 2024, and special/emergency missions are advancing at a 6.77% CAGR to 2030.
- By end-user, air navigation service providers (ANSPs) held a 43.78% share of the 2024 flight inspection market size, and private/business aviation represents the fastest-growing user base at a 5.87% CAGR.
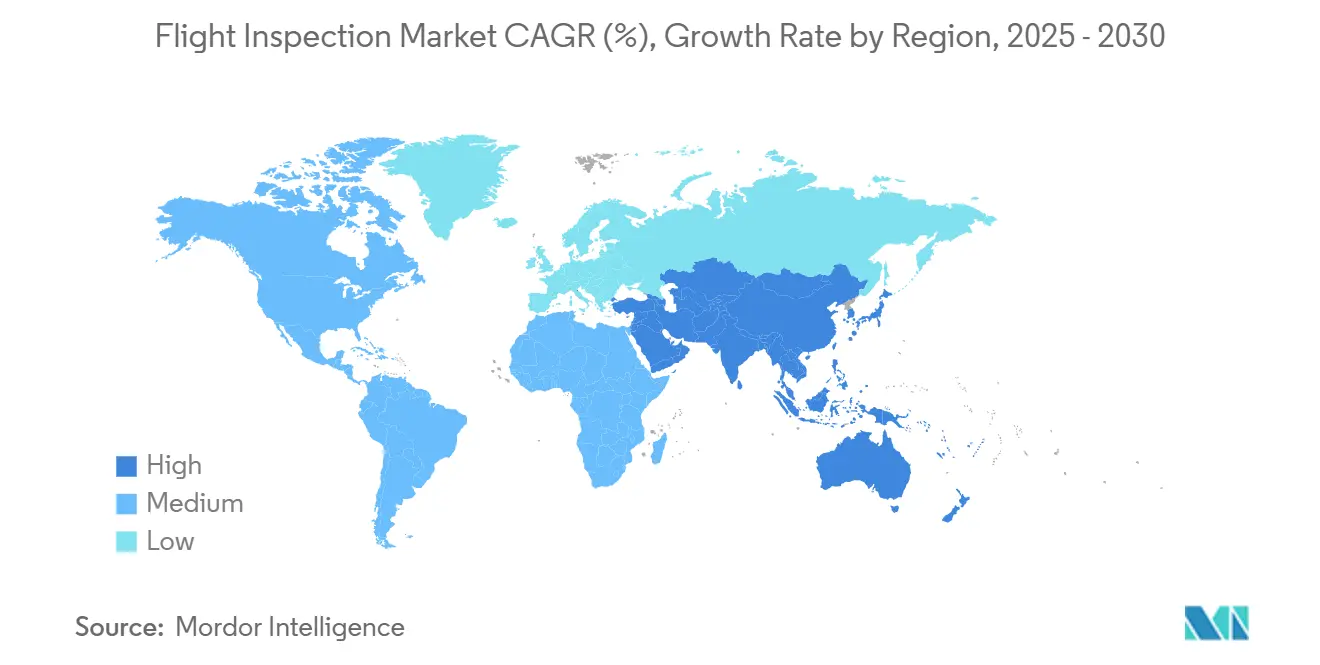
- By geography, North America commanded 29.89% of revenue in 2024, whereas the Asia-Pacific is registering the swiftest 5.98% CAGR during the forecast period.
Global Flight Inspection Market Trends and Insights
Drivers Impact Analysis*
| Driver | % Impact on CAGR Forecast | Geographic Relevance | Impact Timeline |
|---|---|---|---|
| Digitalization of CNS/ATM infrastructure | +1.20% | Global, with North America and Europe leading | Medium term (2-4 years) |
| Surge in Performance-Based Navigation (PBN) implementations | +0.90% | Global, concentrated in APAC and North America | Medium term (2-4 years) |
| Global runway-capacity optimization mandates | +0.70% | Global, particularly Asia-Pacific and Middle East | Long term (≥ 4 years) |
| Fleet renewal toward next-generation turboprop fixed-wing calibration aircraft | +0.60% | North America and Europe early adoption, APAC following | Long term (≥ 4 years) |
| Adoption of cloud-connected flight-inspection analytics | +0.40% | Global, technology-advanced markets first | Short term (≤ 2 years) |
| Space-based ADS-B verification demand | +0.30% | Global, remote and oceanic regions priority | Medium term (2-4 years) |
| Source: Mordor Intelligence | |||
Digitalization of CNS/ATM infrastructure
Aviation authorities are retiring legacy VOR and NDB beacons in favor of satellite-augmented navigation systems, which require more sophisticated in-flight validation than traditional ground-based aids. NAV CANADA’s modernization program and SESAR 3 European projects illustrate the depth of investment channeled into digital CNS assets.[1]NAV CANADA, “CNS/ATM Operations Plan,” navcanada.ca Each new RNAV or RNP procedure must be flight-checked before publication, turning digital transitions into reliable revenue streams for providers in the flight inspection market. The same trend underpins procurement of next-generation data-collection consoles capable of GNSS error-vector analysis, making integrated hardware–software packages a strategic necessity for suppliers.
Surge in performance-based navigation (PBN) implementations
The FAA’s NAS Navigation Strategy and ICAO’s Global Air Navigation Plan mandate higher PBN utilization, prompting continuous inspection of curved-path approaches and tighter tolerance RNP AR procedures.[2]Federal Aviation Administration, “PBN NAS Navigation Strategy,” faa.gov Airlines have equipped roughly 97% of mainline fleets with requisite avionics, driving airports to expedite PBN rollouts that each trigger a flight-check campaign. Complex approach designs elevate demand for multi-sensor data fusion capabilities on board inspection aircraft and push authorities to consider service contracts when internal fleets cannot scale to mission volume.
Runway-capacity optimization mandates
Major hubs with advanced approach and departure concepts to unlock latent runway capacity without large-scale concrete projects. Heathrow’s third-runway proposal and India’s extensive green-field airport pipeline demonstrate how procedure-based capacity gains rely on precise calibration of navigation and lighting systems. Validation flights for new or re-charted procedures constitute a recurring workload, especially when traffic growth forces more frequent re-optimization cycles. Consequently, the flight inspection market benefits from predictable mission schedules aligned with multi-year infrastructure timelines.
Adoption of Cloud-Connected Flight-Inspection Analytics
Integrating cloud-based analytics platforms into flight inspection operations represents a fundamental shift toward data-driven validation methodologies that enhance operational efficiency and reduce analysis time. Modern flight inspection systems generate massive datasets during navigation aid validation missions, requiring sophisticated processing capabilities to identify anomalies, trends, and performance degradation patterns that traditional onboard analysis cannot detect in real-time. Cloud-connected platforms enable flight inspection operators to leverage advanced algorithms, machine learning capabilities, and centralized expertise to process inspection data immediately upon collection, reducing the time between flight completion and validation report generation from days to hours.
The FAA's modernization initiatives emphasize data-driven decision making, with NextGen programs requiring comprehensive performance monitoring that cloud analytics can provide more efficiently than legacy ground-based processing systems. This technological evolution allows smaller aviation authorities to access sophisticated analysis capabilities without investing in expensive ground-based processing infrastructure, while enabling service providers to offer enhanced value propositions through predictive maintenance insights and trend analysis that extend beyond basic regulatory compliance requirements.
Restraints Impact Analysis*
| Restraint | % Impact on CAGR Forecast | Geographic Relevance | Impact Timeline |
|---|---|---|---|
| High acquisition and operating cost of specialised aircraft | -0.008 | Global, particularly affecting smaller ANSPs | Medium term (2-4 years) |
| Skilled-crew shortage for dual-pilot/dual-engine missions | -0.006 | North America and Europe primarily | Short term (≤ 2 years) |
| Spectrum-congestion interference in GNSS flight checks | -0.004 | Global, urban and high-density airspace regions | Medium term (2-4 years) |
| Limited operational endurance of rotary-wing aircraft on long-range inspection routes | -0.003 | Global, with North America and Europe leading adoption | Long term (≥ 4 years) |
| Source: Mordor Intelligence | |||
High acquisition and operating cost of specialized aircraft
The Cessna Citation Longitude delivered to Japan’s Civil Aviation Bureau with UNIFIS 3000-G2 equipment exemplifies fleet-modernization budgets that surpass USD 20 million per tail, a figure unattainable for many mid-size authorities. Annual operating budgets such as the FAA’s USD 60 million expenditure on a 32-aircraft fleet further highlight lifecycle cost burdens.[3]AOPA, “FAA Updating Flight Inspection Fleet,” aopa.org Capital constraints fuel demand for FIaaS outsourcing and cooperative ventures like Australia’s AeroPearl, enabling stakeholders to share fixed costs while complying with inspection cadences.
Spectrum-Congestion Interference in GNSS Flight Checks
Electromagnetic spectrum congestion in urban and high-density airspace environments increasingly compromises the accuracy and reliability of GNSS-based flight inspection procedures, creating significant operational challenges for navigation aid validation. Modern flight inspection missions rely heavily on satellite navigation systems to validate RNAV and RNP procedures. Still, urban environments with dense cellular networks, WiFi systems, and other RF emitters can interfere with GPS signal reception, leading to degraded positioning accuracy during critical validation phases.
The proliferation of 5G networks operating in adjacent frequency bands to GPS L1 signals has intensified these interference concerns, with aviation authorities reporting increased GNSS signal degradation during flight inspection operations near major metropolitan areas. This interference particularly impacts precision approach validation, where centimeter-level accuracy requirements for RNP procedures demand clean GNSS signals that urban electromagnetic environments cannot consistently provide. Flight inspection operators must increasingly employ backup validation methodologies, extend mission duration to account for signal quality variations, and invest in more sophisticated antenna systems and signal processing equipment to maintain validation accuracy standards, ultimately increasing operational costs and reducing inspection efficiency in critical high-traffic airspace regions.
*Our forecasts treat driver/restraint impacts as directional, not additive. The impact forecasts reflect baseline growth, mix effects, and variable interactions.
Segment Analysis
By Service Model: Capital-heavy fleets give way to flexible contracts
Flight inspection market size data show flight inspection systems procurement holding 48.75% revenue share in 2024, as large authorities continue to own and operate bespoke aircraft fleets. These fleets deliver mission availability and scheduling autonomy but lock operators into high depreciation and maintenance outlays. FIaaS has gained share through bundled offerings that include aircraft, crews, data analytics, and on-demand surge capacity, letting smaller regulators and private airports meet audit requirements without headline capital expense. Hybrid models—wherein authorities own one or two core aircraft while contracting overflow missions—are emerging as a logical midpoint.
The FIaaS value proposition is magnified by digital consoles that permit rapid re-configuration for different aids, reducing turnaround time between jobs. Vendors providing cloud-based post-processing platforms shorten report cycles from weeks to hours, improving regulator responsiveness. Competitive bids often hinge on mission pricing transparency and data-security assurances, which dominate recent procurement tenders across Asia-Pacific and South America. Collectively, these dynamics ensure FIaaS enjoys the highest growth trajectory inside the flight inspection market.


By Platform Type: Fixed-wing endurance versus rotary agility
Fixed-wing assets such as Beechcraft King Air 360ER and Bombardier Challenger variants enable multisite inspections within single flight plans, underpinning their 70.43% 2024 market share. Cruising speeds above 250 knots and six-hour endurance favor IFR route checks and high-altitude surveillance of en-route aids. Upgrades, including electric actuators and lighter flight-inspection pallets, extend useful life and raise payload margin for additional sensor suites.
Rotary-wing aircraft tally a smaller share yet are logging a 5.55% CAGR, driven by heliports, offshore platforms, and congested urban airports where hover capability is critical. Helicopters also facilitate infrastructure surveys of lighting arrays, PAPI alignments, and surface-movement radar antennas from proximity. OEMs answer this niche with dual-purpose platforms that switch between inspection and emergency-response roles, improving asset utilization. The divergent mission profiles ensure both platform types remain integral to the flight inspection market while shaping different procurement criteria.
By System Architecture: Integrated consoles dominate but portable kits surge
Integrated systems hold 57.89% of the flight inspection market share because they are permanently embedded in missionized cabins, optimizing weight distribution and vibration isolation for precision antennas. Full-featured consoles offer real-time RF analysis, multi-constellation GNSS comparison, and auto-flight guidance, enabling one-pass data validity.
Portable roll-on/roll-off units, advancing at 4.98% CAGR, appeal to operators with intermittent mission volume. They convert a standard turboprop or regional jet into a compliant inspection asset within hours, minimizing downtime and capital commitment. Advances in miniaturized RF front-ends and high-speed solid-state recorders have narrowed the performance gap with integrated rigs. Consequently, leasing companies and regional ANSPs view portable kits as an entry point into the flight inspection market without needing dedicated airframes.
By Inspection Type: Regulatory cadence meets disruption response
Routine periodic inspections commanded 63.59% of 2024 revenue, aligned with ICAO-defined cycles of 270- to 540-day intervals depending on the aid category. These schedules provide predictable demand and underpin long-term fleet-planning models for in-house and outsourced operators.
Special / emergency inspections exhibit the quickest expansion at 6.77% CAGR as operators seek rapid validation after outages, infrastructure modifications, or GNSS interference events. High-profile examples include 24-hour callouts to certify displaced thresholds during runway rehabilitation. The urgency places a premium on aircraft availability and crew readiness, rewarding service providers with standby capacity and multi-base networks. The interplay of scheduled and unscheduled work sustains utilization rates and stabilizes revenue flows inside the flight inspection market.
By End-User: ANSP primacy challenged by private aviation growth
ANSPs retained a 43.78% share of the flight inspection market size in 2024 because they bear statutory responsibility for nationwide aid integrity. Their fleets execute high-volume missions across en-route and terminal domains, often supplemented by regional subcontractors for peak periods.
Private/business aviation, though smaller, is expanding at 5.87% CAGR as corporate airports proliferate and demand tailored RNP approaches for time-sensitive operations. Certification of bespoke procedures at mountain resorts and remote industrial sites drives contract opportunities, particularly for agile FIaaS vendors. Airport operators and military authorities occupy intermediate positions, each with specific mission complexity and security prerequisites. Together, these segments diversify revenue sources and reinforce the structural resilience of the flight inspection market.
Geography Analysis
North America generated 29.89% of 2024 revenue, anchored by the FAA’s 32-aircraft fleet and USD 35 billion NextGen investment pipeline that will continue to feed flight-check demand through 2030.[4]US Government Accountability Office, “Air Traffic Control Modernization,” gao.gov Canada complements regional activity with space-based ADS-B rollouts that extend surveillance to remote Arctic FIRs, each requiring calibration flights over sparsely populated corridors. Mexico’s multi-airport capacity upgrades support moderate incremental demand, rounding out a mature, steadily funded regional market.
Asia-Pacific is the fastest-growing geography, registering a 5.98% CAGR as China’s 14th Five-Year Plan funds over 140 airport projects and India targets more than 220 new facilities by 2035. Authorities are also procuring dedicated King Air 360 platforms to match rising inspection loads, demonstrating that unit sales and service contracts move in tandem. Japan showcases technology leadership, flying Citation Longitude and CJ4 aircraft equipped with next-generation UNIFIS 3000-G2 consoles that set regional benchmarks for data quality.
Europe maintains stable growth under EASA oversight. SESAR harmonization efforts require cross-border procedure validation, incentivizing collaboration among Thales Flight Inspection Services, DFS, and ENAV. Hubs such as Heathrow are expanding runway systems, adding sustained flight-check slots tied to phased commissioning milestones.

Competitive Landscape
The flight inspection market features a moderate level of fragmentation, with roughly twenty internationally active providers but only a handful controlling global reach. Textron Aviation, Bombardier, and Embraer supply purpose-built or modified platforms and partner with system integrators like Aerodata AG and Norwegian Special Mission to deliver turnkey solutions. Thales leverages avionics heritage, positioning its service arm as a one-stop shop from GNSS receivers to post-mission analytics.
Service specialists such as AeroPearl and AeroData International Surveys carve niches by offering subscription-based FIaaS packages that bundle data management, regulatory reporting, and equipment lifecycle services.
Consolidation pressures are emerging as equipment upgrade cycles demand capital outlays that smaller regional operators struggle to finance. Partnerships, joint ventures, and selective M&A are expected, particularly in Europe and the Asia-Pacific, where cross-border harmonization favors larger fleets capable of multi-jurisdiction coverage. Data analytics differentiation and cyber-secure cloud reporting are fast becoming tie-breakers in procurement decisions, sharpening technological rivalry within the flight inspection market.
Flight Inspection Industry Leaders
Aerodata AG
Norwegian Special Mission AS
Safran
Textron Inc.
Bombardier Inc.
- *Disclaimer: Major Players sorted in no particular order

Recent Industry Developments
- June 2025: Thales Group and Qatar Airways agreed to create an IFE maintenance hub in Doha, signaling closer cooperation that could extend to regional flight-inspection support for the airline’s airport projects.
- May 2025: BAM clinched several contracts for flight inspection services spanning Denmark, Norway, and Sweden. Its flight inspection team is set to calibrate navigational aids and approach systems at airports throughout the Nordic region.
- January 2025: The Portuguese Air Force joined Embraer and the Brazilian Air Force in studies to integrate ISR mission kits into KC-390 aircraft, adding a flight-inspection-compatible sensor option.
- January 2025: Embraer SA and Turkish Aerospace signed a memorandum to explore E2 jet production in Türkiye, potentially expanding regional special-mission modification capacity.


Global Flight Inspection Market Report Scope
| Flight Inspection Systems (FIS) Procurement |
| Flight Inspection as-a-Service (FIaaS) |
| Hybrid Ownership Models |
| Fixed-Wing Aircraft |
| Rotary-Wing Aircraft |
| On-board Integrated Systems |
| Portable/Roll-On Roll-Off Systems |
| Ground-Based Reference Systems |
| Commissioning / Site Acceptance |
| Periodic Routine |
| Special/Emergency |
| Air Navigation Service Providers (ANSPs) |
| Airport Operators |
| Military Aviation Authorities |
| Private/Business Aviation |
| North America | United States | |
| Canada | ||
| Mexico | ||
| Europe | United Kingdom | |
| France | ||
| Germany | ||
| Russia | ||
| Rest of Europe | ||
| Asia-Pacific | China | |
| Japan | ||
| India | ||
| Australia | ||
| Rest of Asia-Pacific | ||
| South America | Brazil | |
| Rest of South America | ||
| Middle East and Africa | Middle East | United Arab Emirates |
| Saudi Arabia | ||
| Rest of Middle East | ||
| Africa | South Africa | |
| Rest of Africa | ||
| By Service Model | Flight Inspection Systems (FIS) Procurement | ||
| Flight Inspection as-a-Service (FIaaS) | |||
| Hybrid Ownership Models | |||
| By Platform Type | Fixed-Wing Aircraft | ||
| Rotary-Wing Aircraft | |||
| By System Architecture | On-board Integrated Systems | ||
| Portable/Roll-On Roll-Off Systems | |||
| Ground-Based Reference Systems | |||
| By Inspection Type | Commissioning / Site Acceptance | ||
| Periodic Routine | |||
| Special/Emergency | |||
| By End-User | Air Navigation Service Providers (ANSPs) | ||
| Airport Operators | |||
| Military Aviation Authorities | |||
| Private/Business Aviation | |||
| By Geography | North America | United States | |
| Canada | |||
| Mexico | |||
| Europe | United Kingdom | ||
| France | |||
| Germany | |||
| Russia | |||
| Rest of Europe | |||
| Asia-Pacific | China | ||
| Japan | |||
| India | |||
| Australia | |||
| Rest of Asia-Pacific | |||
| South America | Brazil | ||
| Rest of South America | |||
| Middle East and Africa | Middle East | United Arab Emirates | |
| Saudi Arabia | |||
| Rest of Middle East | |||
| Africa | South Africa | ||
| Rest of Africa | |||


Key Questions Answered in the Report
What is the current value of the flight inspection market?
The flight inspection market reached USD 5.92 billion in 2025 and is forecasted to hit USD 7.44 billion by 2030, reflecting a 4.66% CAGR.
Which region is growing fastest for flight inspection services?
Asia-Pacific leads growth with a projected 5.98% CAGR through 2030, propelled by large-scale airport construction and PBN adoption.
Why are authorities shifting toward FIaaS contracts?
FIaaS lets regulators meet inspection mandates without owning high-cost aircraft, reducing capital burdens while gaining on-demand capacity.
Which platform type dominates today’s missions?
Fixed-wing aircraft hold more than 70% of revenue due to superior endurance and range for en-route and multi-airport checks.
What key technology trend shapes future demand?
Digitalization of CNS/ATM systems, including satellite-based navigation and cloud analytics, is increasing mission complexity and inspection frequency.
How are fixed-wing aircraft evolving for flight-inspection missions?
Newer fixed-wing models such as the King Air 360ER and Citation Longitude offer lighter roll-on sensor pallets, upgraded avionics, and fuel-efficient engines that enable single-pass data capture and lower mission costs.
Page last updated on:


