Market Overview
| Study Period | 2020 - 2031 |
|---|---|
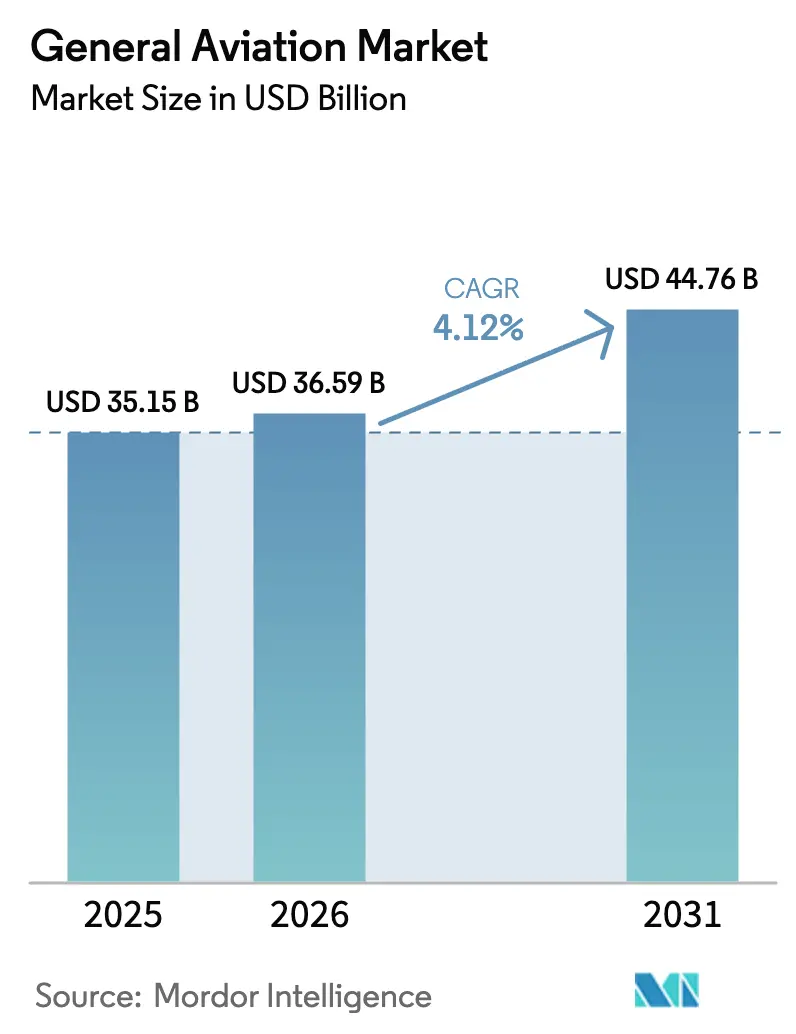
| Market Size (2026) | USD 36.59 Billion |
| Market Size (2031) | USD 44.76 Billion |
| Growth Rate (2026 - 2031) | 4.12% CAGR |
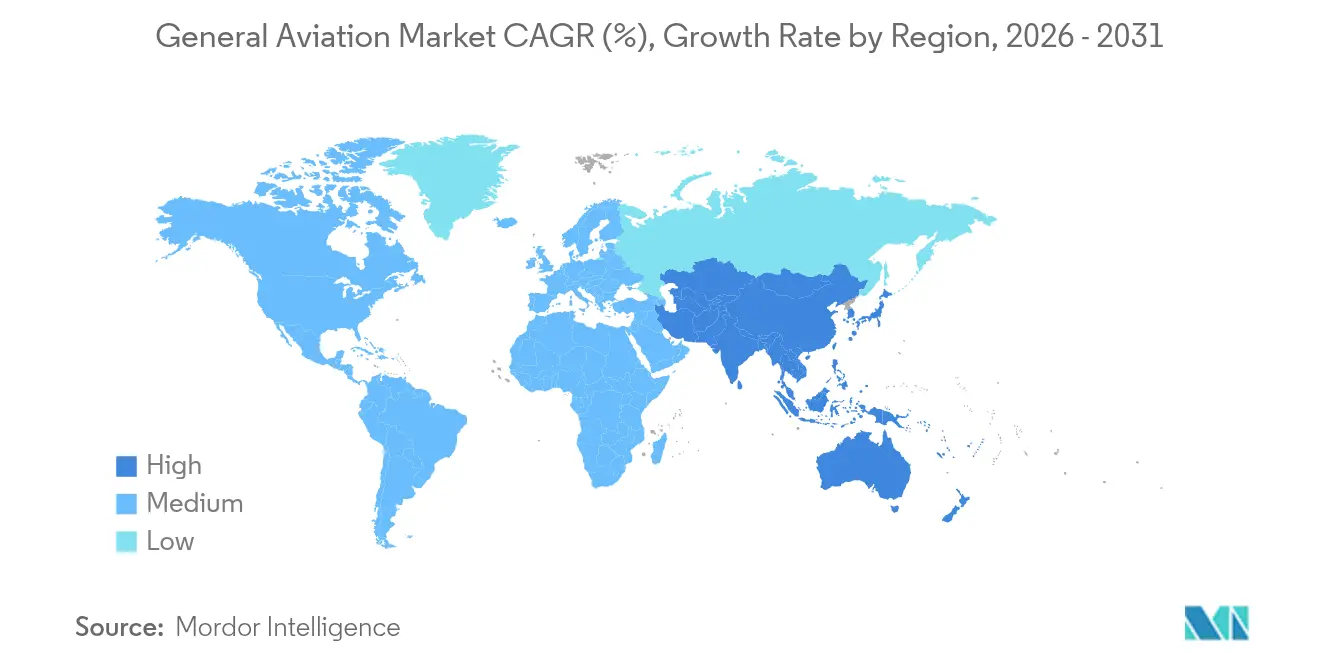
| Fastest Growing Market | Asia Pacific |
| Largest Market | North America |
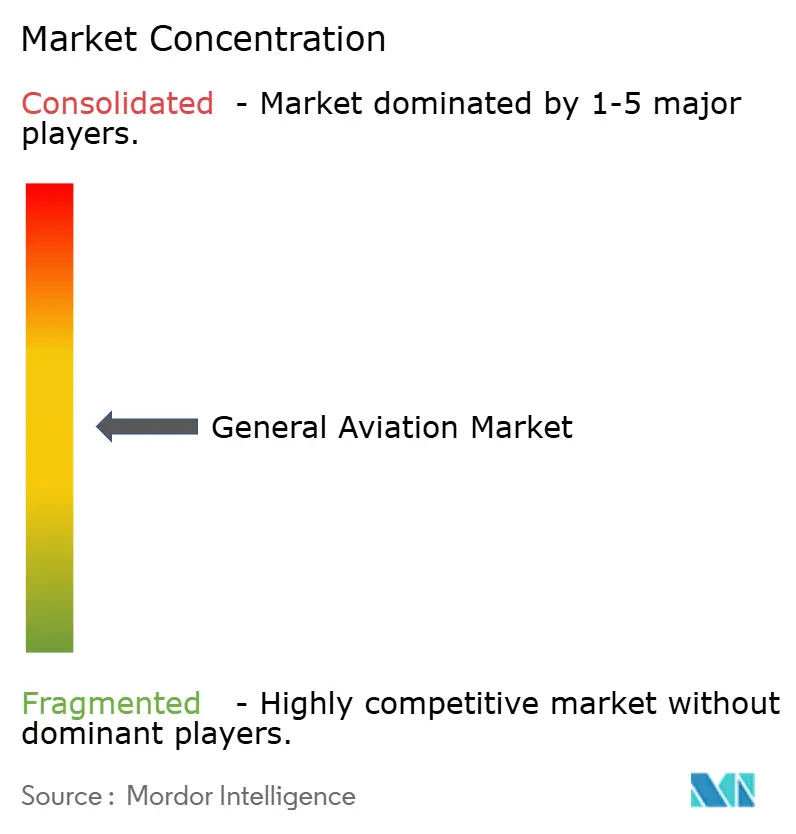
| Market Concentration | Medium |
Major Players *Disclaimer: Major Players sorted in no particular order Image © Mordor Intelligence. Reuse requires attribution under CC BY 4.0. | |
General Aviation Market Analysis by Mordor Intelligence
The general aviation market size was valued at USD 35.15 billion in 2025 and estimated to grow from USD 36.59 billion in 2026 to reach USD 44.76 billion by 2031, at a CAGR of 4.12% during the forecast period (2026-2031). Steady wealth creation, corporate profitability, and the rising appeal of point-to-point travel underpin this momentum. Business travel continues to dominate high-yield demand, yet the landscape is widening as electric vertical take-off and landing (eVTOL) programs advance certification processes. Fractional ownership platforms widen access, while infrastructure upgrades in developing economies open new routes. Established turbine propulsion retains a firm footing, but battery advances and sustainable aviation fuel incentives set the stage for cleaner operations.
Key Report Takeaways
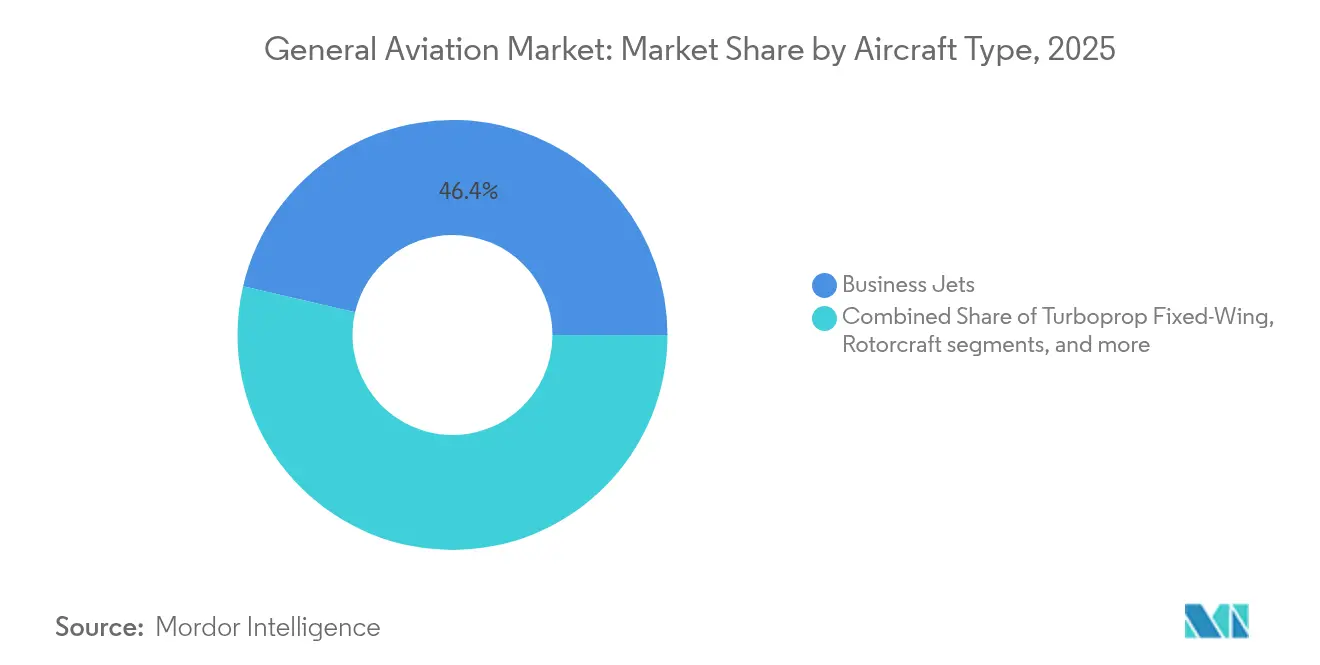
- By aircraft type, business jets held 46.36% of the general aviation market share in 2025; eVTOL and advanced air-mobility vehicles are projected to expand at a 3.62% CAGR through 2031.
- By propulsion type, conventional piston and turbine systems accounted for 90.98% of the general aviation market size in 2025, while all-electric propulsion is advancing at a 4.49% CAGR to 2031.
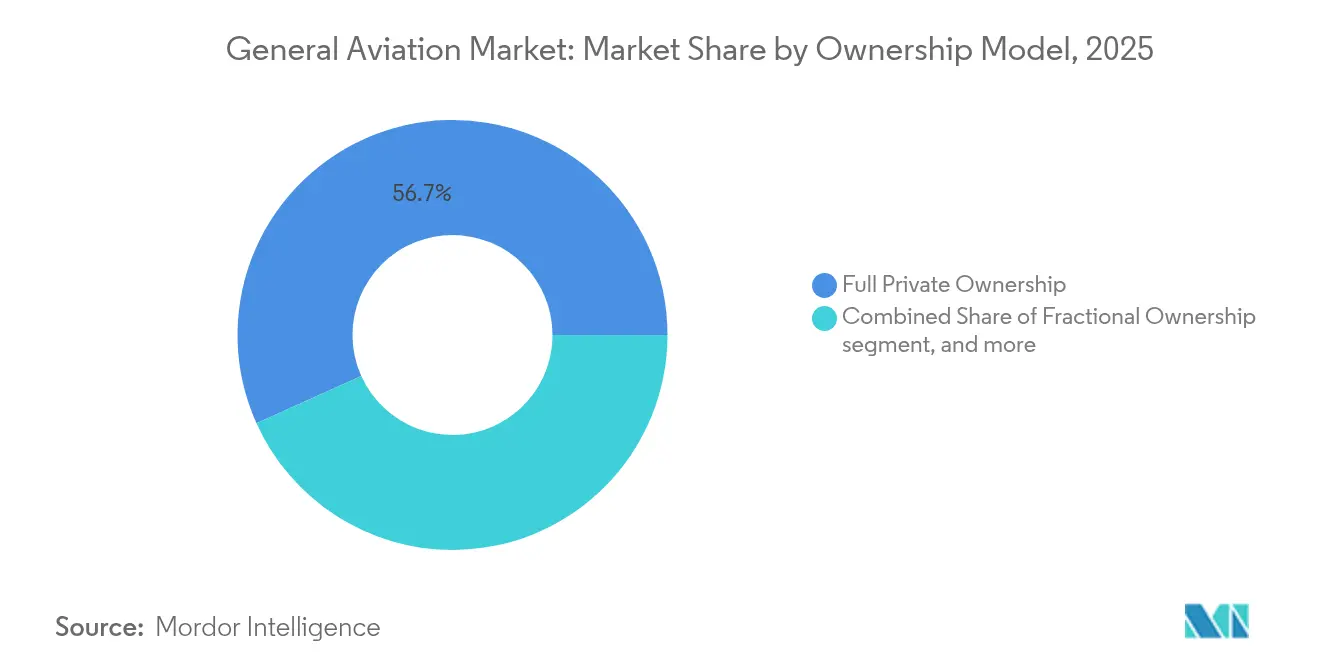
- By ownership model, full private ownership commanded 56.73% of the general aviation market size in 2025; charter and air-taxi operators are pacing at a 3.58% CAGR through 2031.
- By end-user application, business and corporate transport led with 48.65% general aviation market share in 2025; emergency medical services are forecasted to post a 5.05% CAGR to 2031.
- By geography, North America captured 51.12% of the general aviation market share in 2025, while Asia-Pacific is projected to log a 6.33% CAGR through 2031.
Note: Market size and forecast figures in this report are generated using Mordor Intelligence’s proprietary estimation framework, updated with the latest available data and insights as of 2026.
Global General Aviation Market Trends and Insights
Drivers Impact Analysis*
| Driver | (~) % Impact on CAGR Forecast | Geographic Relevance | Impact Timeline |
|---|---|---|---|
| Growing HNWI population and corporate profits | +0.6% | North America, Asia-Pacific | Medium term (2-4 years) |
| Fleet modernization and replacement cycle | +0.4% | North America, Europe | Long term (≥4 years) |
| Expansion of fractional ownership and charter platforms | +0.4% | North America with global spillover | Medium term (2-4 years) |
| Emerging general aviation infrastructure in developing nations | +0.3% | Asia-Pacific, Middle East, South America | Long term (≥4 years) |
| Urban-air-mobility (UAM) corridor integration | +0.2% | North America, Europe, pilot programs in Asia-Pacific | Long term (≥4 years) |
| Sustainable-aviation-fuel (SAF) incentive uptake | +0.2% | Europe, North America, expanding globally | Medium term (2-4 years) |
| Source: Mordor Intelligence | |||
Growing HNWI Population and Corporate Profits
Robust wealth expansion feeds premium aircraft demand as high-net-worth individuals (HNWIs) place a premium on time and privacy.[1]Boeing, “Business Jets Market Outlook,” Boeing Commercial Market Outlook, boeing.com After a strong 2024 earnings rebound, large corporations added aircraft to secure executive productivity and bypass congested hubs. Asia-Pacific generated 40% of new wealth pools, yet still lags in airport density, intensifying demand for mid-size and large-cabin jets capable of nonstop intercontinental legs. Fleet planners cite trackable productivity gains over scheduled airlines, reinforcing purchase justification. The result is a stable delivery pipeline that shields the general aviation market from broader airline cyclicality.
Fleet Modernization and Replacement Cycle
North America's median business jet age crossed 20 years in 2024, spurring operators to replace legacy cabins with fuel-efficient models.[2]Textron Aviation, “Annual Report 2024,” textron.com Modern flight decks deliver safety and connectivity upgrades that outweigh retrofit costs. Europe’s tightening noise rules are grounding non-compliant units sooner, lifting new-build demand. For multi-aircraft departments, digital fleet-wide health monitoring is now a baseline requirement. Modernization spending is thus framed as a strategic investment that lowers lifecycle costs and enhances dispatch reliability.
Expansion of Fractional Ownership and Charter Platforms
Fractional programs are lowering capital hurdles for executives who fly fewer annual hours while still valuing consistent cabin standards.[3]NetJets, “Fractional Ownership Programs,” netjets.com App-based charter networks reduce empty-leg flights, driving better economics for owners and users alike. Real-time availability matching unlocks new city-pair combinations previously uneconomical under traditional charter models. Regulators have clarified oversight frameworks, giving institutional buyers confidence in shared-asset structures. As digital booking norms spread globally, the addressable customer base for on-demand lift is widening.
Emerging Aviation Infrastructure in Developing Nations
Government-led airport construction initiatives connect secondary cities and remote regions, particularly in China, where 500 dedicated general aviation fields are targeted by 2030.[4]Civil Aviation Administration of China, “General Aviation Development Plan 2025-2030,” caac.gov.cn Public-private funding models are reducing fiscal burdens while ensuring long-term maintenance. Parallel rule-making is simplifying airspace access and aircraft registration, lowering operating friction. These developments create positive spillovers for maintenance, training, and parts distribution ecosystems. Infrastructure gains, therefore, extend the general aviation market’s geographic reach and resilience.
Restraints Impact Analysis*
| Restraint | (~) % Impact on CAGR Forecast | Geographic Relevance | Impact Timeline |
|---|---|---|---|
| High acquisition and operating costs | −0.3% | Global, most acute in emerging markets | Short term (≤2 years) |
| Stringent noise and emission regulations | −0.2% | Europe and North America, spreading worldwide | Medium term (2-4 years) |
| Pilot workforce shortage | −0.2% | North America and Europe, rising in Asia-Pacific | Medium term (2-4 years) |
| Avionics supply-chain disruptions | −0.1% | Global, concentrated impact on original-equipment makers | Short term (≤2 years) |
| Source: Mordor Intelligence | |||
High Acquisition and Operating Costs
Aircraft sticker prices climbed 8-12% in 2024 as supply-chain strain pushed component costs upward. Fuel volatility and spares inflation added pressure to hourly operating budgets. Insurance underwriters raised premiums amid pilot-shortage risk assessments, while rising interest rates increased debt-service burdens. For currency-weak emerging markets, dollar-denominated transactions became even less affordable. These immediate cost hurdles may defer some purchase decisions despite healthy long-term fundamentals.
Stringent Noise and Emission Regulations
The European Union's (EU's) expanded carbon-trading regime now covers general aviation operations, imposing direct compliance costs on operators. Community-noise objections are shortening airport curfews, reducing aircraft utilization, and pushing older fleets toward early retirement. Retrofit pathways are limited for specific legacy models, forcing accelerated replacements. While these rules incentivize sustainable aviation fuel and electric-propulsion uptake, near-term capex demands weigh profitability.
*Our forecasts treat driver/restraint impacts as directional, not additive. The impact forecasts reflect baseline growth, mix effects, and variable interactions.
Segment Analysis
By Aircraft Type: Business Jets Anchor Premium Demand
Business jets accounted for 46.36% of the general aviation market share in 2025, reflecting their dominance in time-critical corporate travel. Large-cabin platforms lead in revenue thanks to nonstop intercontinental range and high-comfort layouts. Mid-size variants offer balanced economics for regional missions, whereas light jets attract owner-pilots and charter brokers targeting short hops. The advanced air mobility eVTOLs segment is comparatively small today. Yet, this segment is set for a 3.62% CAGR as certification hurdles fall and urban congestion drives adoption. Rotorcraft remain indispensable for point-to-point emergency and utility roles but face growing urban competition from eVTOL platforms.
A diverse pipeline of clean-sheet designs underscores OEM confidence. Joby Aviation reached key FAA milestones in 2024, signaling imminent service entry. Turboprop and piston fixed-wing categories continue to serve training, cargo, and regional connectivity niches where runway constraints favor short-field performance. Overall, variety across mission sets insulates the general aviation market from a single-segment downturn.


By Propulsion Type: Conventional Powerplants Still Dominate
Conventional piston and turbine engines comprised 90.98% of the general aviation market in 2025. Turbine powerplants prevail in business jets for their high-altitude performance and global maintenance network support. Piston engines remain the mainstay of training fleets, benefiting from lower entry costs. Although only a small base today, all-electric propulsion is advancing at a 4.49% CAGR as battery-energy density improves. Hybrid-electric concepts are bridging range gaps while meeting early sustainability goals. Certification authorities are working alongside manufacturers to finalize electric-propulsion safety codes, setting the stage for broader adoption by decade’s end.
Operating-cost advantages, especially in short-hop training or urban shuttle applications, are emerging as pivotal adoption drivers. Charging-infrastructure projects at regional airports pair with renewable-energy mandates, accelerating ecosystem readiness. Still, until batteries meet longer-range mission needs, conventional turbines will retain primacy in the general aviation market.
By Ownership Model: Asset Control Versus On-demand Access
Full private ownership held 56.73% of the general aviation market size in 2025. Owner-operators value complete scheduling control, cabin personalization, and asset appreciation potential. Charter and air-taxi models, however, are rising on the back of digital platforms that reduce positioning flights and cut user costs. Fractional schemes attract corporates with variable flying patterns by splitting capital and fixed expenses among shareholders. Academic and training organizations present stable fleet demand for pilot development, while government and special-mission operators secure dedicated platforms for law enforcement and emergency tasks.
Utilization thresholds dictate the preferred model: high-hour users lean toward ownership to maximize availability, whereas sub-200-hour profiles increasingly gravitate toward fractional or charter solutions. As mobile booking interfaces mature, latent demand from small- to mid-sized enterprises is expected to lift the general aviation market.
By End-user Application: Corporate Travel Retains the Lion’s Share
Business and corporate transport generated 48.65% of the general aviation market share in 2025. Time-sensitive multinational operations and underserved city pairs sustain this dominance. Emergency medical services, climbing at a 5.05% CAGR, are capitalizing on healthcare-system upgrades and rural coverage gaps. Rotorcraft and specially fitted turboprops provide rapid access for critical-care teams, with Airbus Helicopters expanding dedicated EMS offerings. Recreational flying remains a resilient lifestyle segment, while special-mission contracts for border security, aerial surveillance, and disaster response broaden the mission mix. Flight-training demand continues as pathways are strengthened to alleviate the pilot shortfall.
Geography Analysis
North America secured 51.12% of the general aviation market share in 2025, anchored by the United States’ 200,000-plus active fleet and dense airport grid. Mature financing channels, comprehensive maintenance coverage, and a deep pilot pool reinforce regional leadership. Canada leverages aviation for resource exploration and remote-community access, whereas Mexico’s tourism corridors rely on private charters for point-to-point luxury traffic. Corporate balance-sheet strength and consistent residual-value performance build regional fleet modernization cycles.
Asia-Pacific is the fastest-growing arena with a 6.33% CAGR forecast through 2031. China’s plan to establish 500 general aviation airports by the decade’s end reshapes local air connectivity. India’s economic upswing is lifting charter activity despite infrastructure bottlenecks that are gradually easing via public-private partnerships. Japan and South Korea maintain high technology adoption rates, catalyzing avionics and sustainability innovations that ripple across global fleets. Australian operators continue to exploit general aviation for mining and medical outreach in sparsely populated interiors.
Europe commands a solid share, supported by dense corporate corridors and a sophisticated charter network. Stringent environmental rules are accelerating fleet renewals and pushing OEMs toward sustainable aviation fuel compatibility. Though ongoing EU harmonization efforts seek to mitigate friction, Brexit-related customs and regulatory divergence complicate cross-border operations. Natural-resource projects and VIP transport underpin demand in the Middle East and Africa, but varying regulatory maturity and infrastructure gaps temper near-term fleet expansion.

Competitive Landscape
The general aviation market displays moderate concentration. Bombardier, Gulfstream, and Textron continue to leverage scale advantages across production, support, and financing. Gulfstream’s delivery of its 300th G700 in June 2024 underscored a robust appetite for ultra-long-range cabins. Meanwhile, Bombardier’s Global 8000 launch signaled a push for range leadership at the large-cabin apex.
Disruptive entrants are focusing on eVTOL and autonomous systems. Joby Aviation’s 2024 type-certification progress validated its urban-mobility road map, while Archer Aviation’s demonstration flight with United Airlines showcased commercial-network potential. Intellectual-property filings in electric propulsion and flight-automation segments surged in 2024, highlighting an R&D arms race. Incumbents hedge through partnerships and minority stakes in eVTOL startups to preserve strategic options.
Supply-chain resilience and pilot-training capacity are emerging as competitive differentiators. Companies with vertically integrated avionics and engine programs and proprietary training academies are better positioned to manage delivery schedules amid component shortages and workforce gaps. Overall, legacy dominance and new-technology entrants position the general aviation market for healthy rivalry through the forecast horizon.
General Aviation Industry Leaders
Bombardier Inc.
Textron Inc.
Gulfstream Aerospace Corporation (General Dynamics Corporation)
Embraer S.A.
Dassault Aviation SA
- *Disclaimer: Major Players sorted in no particular order

Recent Industry Developments
- August 2025: Embraer achieved a significant milestone by surpassing 2,000 business jet deliveries. The milestone aircraft, a Praetor 500, was delivered to a corporate flight department during a ceremony held at Embraer’s state-of-the-art Global Customer Center in Melbourne, Florida.
- June 2025: Bombardier announced a major firm order for 50 of its high-performance Challenger and Global aircraft, accompanied by a ground breaking service agreement. The combined value of the aircraft and service agreements is USD 1.7 billion, with deliveries scheduled to commence in 2027.
- October 2023: Textron Aviation entered into a purchase agreement with Fly Alliance for up to 20 Cessna Citation business jets, including four firm orders and options for 16 additional aircraft.


Global General Aviation Market Report Scope
By Aircraft Type
| Business Jets | Large Jet |
| Mid-Size Jet | |
| Light/Very-Light Jet | |
| Turboprop Fixed-Wing | |
| Piston Fixed-Wing | |
| Rotorcraft | |
| Advanced Air Mobility eVTOLs |
By Propulsion Type
| Conventional Piston/Turbine |
| Hybrid-Electric |
| All-Electric |
By Ownership Model
| Full Private Ownership |
| Fractional Ownership |
| Charter/Air-Taxi Operators |
| Training and Academic Institutions |
| Government and Special-Mission Operators |
By End-User Application
| Business/Corporate Transport |
| Personal and Leisure Flying |
| Special Mission (ISR, Surveillance, Law Enforcement) |
| Emergency Medical/Air-Ambulance |
| Pilot Training |
By Geography
| North America | United States | |
| Canada | ||
| Mexico | ||
| Europe | United Kingdom | |
| France | ||
| Germany | ||
| Spain | ||
| Italy | ||
| Russia | ||
| Netherlands | ||
| Rest of Europe | ||
| Asia-Pacific | China | |
| India | ||
| Japan | ||
| South Korea | ||
| Indonesia | ||
| Australia | ||
| Thailand | ||
| Malaysia | ||
| Philippines | ||
| Singapore | ||
| Rest of Asia-Pacific | ||
| South America | Brazil | |
| Colombia | ||
| Rest of South America | ||
| Middle East and Africa | Middle East | Saudi Arabia |
| United Arab Emirates | ||
| Qatar | ||
| Turkey | ||
| Rest of Middle East | ||
| Africa | South Africa | |
| Egypt | ||
| Algeria | ||
| Nigeria | ||
| Rest of Africa | ||
| By Aircraft Type | Business Jets | Large Jet | |
| Mid-Size Jet | |||
| Light/Very-Light Jet | |||
| Turboprop Fixed-Wing | |||
| Piston Fixed-Wing | |||
| Rotorcraft | |||
| Advanced Air Mobility eVTOLs | |||
| By Propulsion Type | Conventional Piston/Turbine | ||
| Hybrid-Electric | |||
| All-Electric | |||
| By Ownership Model | Full Private Ownership | ||
| Fractional Ownership | |||
| Charter/Air-Taxi Operators | |||
| Training and Academic Institutions | |||
| Government and Special-Mission Operators | |||
| By End-User Application | Business/Corporate Transport | ||
| Personal and Leisure Flying | |||
| Special Mission (ISR, Surveillance, Law Enforcement) | |||
| Emergency Medical/Air-Ambulance | |||
| Pilot Training | |||
| By Geography | North America | United States | |
| Canada | |||
| Mexico | |||
| Europe | United Kingdom | ||
| France | |||
| Germany | |||
| Spain | |||
| Italy | |||
| Russia | |||
| Netherlands | |||
| Rest of Europe | |||
| Asia-Pacific | China | ||
| India | |||
| Japan | |||
| South Korea | |||
| Indonesia | |||
| Australia | |||
| Thailand | |||
| Malaysia | |||
| Philippines | |||
| Singapore | |||
| Rest of Asia-Pacific | |||
| South America | Brazil | ||
| Colombia | |||
| Rest of South America | |||
| Middle East and Africa | Middle East | Saudi Arabia | |
| United Arab Emirates | |||
| Qatar | |||
| Turkey | |||
| Rest of Middle East | |||
| Africa | South Africa | ||
| Egypt | |||
| Algeria | |||
| Nigeria | |||
| Rest of Africa | |||


Market Definition
- Aircraft Type - General Aviation includes aircraft used for corporate aviation, business aviation and other aerial works.
- Sub-Aircraft Type - Business Jets, Piston Fixed-Wing Aircraft, and helicopters and turboprop aircraft are taken into consideration.
- Body Type - Light Jets, Mid-Size Jets, and Large Jets according to their ability to carry passengers and flying distance ranges have been included under this study.
| Keyword | Definition |
|---|---|
| IATA | IATA stands for the International Air Transport Association, a trade organization composed of airlines around the world that has an influence over the commercial aspects of flight. |
| ICAO | ICAO stands for International Civil Aviation Organization, a specialized agency of the United Nations that supports aviation and navigation around the globe. |
| Air Operator Certificate (AOC) | A certificate granted by a National Aviation Authority permitting the conduct of commercial flying activities. |
| Certificate Of Airworthiness (CoA) | A Certificate Of Airworthiness (CoA) is issued for an aircraft by the civil aviation authority in the state in which the aircraft is registered. |
| Gross Domestic Product (GDP) | Gross domestic product (GDP) is a monetary measure of the market value of all the final goods and services produced in a specific time period by countries. |
| RPK (Revenue Passenger Kilometres) | The RPK of an airline is the sum of the products obtained by multiplying the number of revenue passengers carried on each flight stage by the stage distance - it is the total number of kilometers traveled by all revenue passengers. |
| Load Factor | The load factor is a metric used in the airline industry that measures the percentage of available seating capacity that has been filled with passengers. |
| Original Equipment Manufacturer (OEM) | An original equipment manufacturer (OEM) traditionally is defined as a company whose goods are used as components in the products of another company, which then sells the finished item to users. |
| International Transportation Safety Association (ITSA) | International Transportation Safety Association (ITSA) is an international network of heads of independent safety investigation authorities (SIA). |
| Available Seats Kilometre (ASK) | This metric is calculated by multiplying Available Seats (AS) in one flight, defined above, multiplied by the distance flown. |
| Gross Weight | The fully-loaded weight of an aircraft, also known as “takeoff weight,” which includes the combined weight of passengers, cargo, and fuel. |
| Airworthiness | The ability of an aircraft, or other airborne equipment or system, to operate in flight and on the ground without significant hazard to aircrew, ground crew, passengers or to other third parties. |
| Airworthiness Standards | Detailed and comprehensive design and safety criteria applicable to the category of aeronautical product (aircraft, engine or propeller). |
| Fixed Base Operator (FBO) | A business or organization that operates at an airport. An FBO provides aircraft operating services like maintenance, fueling, flight training, charter services, hangaring, and parking. |
| High Net worth Individuals (HNWIs) | High Net worth Individuals (HNWIs) are individuals with over USD 1 million in liquid financial assets. |
| Ultra High Net worth Individuals (UHNWIs) | Ultra High Net worth Individuals (UHNWIs) are individuals with over USD 30 million in liquid financial assets. |
| Federal Aviation Administration (FAA) | The division of the Department of Transportation is concerned with aviation. It operates Air Traffic Control and regulates everything from aircraft manufacturing to pilot training to airport operations in the United States. |
| EASA (European Aviation Safety Agency) | The European Aviation Safety Agency is a European Union agency established in 2002 with the task of overseeing civil aviation safety and regulation. |
| Airborne Warning and Control System (AW&C) aircraft | Airborne Warning and Control System (AEW&C) aircraft is equipped with a powerful radar and on-board command and control center to direct the armed forces. |
| The North Atlantic Treaty Organization (NATO) | The North Atlantic Treaty Organization (NATO), also called the North Atlantic Alliance, is an intergovernmental military alliance between 30 member states – 28 European and two North American. |
| Joint Strike Fighter (JSF) | Joint Strike Fighter (JSF) is a development and acquisition program intended to replace a wide range of existing fighter, strike, and ground attack aircraft for the United States, the United Kingdom, Italy, Canada, Australia, the Netherlands, Denmark, Norway, and formerly Turkey. |
| Light Combat Aircraft (LCA) | A light combat aircraft (LCA) is a light, multirole jet/turboprop military aircraft, commonly derived from advanced trainer designs, designed for engaging in light combat. |
| Stockholm International Peace Research Institute (SIPRI) | Stockholm International Peace Research Institute (SIPRI) is an international institute that provides data, analysis, and recommendations for armed conflict, military expenditure, and arms trade as well as disarmament and arms control. |
| Maritime Patrol Aircraft (MPA) | A maritime patrol aircraft (MPA), also known as maritime reconnaissance aircraft is a fixed-wing aircraft designed to operate for long durations over water in maritime patrol roles, in particular, anti-submarine warfare (ASW), anti-ship warfare (AShW), and search and rescue (SAR). |
| Mach Number | The Mach number is defined as the ratio of true airspeed to the speed of sound at the altitude of a given aircraft. |
| Stealth Aircraft | Stealth is a Common term applied to low observable (LO) technology and doctrine, that makes an aircraft near invisible to radar, infrared or visual detection. |


Research Methodology
Mordor Intelligence follows a four-step methodology in all our reports.
- Step-1: Identify Key Variables: In order to build a robust forecasting methodology, the variables and factors identified in Step-1 are tested against available historical market numbers. Through an iterative process, the variables required for market forecast are set and the model is built on the basis of these variables.
- Step-2: Build a Market Model: Market-size estimations for the historical and forecast years have been provided in revenue and volume terms. For sales conversion to volume, the average selling price (ASP) is kept constant throughout the forecast period for each country, and inflation is not a part of the pricing.
- Step-3: Validate and Finalize: In this important step, all market numbers, variables and analyst calls are validated through an extensive network of primary research experts from the market studied. The respondents are selected across levels and functions to generate a holistic picture of the market studied.
- Step-4: Research Outputs: Syndicated Reports, Custom Consulting Assignments, Databases & Subscription Platforms


