Market Overview
| Study Period | 2019 - 2031 |
|---|---|
| Forecast Data Period | 2026 - 2031 |
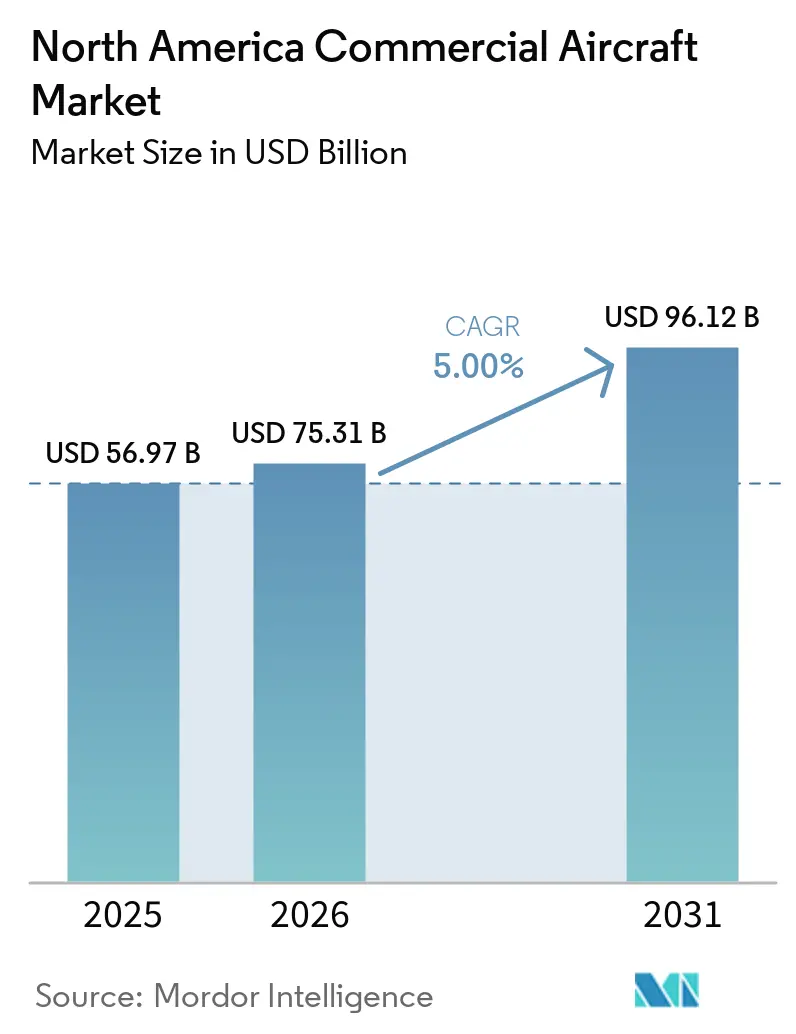
| Base Year Market Size (2025) | USD 56.97 Billion |
| Market Size (2026) | USD 75.31 Billion |
| Market Size (2031) | USD 96.12 Billion |
| Growth Rate (2026 - 2031) | 5.00% CAGR |
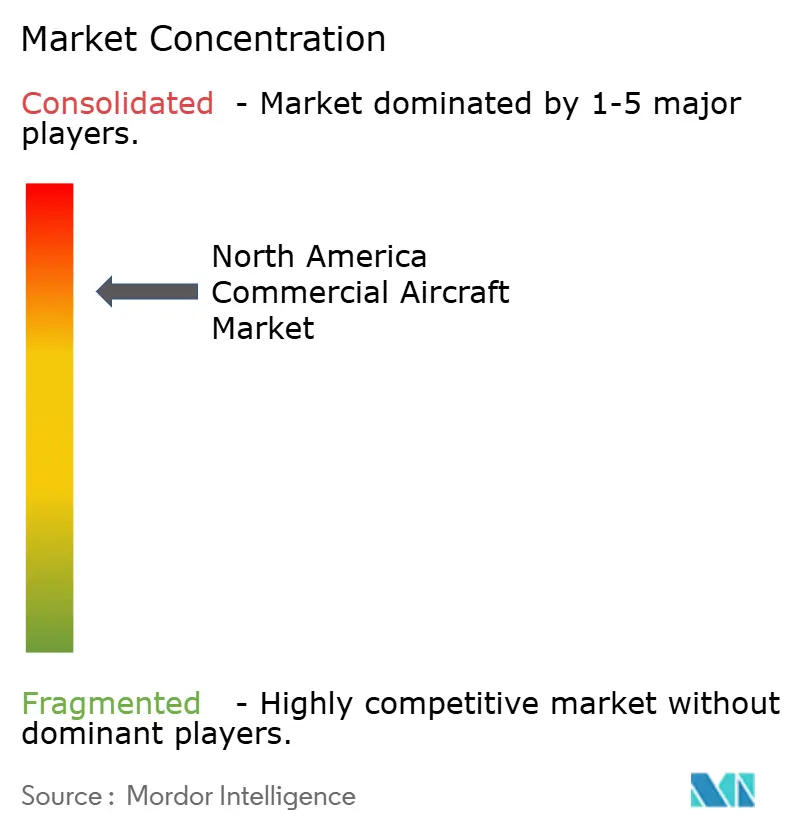
| Market Concentration | High |
Major Players *Disclaimer: Major Players sorted in no particular order Image © Mordor Intelligence. Reuse requires attribution under CC BY 4.0. | |
North America Commercial Aircraft Market Analysis by Mordor Intelligence
The North America commercial aircraft market size is expected to grow from USD 56.97 billion in 2025 to USD 75.31 billion in 2026 and is forecasted to reach USD 96.12 billion by 2031 at a 5.00% CAGR over 2026-2031. Fleet renewal to meet fuel efficiency targets, substantial backlogs for next‑generation narrowbodies, and steady network expansion by full‑service carriers (FSCs) and low‑cost carriers (LCCs) together support demand, even as supply chains and certification cycles stretch delivery timelines. Backlogs at major OEMs remain elevated, keeping lease rates firm and sustaining residual values for in‑service aircraft as operators bridge capacity gaps with extensions and short‑term lifts. Airlines continue to pivot toward cabin and connectivity upgrades that raise ancillary revenue yield. At the same time, regulators press for airspace modernization to improve utilization and on‑time performance over the medium term. Cargo dynamics are mixed, with North American carriers facing uneven international trade flows but maintaining an outsized share of dedicated freighters that sustain express and e‑commerce logistics.
Key Report Takeaways
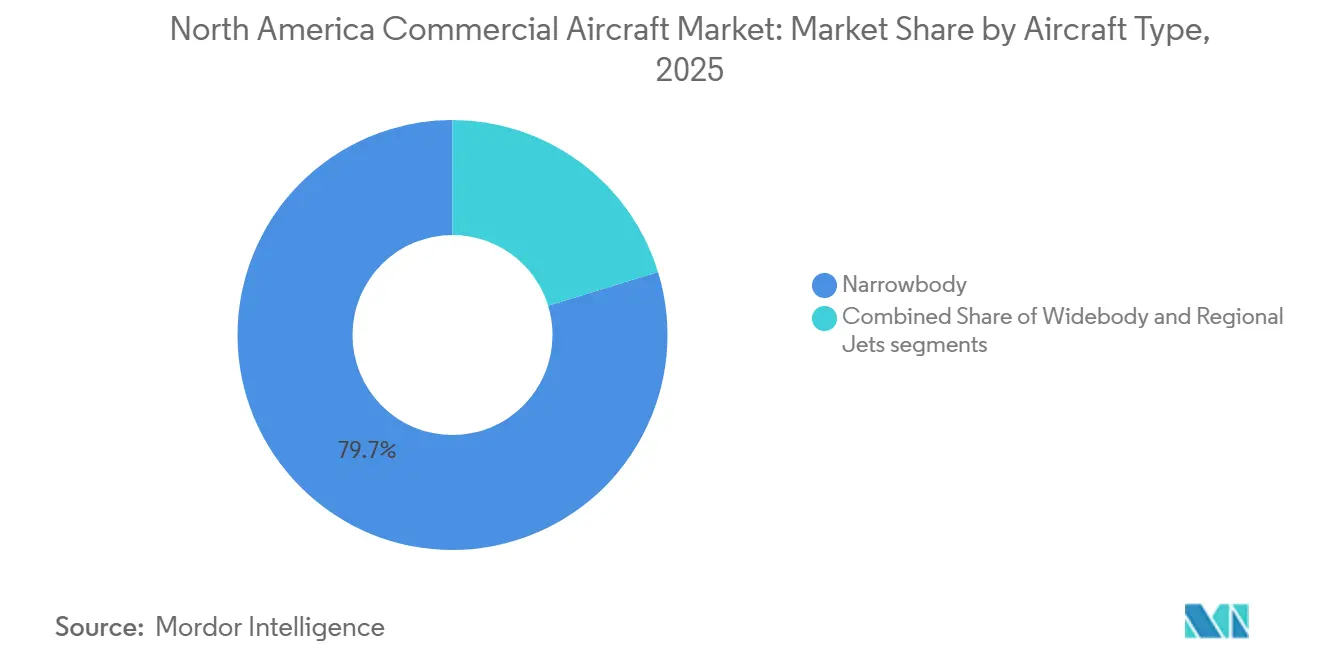
- By aircraft type, narrowbodies led with 79.73% share in 2025 and are projected to record the fastest 6.14% CAGR through 2031.
- By application, passenger operations held a 94.78% market share in 2025 and are forecasted to expand at a 5.76% CAGR through 2031.
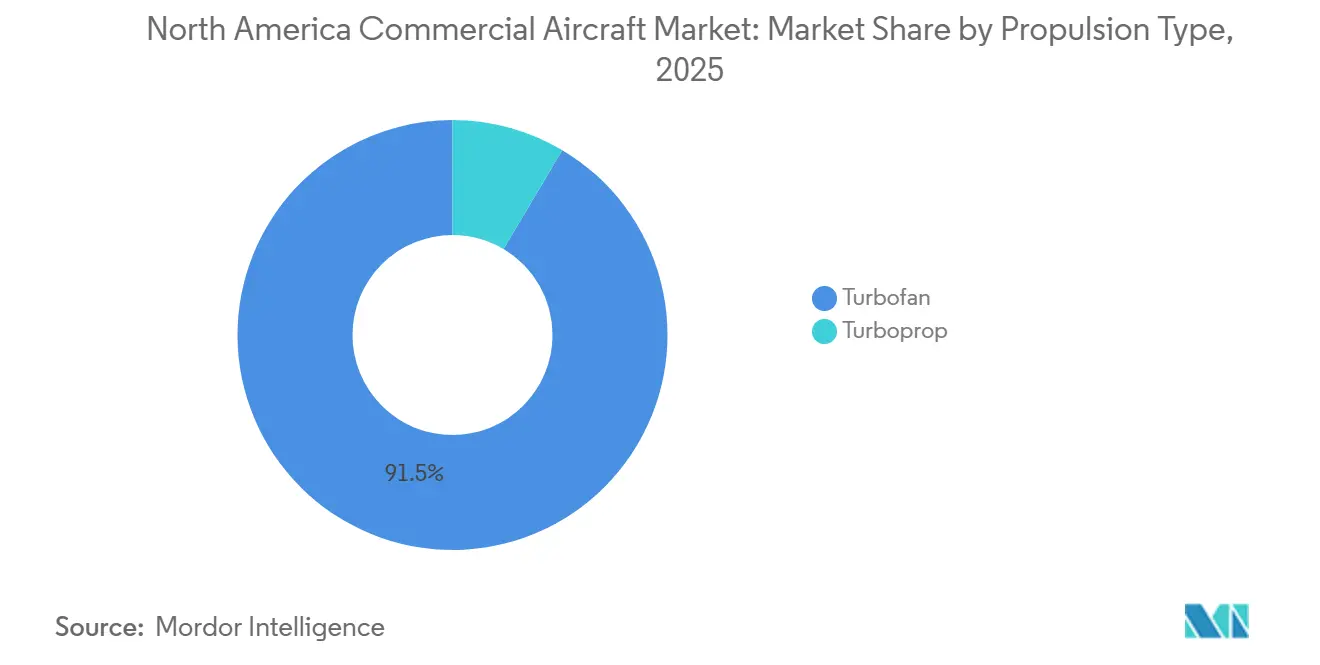
- By propulsion type, turbofans accounted for 91.47% share in 2025, while turboprops are forecast to grow at the highest 5.23% CAGR through 2031.
- By component, airframe structures captured a 32.91% share in 2025, and cabin interior and in‑flight connectivity are forecast to witness the fastest growth at 6.31% through 2031.
- By geography, the United States accounted for 84.66% in 2025 and is projected to advance at a 6.43% CAGR through 2031.
Note: Market size and forecast figures in this report are generated using Mordor Intelligence’s proprietary estimation framework, updated with the latest available data and insights as of 2026.
North America Commercial Aircraft Market Trends and Insights
Drivers Impact Analysis*
| Driver | (~) % Impact on CAGR Forecast | Geographic Relevance | Impact Timeline |
|---|---|---|---|
| Fleet replacement cycle accelerates (aging fleet, efficiency mandates) | +1.8% | Global, highest in United States mainline fleets | Medium term (2-4 years) |
| Upgauging and single-aisle dominance in networks and LCC growth | +1.4% | North America core, spillover to transborder Canada routes | Medium term (2-4 years) |
| US passenger traffic at record highs sustaining aircraft demand | +0.9% | United States domestic with cross‑border effects | Short term (≤ 2 years) |
| North America leads global freighter fleet and new widebody freighters | +0.5% | United States hub‑and‑spoke cargo networks with Canada gateways | Long term (≥ 4 years) |
| US SAF tax credits catalyze decarbonization investments | +0.3% | United States incentive zones | Medium term (2-4 years) |
| FAA NextGen capacity/efficiency gains support aircraft utilization | +0.2% | United States NAS with benefits to Canada routes | Long term (≥ 4 years) |
| Source: Mordor Intelligence | |||


Fleet Replacement Cycle Accelerates Due to Aging Fleet and Efficiency Mandates
Airlines in North America are prioritizing newer‑generation aircraft to reduce fuel burn and maintenance exposure as utilization normalizes and sustainability targets tighten. The replacement imperative is reinforced by extended delivery schedules that keep older fleets in service longer, which in turn sustain a parallel focus on reliability and cabin upgrades. At the same time, operators secure future slots for next‑generation narrowbodies and selective widebodies. The Federal Aviation Administration (FAA) projects US mainline fleets to expand from 4,829 jets in 2024 to 6,854 by 2045, an average of 96 aircraft per year, reflecting both replacement and moderate growth that reshapes fleet age profiles over the long term. Carriers are locking in delivery positions well into the next decade, which turns procurement timing into a competitive lever in slot‑constrained airports and high‑demand leisure corridors. These orders are closely tied to operating economics, as new single‑aisle platforms can materially lower unit costs relative to retiring families, supporting network flexibility and margin resilience in slower demand phases. The combined shift maintains pressure on supplier capacity, which underscores the importance of airspace modernization and certification throughput to convert orders into delivered lift over the forecast window.
Upgauging and Single‑Aisle Dominance in Networks Driven by LCC Growth
Single‑aisle aircraft continue to anchor network planning, as they combine favorable seat‑mile costs with the gate compatibility carriers need at secondary airports. The trend extends beyond low‑cost operators as legacy airlines standardize on higher‑density narrowbody configurations for transcontinental and select transatlantic services, reinforcing the center of gravity in the North American commercial aircraft market. OEM production plans reflect this trajectory, as the A320 Family ramp targets higher monthly output in the late decade, while program backlogs anchor multi‑year schedule visibility for airlines and lessors.[1]Airbus Communications, “Ramping Up A320 Family Production,” Airbus, airbus.com Upgauging helps offset labor and airport constraints because larger single‑aisle variants allow carriers to add seats without increasing movements at heavily utilized hubs. This strategy also supports route experimentation in long‑thin markets, where new‑generation narrowbodies can fly farther at improved economics, sustaining fleet commonality while broadening network reach. As a result, the narrowbody franchise remains the primary growth vector in the North America commercial aircraft market across the forecast period.
US Passenger Traffic at Record Highs Sustaining Aircraft Demand
Passenger volumes stabilized after the post‑pandemic rebound, with seasonal peaks that continue to test airport and airspace capacity at major metro areas. Federal data for August 2025 show systemwide traffic slightly below the prior year, even as international trips set a new August high, which signals a shift toward long‑haul leisure and visiting‑friends‑and‑relatives demand. The pattern favors larger narrowbodies on trunk leisure routes and steady widebody utilization on transatlantic corridors, while corporate travel recovery remains slower in key business markets. This mix supports measured fleet growth, but with a premium on aircraft that can monetize premium economy and high‑reliability schedules during holiday spikes. The outlook also underscores the role of FAA modernization programs, as throughput gains and improved traffic management can boost adequate capacity without new runways. In turn, this helps the North America commercial aircraft market navigate slower-growth periods while protecting asset utilization.
North America Leads Global Freighter Fleet and New Widebody Freighter Deliveries
North American operators maintain an outsized role in dedicated cargo capacity, anchored by integrated express networks and dense e‑commerce flows that rely on time‑definite delivery. Industry data show that the region’s cargo performance diverged from global averages during 2025 with a stronger intra‑regional tilt, while full‑year trends reflected weaker international trade lanes.[2]IATA Media Relations, “Air Cargo Market Updates 2025,” International Air Transport Association, iata.org OEM outlooks anticipate sustained freighter demand in the Americas over the long term, including a multiyear pipeline of deliveries and conversions as older platforms retire. Airbus market materials highlight new‑build widebody freighters and conversion availability that together bridge the compliance transition tied to emissions standards coming into force later this decade. Recent lessor activity confirms the pivot to conversion capacity, as B777‑300ERSF units have been delivered to operators in the region, creating more options for high‑payload missions. Across the cycle, this cargo backbone supports the North America commercial aircraft market by balancing passenger seasonality and enabling fleet planners to optimize utilization.
Restraints Impact Analysis*
| Restraint | (~) % Impact on CAGR Forecast | Geographic Relevance | Impact Timeline |
|---|---|---|---|
| Engine reliability/inspection cycles disrupt capacity and deliveries | -0.7% | Global, with grounding effects among North American operators | Short term (≤ 2 years) |
| Aerospace supply-chain constraints (castings/forgings/titanium) | -0.5% | United States OEM final assembly with spillovers to Canada and Mexico | Medium term (2-4 years) |
| Pilot and AMT pipeline constraints at regionals raise costs | -0.2% | United States regionals, secondary impact in Canada | Medium term (2-4 years) |
| Scope-clause ceilings limit new sub-100-seat jets adoption | -0.1% | United States regional networks governed by union agreements | Long term (≥ 4 years) |
| Source: Mordor Intelligence | |||
Engine Reliability and Inspection Cycles Disrupt Capacity and Deliveries
Inspection findings and mandated shop visits on selected engine families have tightened available lift and lengthened maintenance turn times across portions of the fleet. Airlines are mitigating through lease extensions and sub‑fleet swaps, but that requires coordination with airport slots and crew availability, which limits how quickly grounded capacity can be offset. Lessors are also recalibrating terms as parked assets and late deliveries alter supply, which keeps lease rates firm relative to pre‑pandemic baselines. Over the forecast period, faster parts flow and greater MRO throughput can reduce disruption. Still, in the short term, the North America commercial aircraft market faces localized groundings and operational buffers.
Aerospace Supply‑Chain Constraints Affecting Castings, Forgings, and Titanium Availability
Structural parts and rotating components continue to show extended lead times, which constrain OEM build rates and delay airline inductions. The challenges have prompted strategic steps at top manufacturers, including transaction‑driven integration to stabilize critical fuselage and structures output tied to major single‑aisle programs. Engine makers are also expanding forging and disk capacity, but new press installations and qualification timelines mean incremental volumes arrive with a multi‑year lag. Airframers have adjusted production targets for high‑demand narrowbody families to reflect engine availability and upstream constraints, underscoring the criticality of propulsion supply to the delivery schedule. The combined effect is a slower‑than‑planned backlog clearance, which channels more airline demand into used aircraft and conversions as tactical bridges. These dynamics keep the North America commercial aircraft market on a tight supply footing through the medium term, with improvement expected as new capacity comes online.
*Our forecasts treat driver/restraint impacts as directional, not additive. The impact forecasts reflect baseline growth, mix effects, and variable interactions.
Segment Analysis
By Aircraft Type: Narrowbody Jets Secure Backlog Pricing Power
Narrowbodies captured 79.73% of the North America commercial aircraft market share in 2025 and are forecast to post a 6.14% CAGR through 2031. Backlogs and production ramps for single-aisle aircraft indicate multi-year delivery visibility, supporting fleet commonality and network upgauging. Operators prioritize single-aisle aircraft for new capacity due to gate compatibility and turnaround advantages, while accommodating seasonality and peak demand. Elevated backlogs and tight production slots sustain residual values for in-service units, further driving procurement toward narrowbody aircraft.
Widebodies remain essential for long-haul networks and premium cabin revenue, though their growth rate is slower than that of narrowbodies. Cargo variants and conversions help stabilize utilization as older freighter lines retire. Regional jets continue to serve short-haul routes, but pilot scope and unit costs lead many operators to favor larger narrowbodies or modern turboprops. The procurement environment remains slot-driven, favoring carriers and lessors with early multi-year delivery agreements. This dynamic keeps the market focused on single-aisle programs while leveraging widebodies and regionals where economically viable.


By Application: Passenger Operations Dominate Despite Cargo’s Strategic Value
Passenger operations held a 94.78% share in 2025 and are projected to grow at a 5.76% CAGR through 2031, ensuring that most of the North America commercial aircraft market remains tied to single‑aisle fleet plans and premium‑economy monetization. Traffic data show a tilt toward international leisure within seasonal peaks, which preserves widebody relevance while reinforcing the primacy of high‑capacity narrowbodies on domestic and transborder routes. Airlines are allocating more cabin space to products that raise yield without significant weight penalties, which supports investments in connectivity and interiors at delivery to lock in lifetime ancillary revenue options.
Freighter applications continue to carry strategic weight that exceeds their revenue share suggests. The region’s express and e‑commerce ecosystems rely on dedicated aircraft to maintain next‑day and two‑day service standards, which underpins long‑term forecasts for new‑build freighters and conversions across the Americas. Airbus market materials also highlight new entrants in the widebody cargo space that will reach service later in the decade, complementing the conversion pipeline. Confirmed deliveries of B777‑300ERSF units to North American operators signal deeper conversion capacity that can support payload‑intensive missions during the production transition.[3]AerCap Corporate Communications, “AerCap Cargo Delivers First Two Boeing 777‑300ERSF,” AerCap, aercap.com Even amid mixed international cargo trends in 2025, the structural role of freighters helps balance seasonal swings in passenger flying, thereby steadying overall fleet utilization in the North America commercial aircraft market.
By Propulsion Type: Turbofan Engines Dominate, Turboprops Gain Regional Traction
Turbofan engines accounted for 91.47% of the market in 2025, driven by the scale of leading single‑aisle families across the region’s trunk routes. The installed base benefits from multi‑year production commitments and robust aftermarket activity, reinforcing the centrality of turbofan technology for the North America commercial aircraft market. OEMs and joint ventures have secured long‑term service agreements with major operators, supporting spare parts flows and MRO investments that protect dispatch reliability as flight hours rise. These actions keep turbofan fleets positioned for sustained utilization even as inspection cycles ripple through selected sub‑fleets.
Turboprops are projected to grow at a 5.23% CAGR through 2031 as regional networks favor right‑sized lift on short sectors and thinner routes. Modern turboprops can outperform small regional jets on fuel burn and trip costs for stage lengths under 300 miles, supporting their adoption in local and essential air service markets. Airlines also weigh the maintenance and training advantages of simplified fleets, which can tilt decisions toward turboprops when small‑jet economics are constrained. As these factors persist, turboprops remain the fastest‑growing propulsion segment in the North America commercial aircraft market through 2031.
By Component: Airframe Structures Lead, Cabin Systems Accelerate on Ancillary Revenue Push
Airframe structures accounted for 32.91% in 2025, reflecting the material intensity and labor content of fuselages, wings, and empennages that drive the economics of final assembly. Strategic integration moves by OEMs underscore the importance of stabilizing fuselage and structures output on core programs, which can shorten recovery timelines and reduce quality escapes that delay deliveries in the North America commercial aircraft market. Engine systems and the associated aftermarket form the second‑largest component pool, supported by long‑term service contracts and MRO networks that monetize installed base growth. Airframers continue to diversify supplier bases for major subassemblies while balancing the logistics of globalized production with the need to protect critical path parts from disruption.
Cabin interior and in‑flight connectivity is the fastest‑growing sub‑segment at 6.31% through 2031, as airlines shift more revenue to seating, premium economy, and digital services. Investment announcements from major suppliers highlight new capacity coming online to support line‑fit installations, reducing retrofit downtime and enabling revenue-generating features from day one. Avionics and integrated flight decks remain a steady share, driven by reliability and certification requirements that favor bundled solutions. As production stabilizes through the forecast, line‑fit demand for cabins and avionics should track aircraft deliveries, while aftermarket refresh cycles bring follow‑on opportunities.
Geography Analysis
The US accounted for 84.66% of North America's commercial aircraft market share in 2025 and is forecasted to grow at a 6.43% CAGR through 2031, anchoring the market's growth during this period. Federal forecasts indicate sustained mainline fleet growth through 2045 at an average of 96 aircraft per year, reflecting both replacement and moderate expansion. Airspace modernization and agency restructuring launched in early 2026 aim to streamline safety oversight and accelerate NextGen capabilities, improving throughput and on-time performance. OEM market outlooks and narrowbody ramp plans align with this demand profile, supported by multi-year order books and incremental capacity expansions in US final assembly footprints.
Canada represents a smaller but strategically important share, focusing on right-sized fleets and point-to-point connectivity. Adjustments in Canada-US transborder seats are expected through early 2026, alongside domestic network expansion driven by leisure flows and secondary markets. Fleet decisions emphasize efficient narrowbodies and new-technology regional jets, supported by OEM pipelines and MRO infrastructure investments. Long-haul fleet renewal at the country's largest operator adds flexibility on thinner transatlantic routes. It diversifies the widebody mix in the late decade, contributing to steady growth in the Canadian market segment.
Mexico contributes a modest share, with cross-border connectivity and domestic leisure routes relying on high-density single-aisle aircraft. Network planning in the country is influenced by airport capacity and slot allocation at key metro airports, shaping fleet additions and schedule deployment. Engine inspection cycles have impacted short-term availability in selected fleets, encouraging a cautious approach to growth while focusing on utilization and load factors. Over the forecast period, domestic leisure demand and US transborder flows keep Mexico integrated into the market, with opportunities concentrated in seasonal peaks and regional tourism corridors.
Competitive Landscape
The North America commercial aircraft market is anchored by a two-OEM structure at the significant transport level, with Airbus and Boeing accounting for the majority of deliveries across single-aisle and twin-aisle programs. Backlogs and production ramps frame pricing and slot dynamics, placing a premium on early commitments and long-term fleet planning for airlines and lessors. On the supply side, structural integration continues to reshape final assembly and tier-one relationships, as seen in the consolidation of a major fuselage supplier. Airframers are also pursuing distributed production strategies that expand US narrowbody capacity, diversify geographic risk, and align outputs with North American demand.
Engine makers and their joint ventures compete through installed base expansion and long-term service agreements that underpin aftermarket economics. Investments in isothermal forging and rotating component capacity aim to ease bottlenecks in disks and other life-limited parts, compressing shop-visit durations as volumes ramp. These moves support reliability gains across the North America commercial aircraft market and position engine OEMs for stable revenue from time-on-wing improvements and maintenance programs.
Conversion specialists and lessors are expanding cargo capacity to meet transitional needs as legacy freighter production sunsets and new-build programs approach entry into service. On the passenger side, cabin and connectivity suppliers are enlarging North American footprints to support line-fit installations that unlock ancillary revenue streams from streaming, shopping, and dynamic seat products. Together, these strategic moves sustain momentum in the North America commercial aircraft market even as supply constraints and inspection cycles shape near-term fleet availability.
North America Commercial Aircraft Industry Leaders
Airbus SE
The Boeing Company
Embraer S.A.
Commercial Aircraft Corporation of China, Ltd. (COMAC)
Avions de Transport Régional GIE (ATR)
- *Disclaimer: Major Players sorted in no particular order

Recent Industry Developments
- February 2026: Air Canada firmed up an order for eight A350‑1000 aircraft, bolstering its widebody strategy and enhancing flexibility for thinner transatlantic routes as the decade winds down.
- January 2026: The FAA announced a significant organizational restructuring to unify safety oversight and expedite airspace modernization. This initiative is part of an investment plan to establish a new National Airspace System backbone by the end of the decade.
- December 2025: The Boeing Company completed the acquisition of Spirit AeroSystems to consolidate the production of critical fuselage and structures and to address quality issues that had hindered single-aisle output.


North America Commercial Aircraft Market Report Scope
This report examines the North America commercial aircraft market, emphasizing the design, manufacturing, assembly, delivery, and aftermarket support of fixed-wing aircraft used for passenger and cargo transportation. The study covers narrowbody, widebody, and regional aircraft, including both jet and turboprop platforms. It assesses market performance across areas such as original equipment manufacturing (OEM) sales, fleet replacement, and capacity expansion, all of which are influenced by airline demand. The analysis spans the entire aircraft ecosystem, including airframe and propulsion systems, avionics, cabin interiors, and integrated service offerings, for both linefit and retrofit installations.
The North America commercial aircraft market is segmented by aircraft type, application, propulsion type, component, and geography. By aircraft type, the market is segmented into narrowbody, widebody, and regional jets. By application, the market is segmented into passenger and freighter. By propulsion type, the market is segmented into turbofan and turboprop. By component, the market is segmented into airframe structures, aero-engines, avionics and flight control, cabin interior and IFEC, and other components. The report also covers the market sizes and forecasts for the commercial aircraft market in major countries across North America. For each segment, the market size and forecast are provided in terms of value (USD).
By Aircraft Type
| Narrowbody |
| Widebody |
| Regional Jets |
By Application
| Passenger |
| Freighter |
By Propulsion Type
| Turbofan |
| Turboprop |
By Component
| Airframe Structures |
| Aero-Engines |
| Avionics and Flight Control |
| Cabin Interior and IFEC |
| Other Components |
By Geography
| United States |
| Canada |
| Mexico |
| By Aircraft Type | Narrowbody |
| Widebody | |
| Regional Jets | |
| By Application | Passenger |
| Freighter | |
| By Propulsion Type | Turbofan |
| Turboprop | |
| By Component | Airframe Structures |
| Aero-Engines | |
| Avionics and Flight Control | |
| Cabin Interior and IFEC | |
| Other Components | |
| By Geography | United States |
| Canada | |
| Mexico |


Market Definition
- Aircraft Type - Commercial Aviation includes aircraft used to haul passengers and freight on a scheduled basis between selected airports.
- Body Type - Narrowbody and widebody aircraft which are single aisle and twin aisle are included under this study.
- Sub-Aircraft Type - Fixed-Wing passenger aircraft and freighter aircraft operated by airlines and adapted for carrying passengers and cargo are considered under the study.
| Keyword | Definition |
|---|---|
| IATA | IATA stands for the International Air Transport Association, a trade organization composed of airlines around the world that has an influence over the commercial aspects of flight. |
| ICAO | ICAO stands for International Civil Aviation Organization, a specialized agency of the United Nations that supports aviation and navigation around the globe. |
| Air Operator Certificate (AOC) | A certificate granted by a National Aviation Authority permitting the conduct of commercial flying activities. |
| Certificate Of Airworthiness (CoA) | A Certificate Of Airworthiness (CoA) is issued for an aircraft by the civil aviation authority in the state in which the aircraft is registered. |
| Gross Domestic Product (GDP) | Gross domestic product (GDP) is a monetary measure of the market value of all the final goods and services produced in a specific time period by countries. |
| RPK (Revenue Passenger Kilometres) | The RPK of an airline is the sum of the products obtained by multiplying the number of revenue passengers carried on each flight stage by the stage distance - it is the total number of kilometers traveled by all revenue passengers. |
| Load Factor | The load factor is a metric used in the airline industry that measures the percentage of available seating capacity that has been filled with passengers. |
| Original Equipment Manufacturer (OEM) | An original equipment manufacturer (OEM) traditionally is defined as a company whose goods are used as components in the products of another company, which then sells the finished item to users. |
| International Transportation Safety Association (ITSA) | International Transportation Safety Association (ITSA) is an international network of heads of independent safety investigation authorities (SIA). |
| Available Seats Kilometre (ASK) | This metric is calculated by multiplying Available Seats (AS) in one flight, defined above, multiplied by the distance flown. |
| Gross Weight | The fully-loaded weight of an aircraft, also known as “takeoff weight,” which includes the combined weight of passengers, cargo, and fuel. |
| Airworthiness | The ability of an aircraft, or other airborne equipment or system, to operate in flight and on the ground without significant hazard to aircrew, ground crew, passengers or to other third parties. |
| Airworthiness Standards | Detailed and comprehensive design and safety criteria applicable to the category of aeronautical product (aircraft, engine or propeller). |
| Fixed Base Operator (FBO) | A business or organization that operates at an airport. An FBO provides aircraft operating services like maintenance, fueling, flight training, charter services, hangaring, and parking. |
| High Net worth Individuals (HNWIs) | High Net worth Individuals (HNWIs) are individuals with over USD 1 million in liquid financial assets. |
| Ultra High Net worth Individuals (UHNWIs) | Ultra High Net worth Individuals (UHNWIs) are individuals with over USD 30 million in liquid financial assets. |
| Federal Aviation Administration (FAA) | The division of the Department of Transportation is concerned with aviation. It operates Air Traffic Control and regulates everything from aircraft manufacturing to pilot training to airport operations in the United States. |
| EASA (European Aviation Safety Agency) | The European Aviation Safety Agency is a European Union agency established in 2002 with the task of overseeing civil aviation safety and regulation. |
| Airborne Warning and Control System (AW&C) aircraft | Airborne Warning and Control System (AEW&C) aircraft is equipped with a powerful radar and on-board command and control center to direct the armed forces. |
| The North Atlantic Treaty Organization (NATO) | The North Atlantic Treaty Organization (NATO), also called the North Atlantic Alliance, is an intergovernmental military alliance between 30 member states – 28 European and two North American. |
| Joint Strike Fighter (JSF) | Joint Strike Fighter (JSF) is a development and acquisition program intended to replace a wide range of existing fighter, strike, and ground attack aircraft for the United States, the United Kingdom, Italy, Canada, Australia, the Netherlands, Denmark, Norway, and formerly Turkey. |
| Light Combat Aircraft (LCA) | A light combat aircraft (LCA) is a light, multirole jet/turboprop military aircraft, commonly derived from advanced trainer designs, designed for engaging in light combat. |
| Stockholm International Peace Research Institute (SIPRI) | Stockholm International Peace Research Institute (SIPRI) is an international institute that provides data, analysis, and recommendations for armed conflict, military expenditure, and arms trade as well as disarmament and arms control. |
| Maritime Patrol Aircraft (MPA) | A maritime patrol aircraft (MPA), also known as maritime reconnaissance aircraft is a fixed-wing aircraft designed to operate for long durations over water in maritime patrol roles, in particular, anti-submarine warfare (ASW), anti-ship warfare (AShW), and search and rescue (SAR). |
| Mach Number | The Mach number is defined as the ratio of true airspeed to the speed of sound at the altitude of a given aircraft. |
| Stealth Aircraft | Stealth is a Common term applied to low observable (LO) technology and doctrine, that makes an aircraft near invisible to radar, infrared or visual detection. |


Research Methodology
Mordor Intelligence follows a four-step methodology in all our reports.
- Step-1: Identify Key Variables: In order to build a robust forecasting methodology, the variables and factors identified in Step-1 are tested against available historical market numbers. Through an iterative process, the variables required for market forecast are set and the model is built on the basis of these variables.
- Step-2: Build a Market Model: Market-size estimations for the historical and forecast years have been provided in revenue and volume terms. For sales conversion to volume, the average selling price (ASP) is kept constant throughout the forecast period for each country, and inflation is not a part of the pricing.
- Step-3: Validate and Finalize: In this important step, all market numbers, variables and analyst calls are validated through an extensive network of primary research experts from the market studied. The respondents are selected across levels and functions to generate a holistic picture of the market studied.
- Step-4: Research Outputs: Syndicated Reports, Custom Consulting Assignments, Databases & Subscription Platforms


