Market Overview
| Study Period | 2019 - 2031 |
|---|---|
| Forecast Data Period | 2026 - 2031 |
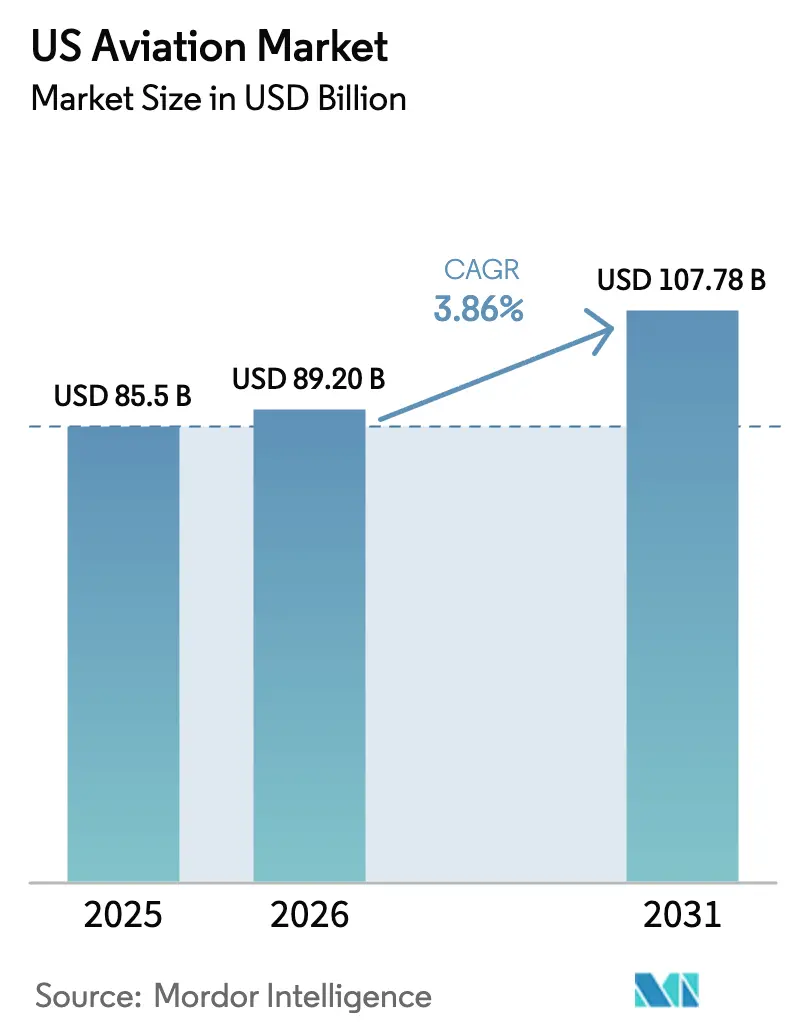
| Base Year Market Size (2025) | USD 85.5 Billion |
| Market Size (2026) | USD 89.20 Billion |
| Market Size (2031) | USD 107.78 Billion |
| Growth Rate (2026 - 2031) | 3.86% CAGR |
| Market Concentration | Medium |
Major Players *Disclaimer: Major Players sorted in no particular order Image © Mordor Intelligence. Reuse requires attribution under CC BY 4.0. | |
US Aviation Market Analysis by Mordor Intelligence
The US aviation market size is expected to grow from USD 85.50 billion in 2025 to USD 89.20 billion in 2026 and is projected to reach USD 107.78 billion by 2031 at a 3.86% CAGR. Capacity and supply constraints are shaping the next phase, as operators extend aircraft service life. At the same time, new deliveries remain limited, leading to an increased emphasis on reliability, network optimization, and fuel efficiency across fleets. Commercial aviation holds the largest revenue base due to sustained narrowbody renewal. In contrast, military aviation is the fastest-growing segment, supported by elevated defense procurement and sustainment priorities that stabilize OEM backlogs and MRO pipelines. The policy and infrastructure backdrop remains mixed, with airport and airspace modernization advancing under the FAA’s national program and North American profitability lagging Europe, according to the global association outlook for 2026. Airlines, manufacturers, and defense primes continue to recalibrate capital spending and contracting structures to mitigate delayed timelines, supplier fragility, and workforce shortages that influence asset utilization and route economics.
Key Report Takeaways
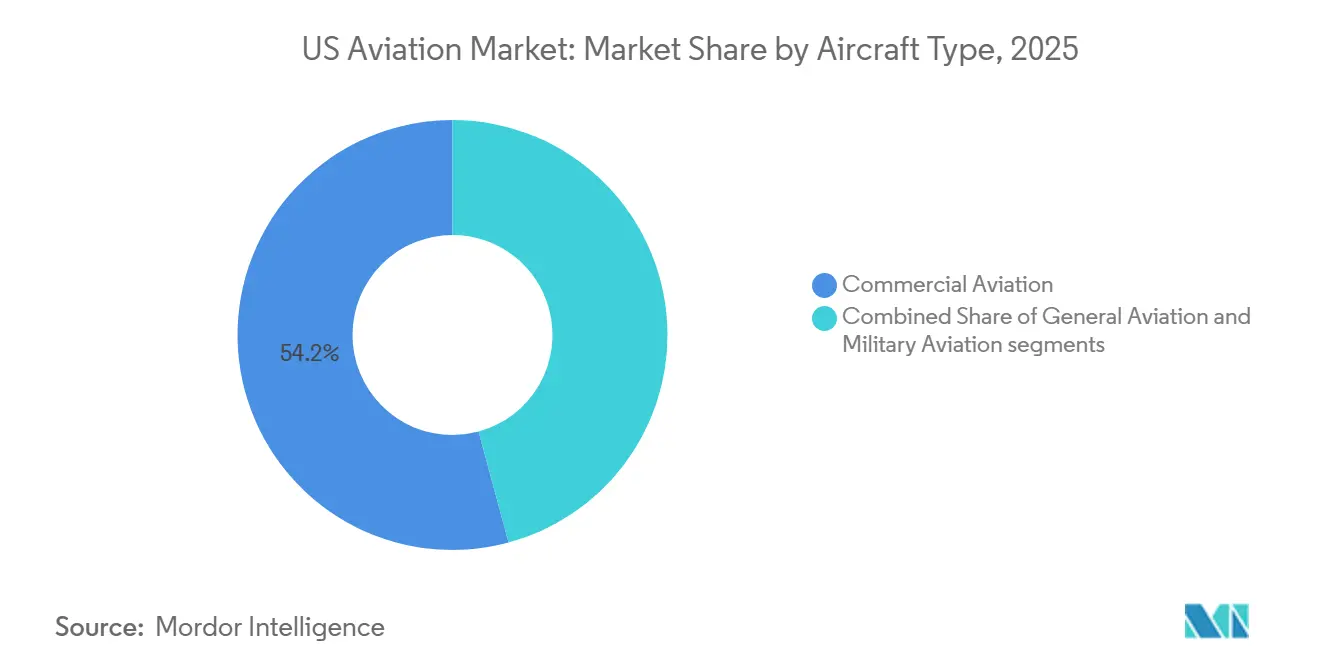
- By aircraft type, commercial aviation led with 54.20% revenue share in 2025, while military aviation recorded the highest projected CAGR at 4.45% through 2031.
- By propulsion technology, turbofan engines held a 55.10% share of the US aviation market in 2025, while turboshaft systems are projected to expand at a 4.32% CAGR through 2031.
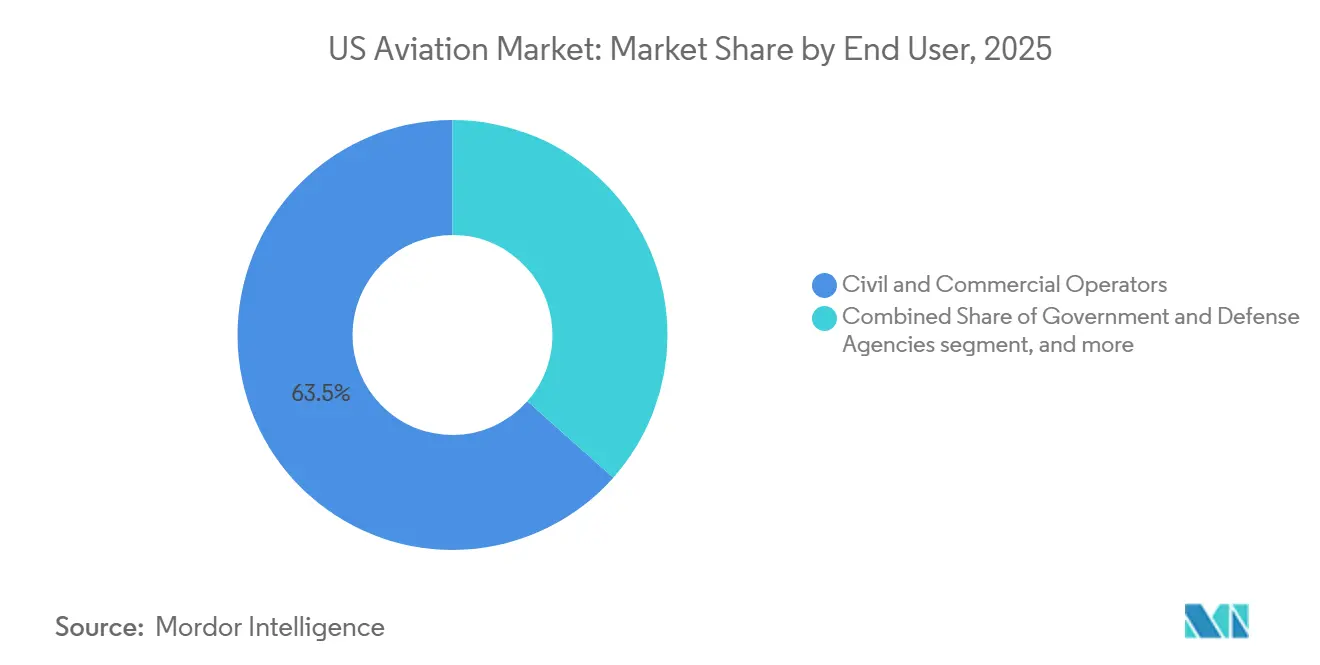
- By end user, civil and commercial operators accounted for 63.45% in 2025, while government and defense agencies are projected to grow at a 4.55% CAGR through 2031.
Note: Market size and forecast figures in this report are generated using Mordor Intelligence’s proprietary estimation framework, updated with the latest available data and insights as of 2026.
US Aviation Market Trends and Insights
Drivers Impact Analysis*
| Driver | (~) % Impact on CAGR Forecast | Geographic Relevance | Impact Timeline |
|---|---|---|---|
| Recovery in domestic passenger traffic | +0.8% | National, with concentration in hub cities | Short term (≤ 2 years) |
| Continued growth of e-commerce boosting air cargo demand | +0.5% | National, spill-over to cross-border Mexico/Canada routes | Medium term (2-4 years) |
| Sustained DoD outlays for next-generation combat and support aircraft | +1.2% | National, with manufacturing concentration in Texas, California, South Carolina | Long term (≥ 4 years) |
| FAA Innovate 2028 digital tower rollout accelerating regional airport upgrades | +0.3% | National, prioritizing small and rural communities and non-towered airports | Short term (≤ 2 years) |
| Airline fleet renewal programs favoring fuel-efficient models | +0.9% | National, early gains in Atlanta, Chicago | Medium term (2-4 years) |
| Venture capital funding surge for electric short-haul aircraft creating new OEM revenue pools | +0.2% | Regional, concentrated in California, Texas, Florida | Long term (≥ 4 years) |
| Source: Mordor Intelligence | |||


Recovery in Domestic Passenger Traffic
TSA checkpoints processed an average daily volume of nearly 2.4 million passengers in February 2026, including a mid-month peak of 2.7 million, indicating resilient leisure demand even as the business travel recovery remains uneven across hubs and corporate-heavy routes.[1]Transportation Security Administration, “TSA Checkpoint Travel Numbers,” Transportation Security Administration, tsa.gov In October 2025, passenger activity reached a new monthly high, yet domestic load factors softened as carriers paced growth against certification and delivery schedules that constrained near-term capacity additions. FAA’s long-term forecast projects steady mainline enplanement gains over the next decade, while the regional segment adjusts to pilot supply and economic factors that favor larger-gauge aircraft in many domestic markets. The US aviation market remains supply-bound rather than demand-limited in the near term, given that network carriers continue to hold firm on core schedules while deferring some planned fleet retirements until delivery cadence stabilizes. Strategic orders from major airlines signal confidence that underlying demand will meet capacity once production normalizes and infrastructure upgrades reduce bottlenecks at constrained airports.
Continued Growth of E-Commerce Boosting Air-Cargo Demand
Global air cargo volumes increased in 2025, but performance across regions diverged as North American flows adjusted to policy changes and the return of belly cargo in intercontinental markets. Domestic air freight revenue ton-miles gained traction on last-mile parcel density and healthcare logistics, while the reopening of passenger widebody networks compressed freighter yields on certain lanes. The market benefits from sustained e-commerce growth, which increases throughput at integrator hubs and secondary cargo airports. Still, network design is evolving as trade and customs regimes influence route choices and staging. Leading integrators continue to tune fleet plans and facility investments to align with parcel cycles, while reallocating capacity between freighters and belly cargo supports a flexible response to peak traffic windows. Over the forecast period, cargo growth remains additive to passenger networks, though its contribution to overall revenue will vary by carrier mix, product composition, and cross-border policy setting.
Sustained DoD Outlays for Next-Generation Combat and Support Aircraft
The Department of the Air Force's FY2026 request of USD 249.5 billion sustains a pivot toward capability depth, emphasizing sustainment and modernization of existing fleets while advancing developmental programs.[2]Office of the Assistant Secretary of the Air Force for Financial Management and Comptroller, “Air Force President’s Budget FY26,” U.S. Air Force, saffm.hq.af.mil This mix shapes predictable demand for mission systems, MRO, and training, stabilizing supplier revenue across avionics, propulsion, and structural components in the medium term. The F-35 enterprise continues to evolve through multi-lot awards that expand the global installed base and embed incremental software and sensor upgrades, thereby increasing sustainment complexity and value capture for OEMs and partners. Early production ramp and testing milestones on the long-range bomber program and related infrastructure modernization provide visibility into assembly system investments and digital manufacturing methods that can be transferred to other aeronautics lines. Combined, these priorities lift the outlook for the US aviation market by supporting industrial base utilization, tooling continuity, and a defensible order book insulated from short-cycle commercial swings.
FAA “Innovate 2028” Digital Tower Rollout Accelerating Regional Airport Upgrades
The FAA’s nationwide modernization replaces legacy analog infrastructure with IP-based communications and surveillance across hundreds of sites, with program execution already underway and early installations completed at towers and control facilities. The initiative seeks to reduce equipment-driven delays that have risen above historical averages by accelerating copper-to-fiber conversion, deploying upgraded voice switches, and expanding surface situational awareness in high-traffic environments. Remote and digital tower mandates in the 2024 reauthorization push trials at non-Technical Center locations, which opens upgrade pathways for regional and rural airports that have lacked cost-effective options for continuous staffing. As milestones progress, the program is expected to increase throughput on constrained routes and reduce air and ground delays, improving carrier asset utilization and MRO planning for scheduled maintenance packages. The modernization also enables integration of new entrants over time, including advanced air mobility operations in select corridors, aligning the infrastructure roadmap with evolving traffic composition in the US aviation market.
Restraints Impact Analysis*
| Restraint | (~) % Impact on CAGR Forecast | Geographic Relevance | Impact Timeline |
|---|---|---|---|
| Supply chain bottlenecks for titanium, composites, and avionics | -0.4% | National, hitting all major manufacturing centers | Short term (≤ 2 years) |
| Community-level opposition delaying SAF blending and storage infrastructure | -0.3% | Regional, refining and airport communities | Long term (≥ 4 years) |
| Persistent pilot, airframe, and powerplant mechanic shortages inflating labor costs | -0.5% | National, acute in rural and smaller metro areas | Medium term (2-4 years) |
| Escalating cyber insurance premiums for connected aircraft systems | -0.2% | National, affecting operators of modern connected fleets | Medium term (2-4 years) |
| Source: Mordor Intelligence | |||
Supply Chain Bottlenecks for Titanium, Composites, and Avionics
Backlogs now represent extended production runways, reshaping airline retirement plans and keeping older aircraft in service longer, increasing fuel costs and maintenance exposure while dampening the pace of fleet refresh in the US aviation market. OEMs and engine makers continue to balance quality controls and ramp schedules as certification requirements remain more extensive than in prior cycles, which has extended the time-to-market for specific variants. Tiered suppliers in materials, avionics, and fasteners remain sensitive to one-off disruptions and single-sourcing, heightening risk to delivery plans during a period of elevated demand. Over the medium term, supply resilience depends on capital and workforce readiness at smaller suppliers, where hiring and training pipelines lag retirements and where financing constraints limit surge capacity. These bottlenecks continue to pressure lease rates, yield management, and maintenance turn times, affecting carriers’ schedule reliability and unit economics.
Community-level Opposition Delaying SAF Blending and Storage Infrastructure
Sustainable aviation fuel deployment remains a small fraction of national jet fuel consumption, with near-term adoption shaped by technology pathways, feedstock availability, and logistics that are not yet scaled for broad use.[3]National Renewable Energy Laboratory, “Sustainable Aviation Fuel (SAF) State‑of‑Industry Report: State of SAF Production Process,” National Renewable Energy Laboratory, nrel.gov The 2030 target of multi-billion-gallon output depends on reductions in carbon intensity from production processes and associated transport networks, as well as on dependable tax-credit eligibility that underpins project finance. Carbon capture, utilization, and storage linked to ethanol-to-jet pathways faces community and permitting hurdles in Midwestern states, which introduces uncertainty into siting, construction timing, and long-term offtake agreements. The logistical footprint for SAF blending, storage, and transport remains fragmented, and pipeline restrictions for certain blendstocks shift volumes to road or rail, which adds cost and emissions risk to supply chains. These issues delay the momentum of decarbonization in the US aviation market and complicate planning for airlines seeking predictable emissions reductions tied to fleet and fuel strategies.
*Our forecasts treat driver/restraint impacts as directional, not additive. The impact forecasts reflect baseline growth, mix effects, and variable interactions.
Segment Analysis
By Aircraft Type: Commercial Volume Leads, Defense Growth Outpaces on Modernization
Commercial aviation captured 54.20% of the market share in 2025, and military aviation is projected to grow at the fastest rate with a 4.45% CAGR through 2031. Within commercial fleets, narrowbody aircraft remain central to network plans as carriers invest in fuel-efficient types to improve seat-mile economics and restore capacity with reliability. Delivery schedules and certification timelines have led operators to extend aircraft life, raising maintenance exposure and keeping lease markets tight across popular variants in the US aviation market. Airlines with strong balance sheets placed strategic orders to secure multi-year delivery positions, which helps de-risk replacement cycles once production stabilizes.
Defense demand anchors growth for the fastest-rising segment as procurement and sustainment funding levels prioritize fifth-generation fleets and next-generation platforms. The F-35 enterprise continues to scale across US services and partner nations through multi-lot awards that underpin system upgrades and maintain a deep industrial footprint. General aviation sustained healthy large-cabin and midsize jet deliveries in 2025, supported by corporate and high-net-worth demand and strengthened by OEM product refresh initiatives and avionics upgrades. These dynamics set a balanced foundation for the market as commercial carriers optimize gauge and schedule integrity, and defense programs stabilize supplier utilization with longer-horizon commitments.


By Propulsion Technology: Turbofans Dominate Installed Base, Turboshafts Climb on Rotorcraft Programs
Turbofan engines secured 55.1% of the market share by propulsion in 2025, reflecting the central role of efficient narrowbody and widebody platforms in carrier economics. Engine delivery pacing and shop visit schedules remain critical variables for fleet availability, which places a premium on risk sharing with OEMs and lessors to maintain day-to-day dispatch reliability in the US aviation market. Turboprops maintain a durable presence on short-haul and special-mission routes, though pilot supply and gauge economics temper large-scale fleet expansion.
Turboshaft engines are set to expand at a 4.32% CAGR as rotorcraft programs benefit from defense modernization and stable commercial niches, aided by advances in avionics and mission equipment. Bell’s military portfolio posted strong growth in 2025, supporting the supply chain outlook for engines, transmissions, and composite structures in this category. Emerging electric, hybrid-electric, and hydrogen-electric systems are building test experience and orders in early-stage applications, with industry pilots targeting regional routes, short-haul cargo, and special missions that can benefit from lower emissions and simplified maintenance. The US aviation market will see gradual integration of these alternatives as certification pathways, infrastructure, and energy supply chains mature in parallel with OEM development roadmaps.
By End User: Civil and Commercial Operators Drive Volume, Government Agencies Lead Growth
Civil and commercial operators held a 63.45% share of the market in 2025, comprising network carriers, cargo integrators, regionals, and business aviation providers that together set the demand tone for OEMs and MROs. Near-term plans emphasize efficiency and reliability over raw capacity growth, given aircraft availability and engine shop capacity, which keeps schedule discipline tight across hubs and focus cities in the US aviation market. Business aviation demand remained firm in 2025 with new model milestones and deliveries across light, midsize, and large-cabin segments, supported by backlogs and service programs.
Government and defense agencies are the fastest-growing end-user, projected to expand at a 4.55% CAGR, driven by sustained procurement and robust sustainment priorities that extend through the planning horizon. Multi-year awards across fighter, bomber, and mobility fleets, combined with software and sensor upgrade cycles, create recurring demand for airframes, engines, and mission systems. The F-35 enterprise remains a cornerstone, with multi-lot procurement and a growing global installed base that deepens training, logistics, and depot workloads across the value chain, supporting capacity utilization for US-based suppliers. Together, these demand profiles keep the US aviation market anchored by large civil operators while government users lift growth at the margins through multi-decade platform commitments.
Geography Analysis
Hub concentration remains a key characteristic, with the largest US airports influencing throughput, resource allocation, and air traffic flow management across regions. Systemwide passenger numbers in late 2025 indicated increased volumes, with hubs accounting for a significant share of national enplanements. This concentration continues to impact network planning in the US aviation market. Atlanta was one of the busiest airports in the US in 2025, with other major carrier hubs such as Dallas-Fort Worth, Chicago, Denver, and Los Angeles also recording high volumes, supported by strong domestic and international connectivity. Elevated TSA throughput in early 2026 confirms resilient leisure travel, with strong peaks around holidays and major events, while business travel patterns are still stabilizing by city pair. This demand maps onto a constrained supply backdrop, reinforcing the importance of airport operations modernization and schedule predictability for the US aviation market.
The FAA’s air traffic control modernization allocates resources across towers, TRACONs, and centers, including weather and surface systems that are especially critical in regions with complex terrain and climates. Remote and digital tower mandates and trials expand options for smaller airports to secure improved services, which can stimulate regional connectivity and general aviation activity that feeds larger networks. Progress on early deployments and conversions in 2025 and 2026 provides a base to scale installations through 2028, subject to appropriations and project execution. As these upgrades reduce equipment-driven delays and enhance surface movement guidance, carriers can tighten rotation buffers and fuel planning, which supports unit cost improvements in the market.
International and cargo flows add geographic nuance to the recovery and growth mix. The global association expects Europe to post higher 2026 profits than North America, which underscores differences in market structure, currency, and regulation that influence route economics and pricing power. Global air cargo posted gains in 2025 while North American lanes adjusted to policy and capacity changes that altered modal and routing choices, with integrators and belly operators rebalancing networks. The US aviation market continues to benefit from large coastal gateways for long-haul traffic and interior hubs that connect multi-directional flow. At the same time, the cargo sector blends domestic last-mile density with international stage length optimization. Over the forecast horizon, replacement-driven fleet plans, airspace modernization, and selective infrastructure expansions will be the primary levers for enhancing capacity across the national geography.
Competitive Landscape
The US aviation market blends moderate concentration across OEM segments with fragmented operator and service layers. On the manufacturing side, large civil and defense primes hold multi-year backlogs that shape supply schedules and investment pacing for global and domestic supplier networks. Airlines deploy capacity carefully to protect yields while they secure future delivery positions through orders and options that hedge certification and production timing. In business aviation, multiple OEMs advanced new models and service enhancements through 2025 and into 2026, evidenced by first deliveries, certifications, and segment-leading volumes reported by manufacturers. These moves stabilize the broader ecosystem of avionics, interiors, completions, and MRO providers serving corporate fleets in the US aviation market.
Strategic programs and policy continue to steer competition and collaboration. The F-35 enterprise advanced with multi-lot awards covering US services, partners, and foreign military sales, which underpins both production and sustainment ramps for the long term. FAA’s nationwide modernization unlocks contracting opportunities across communications, navigation, surveillance, and decision-support layers, with early progress suggesting reductions in equipment-related delays and enhanced integration of new entrants over time. The US aviation market, therefore, sits at the intersection of long-cycle platforms, mid-cycle upgrades, and near-term operational improvements that together influence cost, reliability, and capacity.
New propulsion and AAM initiatives add optionality to future fleets and missions. Hydrogen-electric programs secured funding to industrialize fuel cell stacks for small regional aircraft and defense UAV applications, signaling cross-over potential where endurance and emissions profiles are strategic differentiators. Business and general aviation OEMs report continued delivery strength and a portfolio refresh, underpinned by avionics upgrades and type certifications that improve pilot workload and operational safety, thereby enhancing the installed-base economics for flight departments and fractional operators in the US aviation market. Meanwhile, long-term demand projections emphasize that North America’s needs will be dominated by replacement, which guides the competitive focus toward reliability, fuel efficiency, and cabin experience rather than raw capacity expansion.
US Aviation Industry Leaders
Lockheed Martin Corporation
The Boeing Company
General Dynamics Corporation
Airbus SE
Textron Inc.
- *Disclaimer: Major Players sorted in no particular order


Recent Industry Developments
- January 2026: Boeing was awarded a contract to produce four additional MH-139A Grey Wolf helicopters for the US Air Force, following a USD 173 million contract. With a total contract value exceeding USD 262 million and 38 aircraft now under contract, this development emphasizes Boeing's critical role in supporting military modernization.
- October 2025: The Boeing Company secured a deal valued at more than USD 173 million to manufacture 8 additional MH-139A Grey Wolf helicopters for the US Air Force.
- September 2025: Lockheed Martin Corporation and the F-35 Joint Program Office (JPO) finalized an agreement for lots 18-19, covering the production and delivery of up to 296 F-35 aircraft for US services, international partners, and Foreign Military Sales (FMS) customers. Deliveries are scheduled to begin in 2026.


US Aviation Market Report Scope
The US aviation market encompasses the sales of fixed-wing and rotary-wing aircraft within the region's commercial, military, and general aviation sectors. It provides an analysis of air passenger traffic, aircraft orders and deliveries, defense expenditures, the introduction of new routes, and country-specific investments in the aviation industry.
The US aviation market is segmented by aircraft type, propulsion technology, and end-user. By aircraft type, the market is segmented into commercial aviation, military aviation, and general aviation. By propulsion technology, the market is segmented into turboprop, turbofan, piston engine, turboshaft, and others. By end user, the market is segmented into civil and commercial operators, government and defense agencies, and business and general aviation owners. The report also covers the market sizes and forecasts for the US aviation market. The market size and forecast for each segment are provided in terms of value (USD).
By Aircraft Type
| Commercial Aviation | Passenger Aircraft | Narrowbody Aircraft |
| Widebody Aircraft | ||
| Regional Jets | ||
| General Aviation | Business Jets | Large Jet |
| Mid-Size Jet | ||
| Light Jet | ||
| Piston and Turboprop Aircraft | ||
| Commercial Helicopters | ||
| Military Aviation | Fixed-Wing Aircraft | Combat Aircraft |
| Multi-Role Aircraft | ||
| Transport Aircraft | ||
| Training Aircraft | ||
| Rotorcraft | Multi-Mission Helicopter | |
| Transport Helicopter | ||
| Others | ||
By Propulsion Technology
| Turboprop |
| Turbofan |
| Piston Engine |
| Turboshaft |
| Others |
By End User
| Civil and Commercial Operators |
| Government and Defense Agencies |
| Business and General Aviation Owners |
| By Aircraft Type | Commercial Aviation | Passenger Aircraft | Narrowbody Aircraft |
| Widebody Aircraft | |||
| Regional Jets | |||
| General Aviation | Business Jets | Large Jet | |
| Mid-Size Jet | |||
| Light Jet | |||
| Piston and Turboprop Aircraft | |||
| Commercial Helicopters | |||
| Military Aviation | Fixed-Wing Aircraft | Combat Aircraft | |
| Multi-Role Aircraft | |||
| Transport Aircraft | |||
| Training Aircraft | |||
| Rotorcraft | Multi-Mission Helicopter | ||
| Transport Helicopter | |||
| Others | |||
| By Propulsion Technology | Turboprop | ||
| Turbofan | |||
| Piston Engine | |||
| Turboshaft | |||
| Others | |||
| By End User | Civil and Commercial Operators | ||
| Government and Defense Agencies | |||
| Business and General Aviation Owners | |||


Market Definition
- Aircraft Type - All the aircraft related to commercial, military and general aviation have been included in this study
- Sub-Aircraft Type - Fixed-Wing passenger aircraft, freighter aircraft, business jets, piston fixed-wing aircraft, military fixed-wing aircraft, and rotorcraft are included under this study.
- Body Type - Body type includes all types of aircraft segmented based on application/size/capacity/role.
| Keyword | Definition |
|---|---|
| IATA | IATA stands for the International Air Transport Association, a trade organization composed of airlines around the world that has an influence over the commercial aspects of flight. |
| ICAO | ICAO stands for International Civil Aviation Organization, a specialized agency of the United Nations that supports aviation and navigation around the globe. |
| Air Operator Certificate (AOC) | A certificate granted by a National Aviation Authority permitting the conduct of commercial flying activities. |
| Certificate Of Airworthiness (CoA) | A Certificate Of Airworthiness (CoA) is issued for an aircraft by the civil aviation authority in the state in which the aircraft is registered. |
| Gross Domestic Product (GDP) | Gross domestic product (GDP) is a monetary measure of the market value of all the final goods and services produced in a specific time period by countries. |
| RPK (Revenue Passenger Kilometres) | The RPK of an airline is the sum of the products obtained by multiplying the number of revenue passengers carried on each flight stage by the stage distance - it is the total number of kilometers traveled by all revenue passengers. |
| Load Factor | The load factor is a metric used in the airline industry that measures the percentage of available seating capacity that has been filled with passengers. |
| Original Equipment Manufacturer (OEM) | An original equipment manufacturer (OEM) traditionally is defined as a company whose goods are used as components in the products of another company, which then sells the finished item to users. |
| International Transportation Safety Association (ITSA) | International Transportation Safety Association (ITSA) is an international network of heads of independent safety investigation authorities (SIA). |
| Available Seats Kilometre (ASK) | This metric is calculated by multiplying Available Seats (AS) in one flight, defined above, multiplied by the distance flown. |
| Gross Weight | The fully-loaded weight of an aircraft, also known as “takeoff weight,” which includes the combined weight of passengers, cargo, and fuel. |
| Airworthiness | The ability of an aircraft, or other airborne equipment or system, to operate in flight and on the ground without significant hazard to aircrew, ground crew, passengers or to other third parties. |
| Airworthiness Standards | Detailed and comprehensive design and safety criteria applicable to the category of aeronautical product (aircraft, engine or propeller). |
| Fixed Base Operator (FBO) | A business or organization that operates at an airport. An FBO provides aircraft operating services like maintenance, fueling, flight training, charter services, hangaring, and parking. |
| High Net worth Individuals (HNWIs) | High Net worth Individuals (HNWIs) are individuals with over USD 1 million in liquid financial assets. |
| Ultra High Net worth Individuals (UHNWIs) | Ultra High Net worth Individuals (UHNWIs) are individuals with over USD 30 million in liquid financial assets. |
| Federal Aviation Administration (FAA) | The division of the Department of Transportation is concerned with aviation. It operates Air Traffic Control and regulates everything from aircraft manufacturing to pilot training to airport operations in the United States. |
| EASA (European Aviation Safety Agency) | The European Aviation Safety Agency is a European Union agency established in 2002 with the task of overseeing civil aviation safety and regulation. |
| Airborne Warning and Control System (AW&C) aircraft | Airborne Warning and Control System (AEW&C) aircraft is equipped with a powerful radar and on-board command and control center to direct the armed forces. |
| The North Atlantic Treaty Organization (NATO) | The North Atlantic Treaty Organization (NATO), also called the North Atlantic Alliance, is an intergovernmental military alliance between 30 member states – 28 European and two North American. |
| Joint Strike Fighter (JSF) | Joint Strike Fighter (JSF) is a development and acquisition program intended to replace a wide range of existing fighter, strike, and ground attack aircraft for the United States, the United Kingdom, Italy, Canada, Australia, the Netherlands, Denmark, Norway, and formerly Turkey. |
| Light Combat Aircraft (LCA) | A light combat aircraft (LCA) is a light, multirole jet/turboprop military aircraft, commonly derived from advanced trainer designs, designed for engaging in light combat. |
| Stockholm International Peace Research Institute (SIPRI) | Stockholm International Peace Research Institute (SIPRI) is an international institute that provides data, analysis, and recommendations for armed conflict, military expenditure, and arms trade as well as disarmament and arms control. |
| Maritime Patrol Aircraft (MPA) | A maritime patrol aircraft (MPA), also known as maritime reconnaissance aircraft is a fixed-wing aircraft designed to operate for long durations over water in maritime patrol roles, in particular, anti-submarine warfare (ASW), anti-ship warfare (AShW), and search and rescue (SAR). |
| Mach Number | The Mach number is defined as the ratio of true airspeed to the speed of sound at the altitude of a given aircraft. |
| Stealth Aircraft | Stealth is a Common term applied to low observable (LO) technology and doctrine, that makes an aircraft near invisible to radar, infrared or visual detection. |


Research Methodology
Mordor Intelligence follows a four-step methodology in all our reports.
- Step-1: Identify Key Variables: In order to build a robust forecasting methodology, the variables and factors identified in Step-1 are tested against available historical market numbers. Through an iterative process, the variables required for market forecast are set and the model is built on the basis of these variables.
- Step-2: Build a Market Model: Market-size estimations for the historical and forecast years have been provided in revenue and volume terms. For sales conversion to volume, the average selling price (ASP) is kept constant throughout the forecast period for each country, and inflation is not a part of the pricing.
- Step-3: Validate and Finalize: In this important step, all market numbers, variables and analyst calls are validated through an extensive network of primary research experts from the market studied. The respondents are selected across levels and functions to generate a holistic picture of the market studied.
- Step-4: Research Outputs: Syndicated Reports, Custom Consulting Assignments, Databases & Subscription Platforms


