Commercial Aircraft Market Size and Share
Market Overview
| Study Period | 2019 - 2031 |
|---|---|
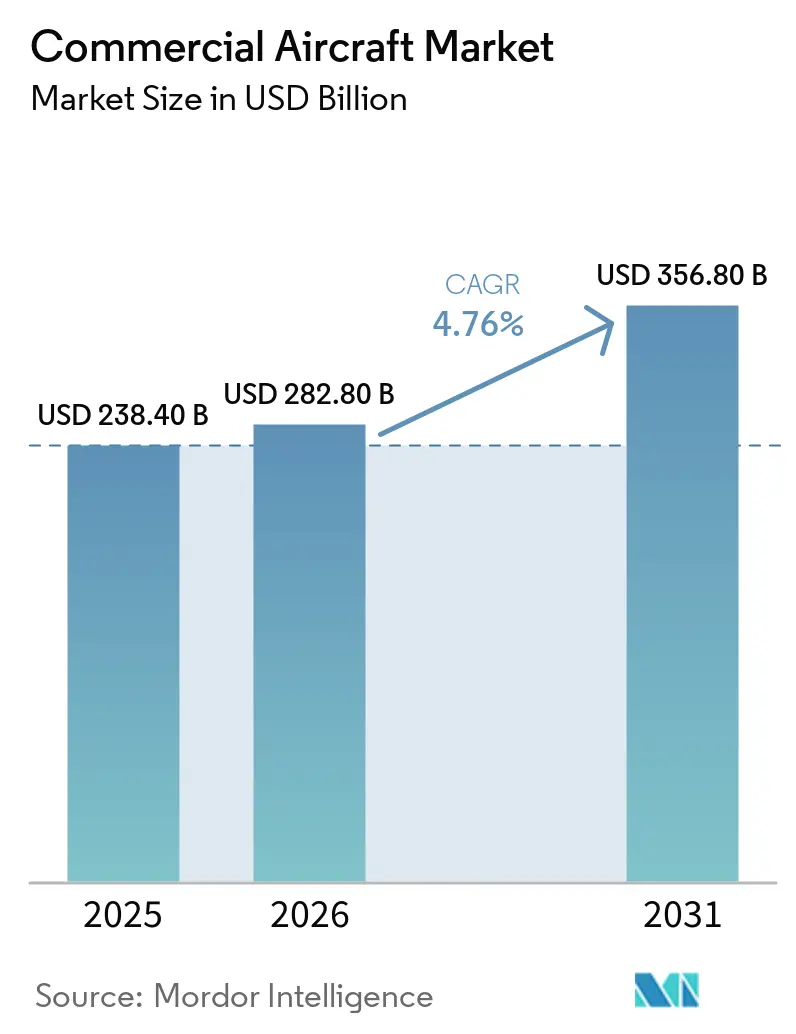
| Market Size (2026) | USD 282.80 Billion |
| Market Size (2031) | USD 356.80 Billion |
| Growth Rate (2026 - 2031) | 4.76% CAGR |
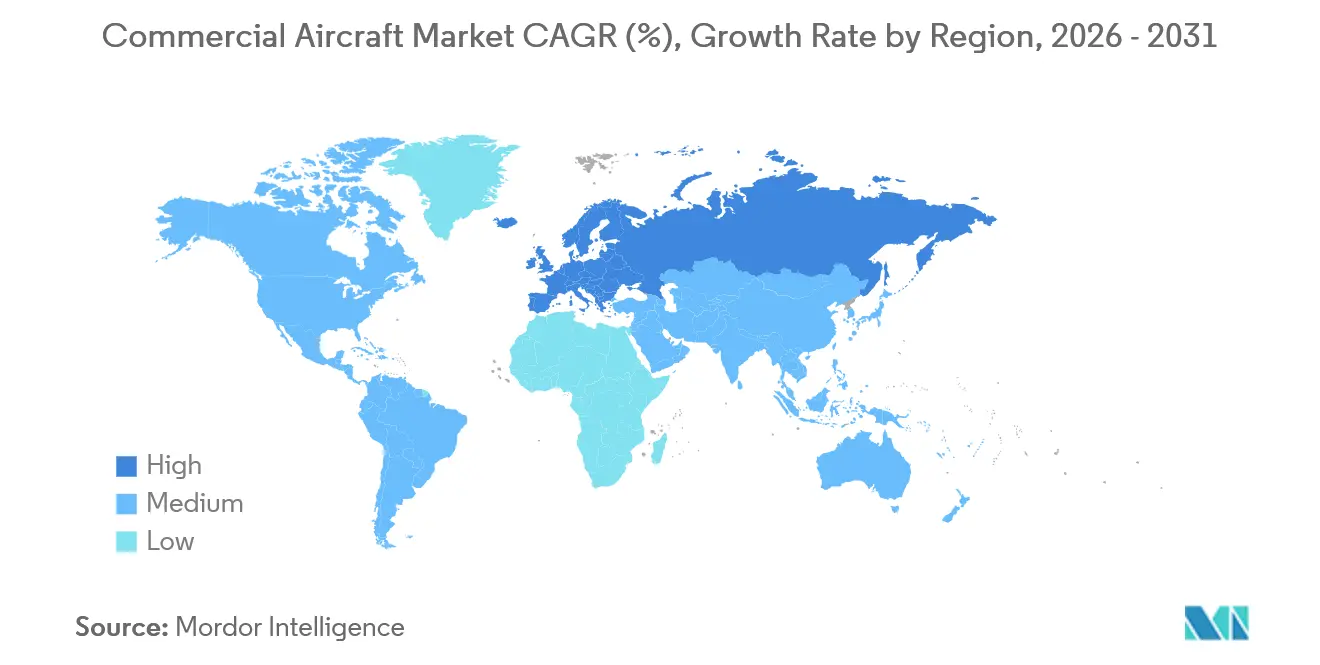
| Fastest Growing Market | Europe |
| Largest Market | Asia-Pacific |
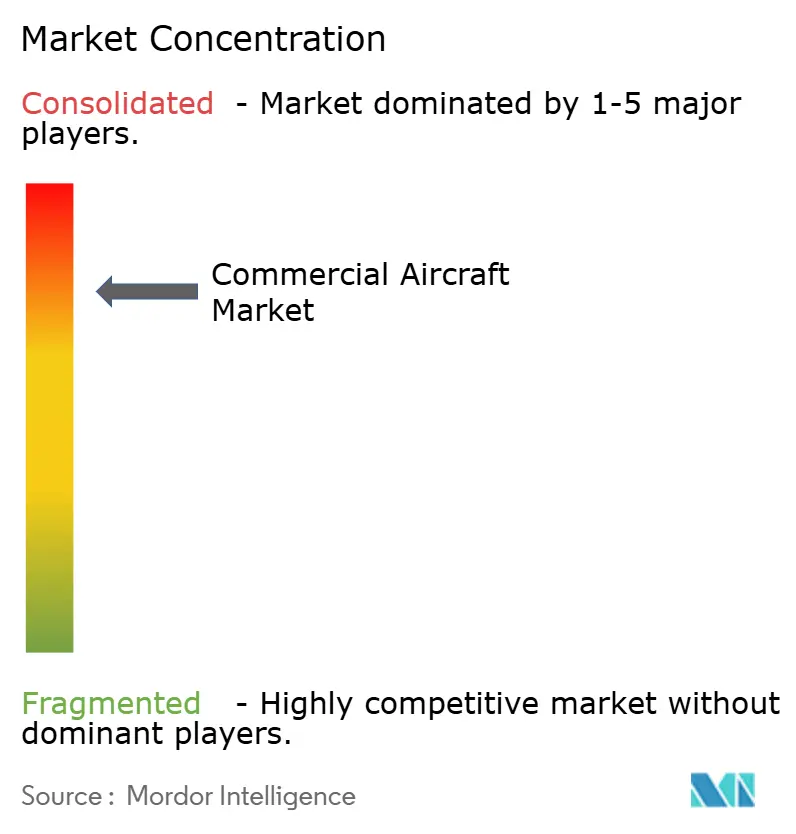
| Market Concentration | High |
Major Players *Disclaimer: Major Players sorted in no particular order Image © Mordor Intelligence. Reuse requires attribution under CC BY 4.0. | |
Commercial Aircraft Market Analysis by Mordor Intelligence
The commercial aircraft market size is expected to grow from USD 238.4 billion in 2025 to USD 282.8 billion in 2026 and is forecasted to reach USD 356.8 billion by 2031 at a 4.76% CAGR over 2026-2031. Momentum stems from airlines phasing out older jets to curb fuel burn, regulators tightening carbon rules that favor next-generation powerplants, and low-cost carriers (LCCs) using single-aisle capacity to open secondary airports at lower slot fees. Supply-chain kinks in castings and composites limit near-term deliveries, yet backlogs exceeding 12,000 units provide original equipment manufacturers (OEMs) with multi-year revenue visibility. Aftermarket revenue is rising faster than unit sales as power-by-the-hour service contracts convert one-time engine sales into recurring cash flows. Geopolitical export-control frictions have kept 500 Western-built jets stranded in Russia, creating a white-space demand for regional producers that can avoid sanctions while still offering competitive seat-mile economics.
Key Report Takeaways
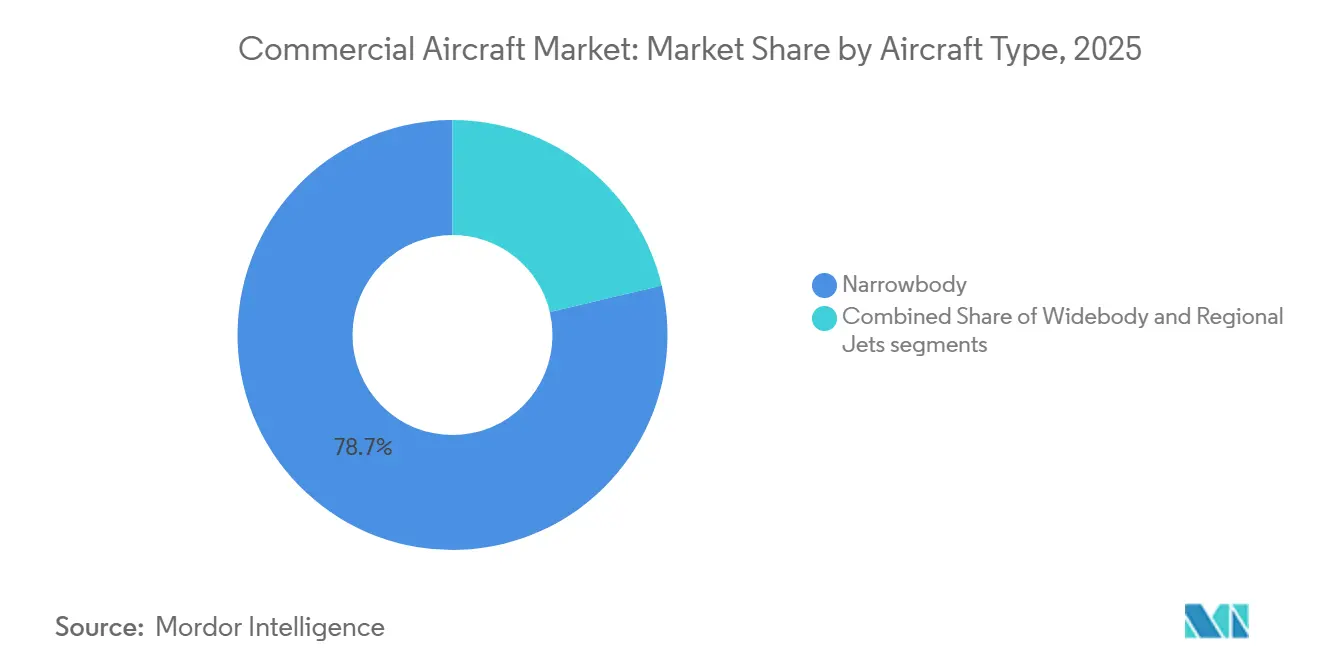
- By aircraft type, narrowbody jets captured 78.69% revenue share in 2025; the segment is projected to expand at a 5.98% CAGR through 2031.
- By application, passenger operations held a 95.55% share of the commercial aircraft market size in 2025 and are set to grow at a 5.55% CAGR to 2031, reflecting the belly-cargo revenue advantage over dedicated freighters.
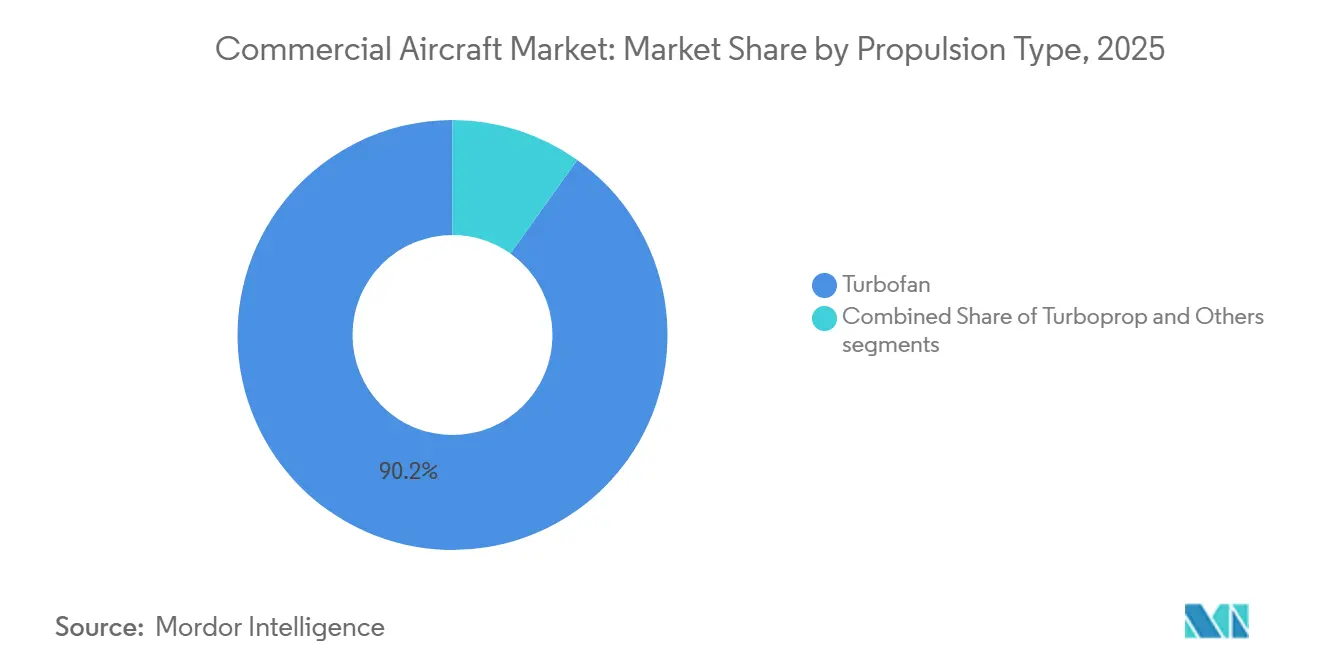
- By propulsion type, turbofan engines commanded 90.15% of the commercial aircraft market share in 2025, while turboprops are forecast to advance at a 5.12% CAGR between 2026 and 2031 on sub-500-kilometer routes.
- By component, airframe structures contributed 30.22% of 2025 revenue, whereas avionics and flight-control systems are on track for the fastest 6.01% CAGR through 2031.
- By geography, the Asia-Pacific region accounted for 32.75% of the 2025 value, led by China and India, while Europe is expected to record the fastest CAGR of 5.81% through 2031.
Note: Market size and forecast figures in this report are generated using Mordor Intelligence’s proprietary estimation framework, updated with the latest available data and insights as of January 2026.
Global Commercial Aircraft Market Trends and Insights
Drivers Impact Analysis*
| Driver | (≈) % Impact on CAGR Forecast | Geographic Relevance | Impact Timeline |
|---|---|---|---|
| Fleet-modernization push for fuel-efficient single-aisle jets | +1.80% | Global, concentrated in North America, Europe, Asia-Pacific | Medium term (2-4 years) |
| Accelerating post-COVID passenger-traffic rebound in emerging markets | +1.50% | Asia-Pacific core, spill-over to Middle East and Africa | Short term (≤ 2 years) |
| Low-cost-carrier (LCC) route expansion into secondary airports | +1.20% | Europe, Asia-Pacific, Latin America | Medium term (2-4 years) |
| Sustainable-aviation-fuel (SAF) blending mandates influencing OEM roadmaps | +0.90% | Europe and North America, gradual adoption in Asia-Pacific | Long term (≥ 4 years) |
| Bundled “power-by-the-hour” service contracts tied to OEM airframes | +0.70% | Global, led by North America and Europe | Medium term (2-4 years) |
| Urban air-mobility (UAM) corridor funding spurring demand for high-cycle turboprops | +0.40% | Asia-Pacific, Middle East, select African corridors | Long term (≥ 4 years) |
| Source: Mordor Intelligence | |||


Fleet-Modernization Push for Fuel-Efficient Single-Aisle Jets
Airlines are retiring 20-year-old narrowbody aircraft at an accelerated pace, as the A320neo and B737 MAX models offer approximately 20% lower fuel consumption per seat, significantly enhancing operating efficiency.[1]Airbus, “A320neo Fuel Burn,” airbus.com Delta ordered 100 B737 MAX jets in April 2025 to replace its aging MD-88s, whose maintenance costs had exceeded lease rates for new aircraft. Airbus plans to increase A320-family output to 75 units per month by 2027, citing a backlog exceeding 7,000 frames that ensures line visibility. Engine makers reap parallel gains: CFM’s LEAP and Pratt & Whitney’s geared turbofan secure multi-decade service contracts tied to these airframes. The shift crowds regional-jet niches, pushing operators to up-gauge from 76-seat Embraer E175s to 150-seat narrowbodies that offer lower per-seat costs.
Accelerating Post-COVID Passenger-Traffic Rebound in Emerging Markets
International borders reopened across Asia-Pacific by late 2023, unleashing pent-up demand that lifted regional revenue passenger kilometers (RPKs) by 5% year over year in 2025. Chinese airlines booked 292 A320neo-family jets in a single transaction in 2024, signaling confidence that domestic travel can absorb capacity as high-speed rail reaches saturation. India’s IndiGo flew 113 million passengers in 2024 and targets a 600-strong fleet by 2030, including A321XLRs that open nonstop Delhi-to-European city pairs. Middle Eastern hubs such as Dubai and Doha regained sixth-freedom traffic, posting a 5.4% CAGR through 2028, as visa-on-arrival schemes stimulate transfers. While macro risks persist, the demand surge underpins the commercial aircraft market by shortening payback periods on new jets.
Low-Cost-Carrier Route Expansion into Secondary Airports
Ryanair achieved a milestone by boarding 21 million passengers in August 2025 and has expanded its presence at secondary airports by establishing bases in Bratislava, addressing underserved Eastern European travel demand. The airline plans to operate a record 33 routes from Bratislava in summer 2026, including 10 new destinations, coinciding with two decades of operations at the airport and the addition of a third-based aircraft in late 2025. Wizz Air maintains a 60.6% share of Italy's low-cost seat capacity, supported by its extensive network of secondary airports. Meanwhile, IndiGo now serves 50 international destinations from tier-2 Indian cities, leveraging sub-30-minute turnaround times to achieve daily aircraft utilization of approximately 12 hours. These developments collectively drive demand for high-cycle single-aisle aircraft, sustain the commercial aircraft market's focus on narrowbody production, and alleviate slot constraints at congested primary hubs such as Heathrow and Frankfurt.
Sustainable-Aviation-Fuel Blending Mandates Influencing OEM Roadmaps
The European Union’s ReFuelEU regulation stipulates a 2% sustainable aviation fuel (SAF) blend in 2025, rising to 70% by 2050, with a synthetic fuel sub-target of 35%. Current output accounts for less than 0.1% of EU jet fuel demand, implying a supply ramp of 40-plus times by 2030. Korean Air began 1% SAF trials on Japan routes in 2025, absorbing fuel costs that are up to three times higher than those of conventional kerosene. Engine makers are reacting: Rolls-Royce’s UltraFan demonstrator and CFM’s RISE concept are being validated for 100% SAF or hydrogen derivatives beyond 2035. Early movers Lufthansa and Air France-KLM are locking in refinery supply agreements that could yield a long-term cost edge once regulatory mandates tighten.
Restraints Impact Analysis*
| Restraint | (≈) % Impact on CAGR Forecast | Geographic Relevance | Impact Timeline |
|---|---|---|---|
| Engine-casting and composite supply-chain bottlenecks | −1.3% | Global, acute in North America and Europe | Short term (≤ 2 years) |
| Airline profit cyclicality and high financing costs | −0.9% | Global, with heightened pressure in emerging markets | Medium term (2-4 years) |
| Certification delays from next-gen software compliance rules | −0.6% | North America and Europe (FAA, EASA) | Medium term (2-4 years) |
| Export-control tensions restricting deliveries to sanctioned nations | −0.5% | Russia, China, select Middle-Eastern markets | Long term (≥ 4 years) |
| Source: Mordor Intelligence | |||
Engine-Casting and Composite Supply-Chain Bottlenecks
Powder-metal contamination led to inspections of Pratt & Whitney geared-turbofan disks, resulting in the grounding of approximately 600 A320neos at their peak, and causing narrowbody lease rates to increase by 15% in 2024.[2]RTX Corporation, “Pratt & Whitney 10-K 2024,” rtx.com Due to workforce shortages, Spirit AeroSystems experienced delays in fuselage deliveries, affecting both Boeing and Airbus. Additionally, a shortage of carbon-fiber resin, a challenge also faced by the automotive and wind energy sectors, hindered the production of composite wings. This setback has pushed Airbus's target of producing 75 narrowbody aircraft per month to late 2027. As a result of these delivery shortfalls, a backlog has formed: while airlines placed orders for 2,100 narrowbody aircraft in 2024, they only took delivery of 1,350.
Airline Profit Cyclicality and High Financing Costs
US benchmark rates remained above 5% in 2024, widening lease spreads by 200 basis points compared to 2021 and compressing the return on invested capital for carriers with floating debt. Fuel-hedge losses have hit airlines that locked in Brent at or above USD 90 per barrel before the crude price slid to the mid-70s, prompting deferrals of scheduled deliveries. Operating leases now finance 55% of narrowbody arrivals, up from 45% in 2019, as carriers seek balance-sheet flexibility. Cyclicality discourages long-horizon fleet planning and can stall orders during macro shocks.
*Our forecasts treat driver/restraint impacts as directional, not additive. The impact forecasts reflect baseline growth, mix effects, and variable interactions.
Segment Analysis
By Aircraft Type: Narrowbody Dominance Reinforced by LCC Growth
Narrowbodies accounted for the largest commercial aircraft market share, representing 78.69% of 2025 deliveries, and are expected to extend their lead at a 5.98% CAGR through 2031. Production lines are calibrated to meet this demand: Airbus delivered 650 A320-family units in 2025 and targets a monthly output of 75 by 2027, while Boeing plans to produce 38 B737 MAX units per month by late 2026, once fuselage delays are resolved. Widebodies fill long-haul niches but face slower 4% replacement demand because airlines can prolong the lifecycles of B787s or A350s through comprehensive D-checks. Regional-jet volumes remain modest; US scope clauses cap seats at 76, constraining expansion of sub-100-seat fleets.
Secondary-airport penetration accelerates the narrowbody trend. Ryanair, Wizz Air, and IndiGo collectively hold orders for more than 1,000 A320neos and B737 MAXs, ensuring line stability for the rest of the decade. Widebody order books are lumpier; Emirates’ dual-OEM purchase of 200-plus frames equals nearly a decade of output. Regional jets struggle as airlines upscale to Airbus A220s, which qualify as narrowbodies yet offer regional-jet trip costs, further cementing narrowbody supremacy within the commercial aircraft market.


By Application: Passenger Segment Captures Belly-Cargo Synergies
Passenger services accounted for 95.55% of sectoral revenue in 2025 and are expected to increase at a 5.55% CAGR through 2031. Belly holds on B787s, and A350s haul 20-30 tonnes of freight, often covering 15% of trip cost, which protects route economics when passenger loads soften. Freighter demand persists for integrators like FedEx and UPS, yet many e-commerce parcels now ride inside scheduled passenger aircraft.
Conversion programs extend twin-aisle life. Boeing delivered 28 B767-300 Freighters in 2024, mostly passenger-to-freighter retrofits that add 15 years of revenue for older airframes. New-build B777F and future A350F models attract orders only on high-yield lanes because price tags exceed USD 200 million. Environmental policy may tilt cargo economics as EU carbon taxes loom for dedicated freighters starting in 2027.
By Propulsion Type: Turboprop Resurgence in Regional Corridors
Turbofans held 90.15% of the 2025 value, while turboprops are forecast to have a 5.12% CAGR through 2031, as governments finance short-haul connectivity on runways under 1,200 meters.[3]ATR, “Market Forecast 2025,” atr-aircraft.com An ATR 72-600 burns 40% less fuel per seat than an Embraer E175 on 300-kilometer hops, resulting in an annual savings of USD 800,000 at 2026 fuel prices. De Havilland’s Dash 8-400 relaunch adds capacity for African corridor growth.
Demand for turboprops is increasing due to fleet renewals among operators in Southeast Asia, Latin America, and sub-Saharan Africa, where infrastructure limitations persist as a significant challenge. Although next-generation turbofan technologies, such as Rolls-Royce’s UltraFan, are anticipated to deliver greater efficiency gains after 2030, turbofans are projected to remain central to global commercial aviation. Meanwhile, turboprops are expected to play a growing complementary role in regional markets over the next decade.
By Component: Avionics Surge Driven by Cybersecurity and Automation
Airframe structures accounted for 30.22% of 2025 revenue, reflecting the material intensity of the fuselage, wing, and empennage construction. Yet, avionics and flight-control systems lead growth at a 6.01% CAGR as airlines retrofit their legacy fleets with touchscreen cockpits and satellite-based navigation. Honeywell’s Anthem suite features four 15-inch touchscreens that pave the way for eventual single-pilot operations, a move that could reduce crew costs by 30% once regulators agree.
Regulatory mandates heighten demand. The FAA’s ADS-B rule is expected to result in 12,000 retrofits and USD 2 billion in expenditures by 2025. Cybersecurity add-ons are also growing; EASA now rates onboard network defenses as airworthiness-critical, driving the adoption of intrusion-detection modules. Meanwhile, power-by-the-hour service contracts keep aero-engines profitable long after delivery, balancing slower growth in landing gear and auxiliary power units.
Geography Analysis
The Asia-Pacific region commanded 32.75% of the 2025 commercial aircraft market share, the largest share globally. Yet, its growth pace will moderate as airport infrastructure limitations and pilot shortages curb frequency additions beyond Tier-1 hubs. China Eastern and Air China collectively ordered 292 A320neo-family jets in 2024, underscoring sustained single-aisle demand even as COMAC's C919 remains confined to 15 domestic deliveries due to Western export controls that restrict advanced avionics and semiconductor imports. IndiGo operates 350 aircraft and plans to reach 600 by 2030, leveraging the A321XLR's range to launch nonstop flights from Delhi to London and Mumbai to Paris, capturing premium travelers willing to pay 15% more for direct service.
Europe will post the fastest regional expansion, advancing at a 5.81% CAGR through 2031, driven by demand in Eastern Europe and the Iberian Peninsula, where Ryanair and Wizz Air capitalize on secondary-airport slots that legacy carriers often overlook. Ryanair set a monthly record with 21 million passengers in August 2025 and opened bases in Bratislava and Yerevan, operating 197-seat B737 MAX 8-200s that reduce unit costs to EUR 0.025 per available seat-kilometer, 40% below those of its network competitors. Wizz Air captured 60.6% of Italy's low-cost capacity in summer 2025 by fielding A321neos on Milan–Tirana and Rome–Bucharest flights that average 85% load factors, filling the vacuum left by Alitalia's collapse.
North America retained a sizable position in the 2025 commercial aircraft market, fueled by US narrowbody replacement cycles and Canada's regional build-out. However, future growth is tempered by mature fleets and hub capacity saturation. Delta's 100-unit B737 MAX purchase and United's 110 A321neo commitment highlight the USD 1.5 million annual fuel-cost advantage each new jet offers over 15-year-old predecessors. Mexico's Volaris and VivaAerobus expand their cross-border networks to US secondary cities that legacy carriers never fully restored after 2020, absorbing capacity displaced by pandemic cuts. The Middle East capitalizes on its hub geography; Emirates and Qatar Airways continue to add widebodies, while Riyadh Air targets 30 million passengers by 2030 with 72 Boeing 787-9s under Vision 2030. South America and Africa add turboprops and narrowbodies incrementally; LATAM and GOL field 320 aircraft combined, while Ethiopian Airlines expands intra-African links. However, currency volatility and infrastructure gaps confine both regions to mid-single-digit growth trajectories.

Competitive Landscape
The commercial aircraft market operates as a major duopoly at the large-jet level, with Airbus and Boeing controlling a significant share of deliveries in 2025 and listing backlogs exceeding 12,000 units across all variants of aircraft in production. Airbus delivered 735 aircraft versus Boeing’s 480, exploiting the B737 MAX certification delays and B787 quality holds. The engine supply market is a triopoly, comprising GE Aerospace, Rolls-Royce, and Safran’s CFM joint venture, each enjoying exclusive airframe alignments that secure long-term service revenue.
Regional-jet and turboprop arenas are more fragmented. Embraer and ATR vie for fleets under 150 seats, while De Havilland re-enters with the Dash 8-400. COMAC seeks global traction but remains hemmed in by export-control limits on Western avionics. Competitive strategies hinge on production-rate ramps, with Airbus targeting a 15% uplift over 2025, and on aftermarket dominance, with 60% of engine revenue now deriving from power-by-the-hour contracts.
Technology gaps are narrowing; composite wings, fly-by-wire systems, and touchscreens are now baseline features across new jets. Execution, therefore, differentiates winners. Boeing must clear fuselage-quality bottlenecks at Spirit AeroSystems to hit 38 B737 MAX units per month, whereas Airbus depends on casting suppliers to avoid shortfalls in A320neo family deliveries. OEMs also expand digital service networks, offering predictive maintenance platforms that deepen customer lock-in and reinforce competitive moats within the commercial aircraft market.
Commercial Aircraft Industry Leaders
Airbus SE
The Boeing Company
Embraer S.A.
Commercial Aircraft Corporation of China, Ltd. (COMAC)
Avions de Transport Régional GIE (ATR)
- *Disclaimer: Major Players sorted in no particular order

Recent Industry Developments
- November 2025: flydubai signed a Memorandum of Understanding (MoU) with Airbus for 150 A321neo aircraft during the Dubai Airshow 2025. This agreement marks flydubai's entry as a new Airbus customer and supports Dubai's long-term aviation growth strategy.
- November 2025: Spanish airline Air Europa signed a MoU with Airbus for up to 40 A350-900 aircraft during the Dubai Airshow. This agreement aligns with the airline's long-haul fleet renewal strategy and its expansion plans for high-growth routes in Latin America.


Global Commercial Aircraft Market Report Scope
This report analyzes the global commercial aircraft market, focusing on the design, manufacturing, assembly, delivery, and aftermarket support of fixed-wing aircraft used for passenger and cargo transportation. The study includes narrowbody, widebody, and regional aircraft, covering both jet and turboprop platforms. It evaluates market performance across original equipment manufacturing (OEM) sales, fleet replacement, and capacity expansion driven by airline demand. The analysis encompasses the entire aircraft ecosystem, including airframe and propulsion systems, avionics, cabin interiors, and integrated service offerings, for both linefit and retrofit installations.
The commercial aircraft market is segmented by aircraft type, application, propulsion type, component, and geography. By aircraft type, the market is segmented into narrowbody, widebody, and regional jets. By application, the market is segmented into passenger and freighter. By propulsion type, the market is segmented into turbofan and turboprop. By component, the market is segmented into airframe structures, aero-engines, avionics and flight control, cabin interior and IFEC, and other components. The report also covers the market sizes and forecasts for the commercial aircraft market in major countries across different regions. For each segment, the market size is provided in terms of value (USD).
| Narrowbody |
| Widebody |
| Regional Jets |
| Passenger |
| Freighter |
| Turbofan |
| Turboprop |
| Airframe Structures |
| Aero-Engines |
| Avionics and Flight Control |
| Cabin Interior and IFEC |
| Other Components |
| North America | United States | |
| Canada | ||
| Mexico | ||
| Europe | United Kingdom | |
| Germany | ||
| France | ||
| Italy | ||
| Spain | ||
| Rest of Europe | ||
| Asia-Pacific | China | |
| Japan | ||
| India | ||
| South Korea | ||
| Singapore | ||
| Rest of Asia-Pacific | ||
| South America | Brazil | |
| Rest of South America | ||
| Middle East and Africa | Middle East | United Arab Emirates |
| Saudi Arabia | ||
| Qatar | ||
| Rest of Middle East | ||
| Africa | South Africa | |
| Rest of Africa | ||
| By Aircraft Type | Narrowbody | ||
| Widebody | |||
| Regional Jets | |||
| By Application | Passenger | ||
| Freighter | |||
| By Propulsion Type | Turbofan | ||
| Turboprop | |||
| By Component | Airframe Structures | ||
| Aero-Engines | |||
| Avionics and Flight Control | |||
| Cabin Interior and IFEC | |||
| Other Components | |||
| By Geography | North America | United States | |
| Canada | |||
| Mexico | |||
| Europe | United Kingdom | ||
| Germany | |||
| France | |||
| Italy | |||
| Spain | |||
| Rest of Europe | |||
| Asia-Pacific | China | ||
| Japan | |||
| India | |||
| South Korea | |||
| Singapore | |||
| Rest of Asia-Pacific | |||
| South America | Brazil | ||
| Rest of South America | |||
| Middle East and Africa | Middle East | United Arab Emirates | |
| Saudi Arabia | |||
| Qatar | |||
| Rest of Middle East | |||
| Africa | South Africa | ||
| Rest of Africa | |||


Market Definition
- Aircraft Type - Commercial Aviation includes aircraft used to haul passengers and freight on a scheduled basis between selected airports.
- Sub-Aircraft Type - Fixed-Wing passenger aircraft and freighter aircraft operated by airlines and adapted for carrying passengers and cargo are considered under the study.
- Body Type - Narrowbody and widebody aircraft which are single aisle and twin aisle are included under this study.
| Keyword | Definition |
|---|---|
| IATA | IATA stands for the International Air Transport Association, a trade organization composed of airlines around the world that has an influence over the commercial aspects of flight. |
| ICAO | ICAO stands for International Civil Aviation Organization, a specialized agency of the United Nations that supports aviation and navigation around the globe. |
| Air Operator Certificate (AOC) | A certificate granted by a National Aviation Authority permitting the conduct of commercial flying activities. |
| Certificate Of Airworthiness (CoA) | A Certificate Of Airworthiness (CoA) is issued for an aircraft by the civil aviation authority in the state in which the aircraft is registered. |
| Gross Domestic Product (GDP) | Gross domestic product (GDP) is a monetary measure of the market value of all the final goods and services produced in a specific time period by countries. |
| RPK (Revenue Passenger Kilometres) | The RPK of an airline is the sum of the products obtained by multiplying the number of revenue passengers carried on each flight stage by the stage distance - it is the total number of kilometers traveled by all revenue passengers. |
| Load Factor | The load factor is a metric used in the airline industry that measures the percentage of available seating capacity that has been filled with passengers. |
| Original Equipment Manufacturer (OEM) | An original equipment manufacturer (OEM) traditionally is defined as a company whose goods are used as components in the products of another company, which then sells the finished item to users. |
| International Transportation Safety Association (ITSA) | International Transportation Safety Association (ITSA) is an international network of heads of independent safety investigation authorities (SIA). |
| Available Seats Kilometre (ASK) | This metric is calculated by multiplying Available Seats (AS) in one flight, defined above, multiplied by the distance flown. |
| Gross Weight | The fully-loaded weight of an aircraft, also known as “takeoff weight,” which includes the combined weight of passengers, cargo, and fuel. |
| Airworthiness | The ability of an aircraft, or other airborne equipment or system, to operate in flight and on the ground without significant hazard to aircrew, ground crew, passengers or to other third parties. |
| Airworthiness Standards | Detailed and comprehensive design and safety criteria applicable to the category of aeronautical product (aircraft, engine or propeller). |
| Fixed Base Operator (FBO) | A business or organization that operates at an airport. An FBO provides aircraft operating services like maintenance, fueling, flight training, charter services, hangaring, and parking. |
| High Net worth Individuals (HNWIs) | High Net worth Individuals (HNWIs) are individuals with over USD 1 million in liquid financial assets. |
| Ultra High Net worth Individuals (UHNWIs) | Ultra High Net worth Individuals (UHNWIs) are individuals with over USD 30 million in liquid financial assets. |
| Federal Aviation Administration (FAA) | The division of the Department of Transportation is concerned with aviation. It operates Air Traffic Control and regulates everything from aircraft manufacturing to pilot training to airport operations in the United States. |
| EASA (European Aviation Safety Agency) | The European Aviation Safety Agency is a European Union agency established in 2002 with the task of overseeing civil aviation safety and regulation. |
| Airborne Warning and Control System (AW&C) aircraft | Airborne Warning and Control System (AEW&C) aircraft is equipped with a powerful radar and on-board command and control center to direct the armed forces. |
| The North Atlantic Treaty Organization (NATO) | The North Atlantic Treaty Organization (NATO), also called the North Atlantic Alliance, is an intergovernmental military alliance between 30 member states – 28 European and two North American. |
| Joint Strike Fighter (JSF) | Joint Strike Fighter (JSF) is a development and acquisition program intended to replace a wide range of existing fighter, strike, and ground attack aircraft for the United States, the United Kingdom, Italy, Canada, Australia, the Netherlands, Denmark, Norway, and formerly Turkey. |
| Light Combat Aircraft (LCA) | A light combat aircraft (LCA) is a light, multirole jet/turboprop military aircraft, commonly derived from advanced trainer designs, designed for engaging in light combat. |
| Stockholm International Peace Research Institute (SIPRI) | Stockholm International Peace Research Institute (SIPRI) is an international institute that provides data, analysis, and recommendations for armed conflict, military expenditure, and arms trade as well as disarmament and arms control. |
| Maritime Patrol Aircraft (MPA) | A maritime patrol aircraft (MPA), also known as maritime reconnaissance aircraft is a fixed-wing aircraft designed to operate for long durations over water in maritime patrol roles, in particular, anti-submarine warfare (ASW), anti-ship warfare (AShW), and search and rescue (SAR). |
| Mach Number | The Mach number is defined as the ratio of true airspeed to the speed of sound at the altitude of a given aircraft. |
| Stealth Aircraft | Stealth is a Common term applied to low observable (LO) technology and doctrine, that makes an aircraft near invisible to radar, infrared or visual detection. |


Research Methodology
Mordor Intelligence follows a four-step methodology in all our reports.
- Step-1: Identify Key Variables: In order to build a robust forecasting methodology, the variables and factors identified in Step-1 are tested against available historical market numbers. Through an iterative process, the variables required for market forecast are set and the model is built on the basis of these variables.
- Step-2: Build a Market Model: Market-size estimations for the historical and forecast years have been provided in revenue and volume terms. For sales conversion to volume, the average selling price (ASP) is kept constant throughout the forecast period for each country, and inflation is not a part of the pricing.
- Step-3: Validate and Finalize: In this important step, all market numbers, variables and analyst calls are validated through an extensive network of primary research experts from the market studied. The respondents are selected across levels and functions to generate a holistic picture of the market studied.
- Step-4: Research Outputs: Syndicated Reports, Custom Consulting Assignments, Databases & Subscription Platforms


