Business Aviation Services Market Size and Share
Market Overview
| Study Period | 2020 - 2031 |
|---|---|
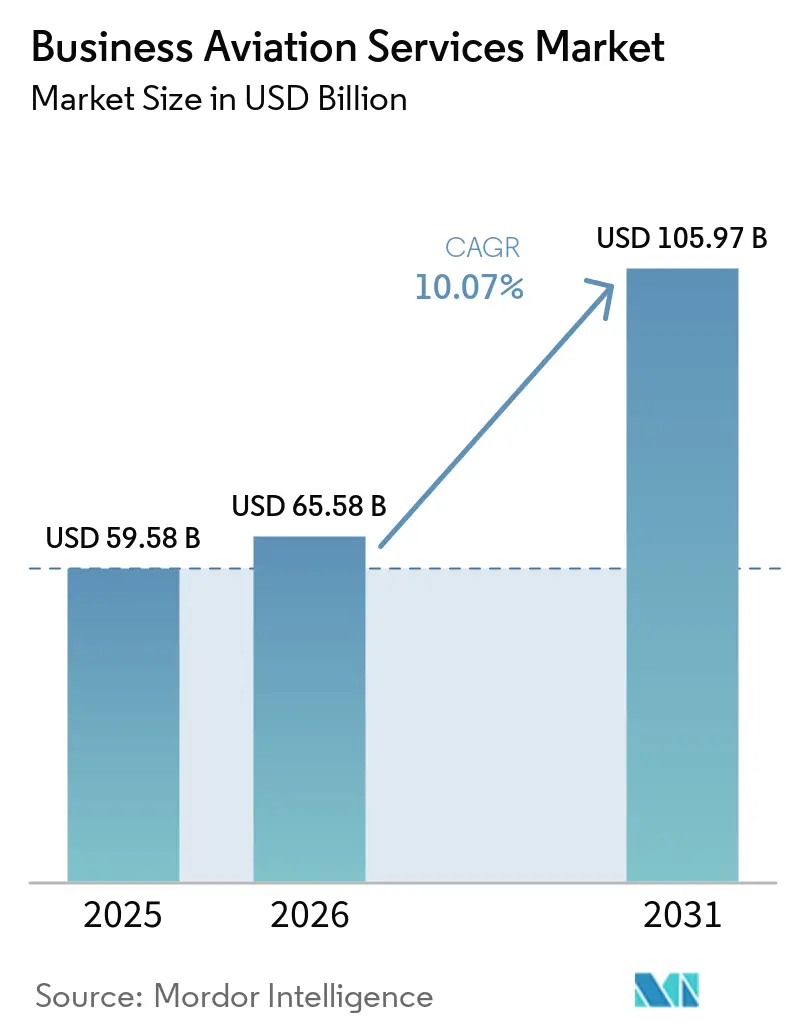
| Market Size (2026) | USD 65.58 Billion |
| Market Size (2031) | USD 105.97 Billion |
| Growth Rate (2026 - 2031) | 10.07% CAGR |
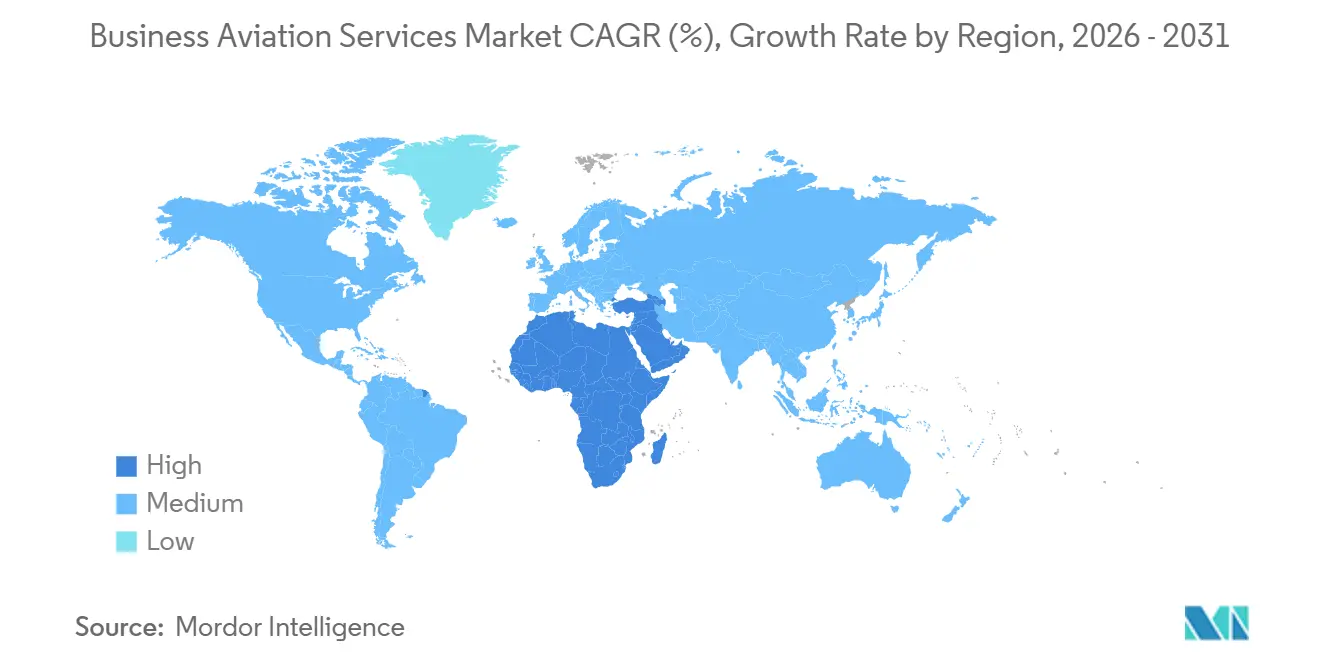
| Fastest Growing Market | Middle East and Africa |
| Largest Market | North America |
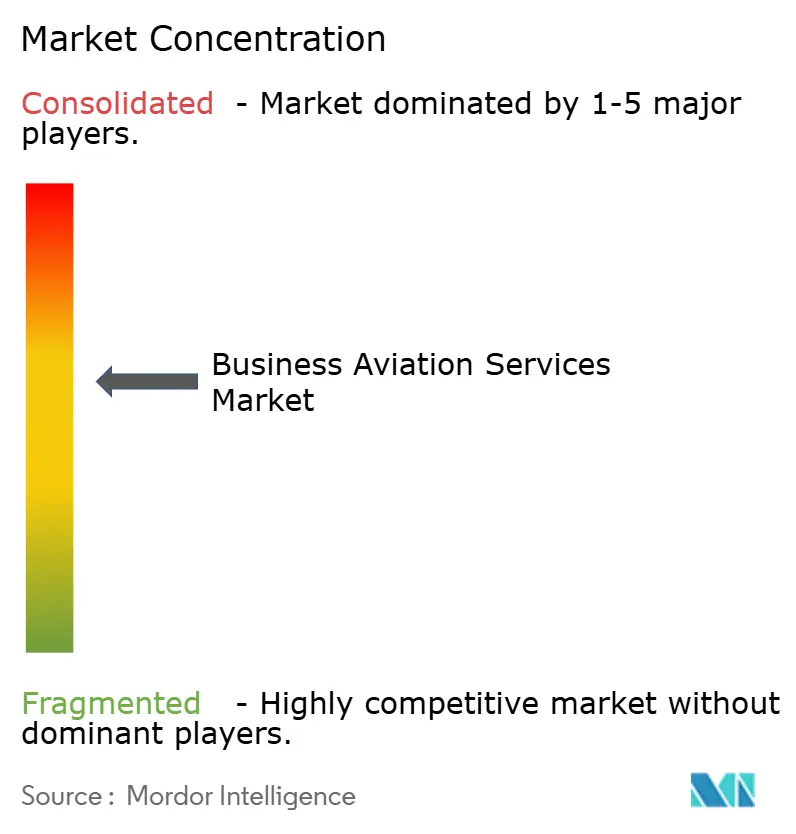
| Market Concentration | Medium |
Major Players *Disclaimer: Major Players sorted in no particular order Image © Mordor Intelligence. Reuse requires attribution under CC BY 4.0. | |
Business Aviation Services Market Analysis by Mordor Intelligence
The business aviation services market size in 2026 was valued at USD 59.58 billion in 2025, and is projected to grow from USD 65.58 billion in 2026 to USD 105.97 billion in 2031, growing at a 10.07% CAGR over 2026-2031. Rising demand for time-efficient travel, expanding access to secondary airports, and corporate emphasis on productivity have positioned business aviation as a strategic asset rather than a discretionary perk. The market’s resilience has also been underpinned by rapid uptake of sustainable aviation fuel (SAF) book-and-claim programs, digital charter marketplaces that cut acquisition costs, and growing ultra-high-net-worth (UHNW) leisure traffic seeking direct links to remote luxury properties. Operators accelerated fleet renewal to introduce SAF-ready aircraft and advanced avionics, while fractional and membership models broadened the customer base among small and mid-sized enterprises (SMEs). North America retained leadership thanks to deep infrastructure and supportive regulations, and the Middle East and Africa registered the fastest regional expansion on the back of economic diversification and new hub investments.
Key Report Takeaways
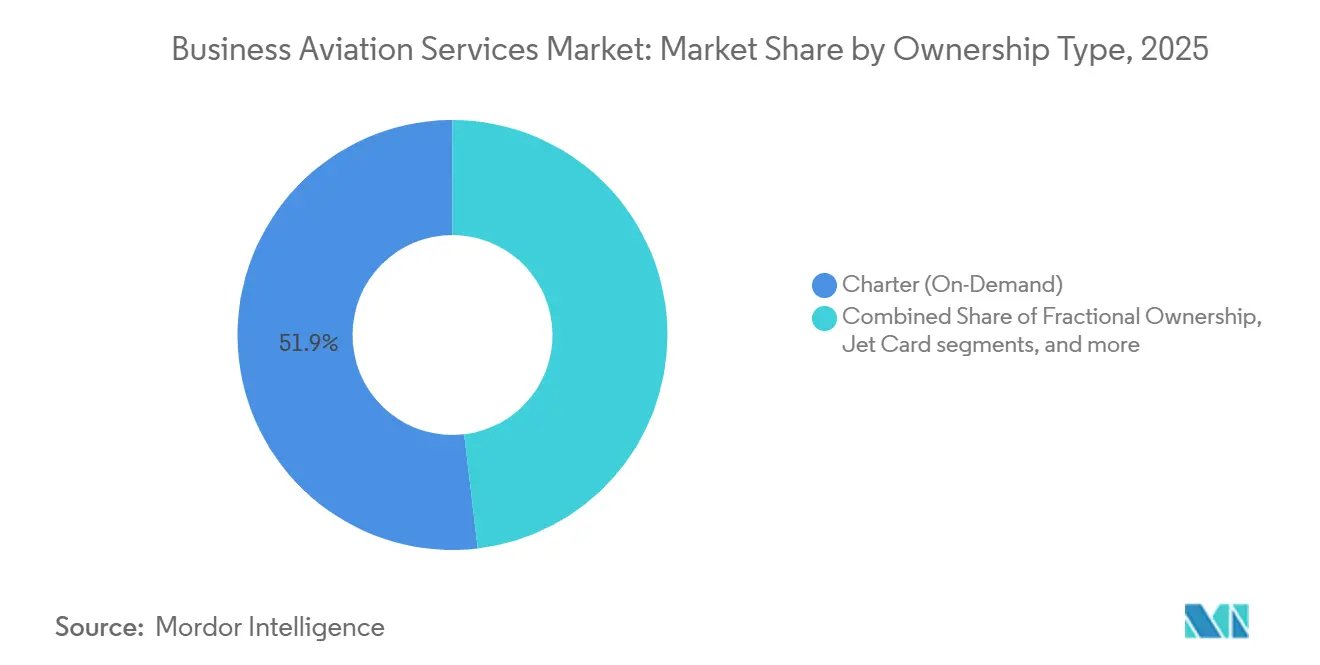
- By ownership type, charter services led the business aviation services market with 51.88% market share in 2025, whereas fractional ownership is projected to post a 12.18% CAGR through 2031.
- By aircraft type, light jets accounted for 43.02% of the business aviation services market in 2025; large jets are forecast to expand at a 11.12% CAGR through 2031.
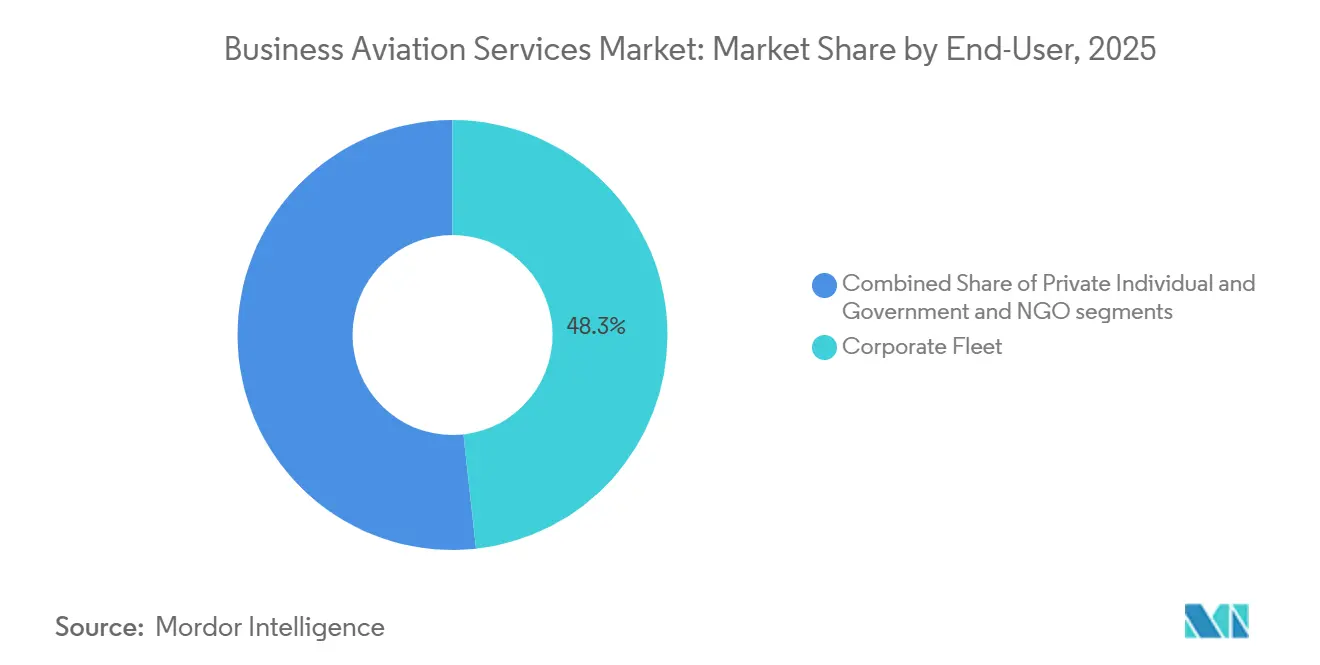
- By end user, corporate fleets accounted for 48.25% of demand in 2025, while private individuals are forecasted to grow at 11.44% CAGR to 2031.
- By flight duration, 2-5-hour missions captured 59.22% activity in 2025; flights above 5 hours are projected to rise at 12.98% CAGR through 2031.
- By geography, North America commanded a 60.94% share in 2025, and the Middle East and Africa region is forecast to advance at a 11.88% CAGR to 2031.
Note: Market size and forecast figures in this report are generated using Mordor Intelligence’s proprietary estimation framework, updated with the latest available data and insights as of 2026.
Global Business Aviation Services Market Trends and Insights
Drivers Impact Analysis*
| Driver | (~) % Impact on CAGR Forecast | Geographic Relevance | Impact Timeline |
|---|---|---|---|
| Post-COVID corporate travel rebound in mid-size and super-mid jet categories | +2.1% | Global, concentrated in North America and Europe | Medium term (2-4 years) |
| Surging fractional-ownership and membership models among SMEs | +1.8% | North America and Europe, expanding to Asia-Pacific | Long term (≥ 4 years) |
| Accelerated replacement cycle driven by SAF-ready aircraft and avionics retrofits | +1.5% | Global, led by EU mandates | Medium term (2-4 years) |
| Digital charter marketplaces lowering customer acquisition costs | +1.2% | Global, early adoption in North America | Short term (≤ 2 years) |
| UHNW leisure demand for ultra-long-range flights to second-home destinations | +0.9% | Global, UHNW population centers | Long term (≥ 4 years) |
| Corporate sustainability credits earned via SAF book-and-claim programs | +0.7% | EU and North America, expanding globally | Medium term (2-4 years) |
| Source: Mordor Intelligence | |||
Post-COVID corporate travel rebound in mid-size and super-mid jet categories
Corporate travel spending in the Middle East reached USD 18.1 billion in 2024, 19.4% above pre-pandemic levels, mirroring similar recoveries in the US and Europe.[1]Source: Zawya Staff, “Middle East Business Travel Adapts to Global Shifts,” zawya.com Airlines restored schedules, yet secondary-airport access, same-day itineraries, and cabin privacy kept the business aviation services market attractive for mid-size and super-mid jets that dominate the 2-5-hour mission band. Companies valued productivity gains over direct seat costs, while “bleisure” trips blended work and leisure, further supporting demand for cabins that balance function and comfort. The segment benefited as operators offered SAF burn offsets, easing environmental scrutiny.
Surging fractional-ownership and membership models among SMEs
Fractional flight hours surpassed 760,000 in North America in 2021, 23% ahead of 2019, as NetJets invested USD 2.5 billion in new aircraft and promoted predictable cost structures that appeal to SME finance teams. Membership programs removed acquisition fees and guaranteed aircraft within 4-10 hours’ notice, lowering entry hurdles. Therefore, the business aviation services market captured customers previously confined to scheduled airlines, reshaping demand toward more frequent, shorter missions.
Accelerated replacement cycle driven by SAF-ready aircraft and avionics retrofits
Based on federal incentives, the US's SAF production capacity expanded from roughly 2,000 to nearly 30,000 barrels per day in 2024. Operators upgraded fleets to exploit lower fuel burn, avoid EU Emissions Trading System penalties, and enable future CORSIA compliance. Collins Aerospace scheduled Pro Line 21 retrofits for Citation jets for late 2025, adding data link and ADS-B In functionality to align with regulatory requirements.[2]Source: Collins Aerospace, “Pro Line 21 Modernization,” rtx.com Newer airframes commanded higher residual values, whereas unmodified jets risked obsolescence.
Digital charter marketplaces lowering customer acquisition costs
Digital brokers like Real Jet offered on-demand access with transparent pricing and no membership fees, connecting travelers directly to operators and sidestepping traditional intermediaries. The platforms enabled dynamic inventory visibility, reduced empty-leg inefficiencies, and supported per-seat sales, broadening the addressable customer pool and intensifying competition on service quality rather than legacy relationships.
Restraints Impact Analysis*
| Restraint | (~) % Impact on CAGR Forecast | Geographic Relevance | Impact Timeline |
|---|---|---|---|
| Rising operating cost base from pilot shortage wage inflation | -1.9% | Global, most acute in North America and Europe | Short term (≤ 2 years) |
| Airspace congestion and slot curbs at tier-1 business hubs | -1.1% | North America and Europe, expanding to Asia-Pacific | Medium term (2-4 years) |
| EU-ETS and looming ICAO CORSIA Phase 2 compliance costs | -0.8% | Primarily EU, global secondary | Medium term (2-4 years) |
| OEM delivery delays linked to lithium-ion battery certification bottlenecks | -0.6% | Global, all major manufacturers | Short term (≤ 2 years) |
| Source: Mordor Intelligence | |||
Rising operating cost base from pilot shortage wage inflation
Starting airline pilot salaries climbed from USD 16,000 in 2000 to USD 108,000 in 2023, and airlines hired more than 14,000 pilots annually, draining the business aviation talent pool.[3]Source: Aircraft Owners and Pilots Association, “An Unfathomable Number,” aopa.org Operators raised wages, funded in-house training, and offered retention incentives, adding pressure to pricing and margins.
Airspace congestion and slot curbs at tier-1 business hub
Level 3 airports such as JFK, LaGuardia, and Reagan National require slot allocation once demand exceeds capacity. Business aviation flights typically lacked historical precedence, forcing departures during off-peak windows or diversions to secondary fields, eroding the value proposition of time flexibility.
*Our forecasts treat driver/restraint impacts as directional, not additive. The impact forecasts reflect baseline growth, mix effects, and variable interactions.
Segment Analysis
By Ownership Type: Charter Dominance Faces Fractional Disruption
Charter services accounted for 51.88% of the business aviation services market in 2025, offering on-demand flexibility to clients with irregular travel needs. Fractional ownership, however, recorded the highest 12.18% CAGR forecast to 2031 as SMEs adopted shared equity to guarantee aircraft availability while avoiding fleet management overhead. The charter model thrived because operators could reposition aircraft globally to smooth seasonality and match variable demand. Yet predictable hourly pricing, tax incentives, and lower capital outlay strengthened the appeal of fractional shares.
Hybrid offerings blurred category lines. Jet cards offered fixed hourly rates for 25-100-hour blocks, while membership schemes eliminated acquisition fees. Vista Global doubled its North American charter footprint through a USD 350 million acquisition of Jet Edge, signaling the scale required to compete across models. As a result, the business aviation services market witnessed intensified service innovation and bundling strategies.


By Aircraft Type: Light Jet Leadership Challenged by Large Jet Growth
Light jets accounted for 43.02% of the business aviation services market in 2025, thanks to lower operating costs and their suitability for the dominant 2-5-hour mission profile. Mid-size models bridged cost and range, but large jets are set to grow at a 11.12% CAGR because clients value nonstop connectivity across continents. Bombardier’s Global 8000, with an 8,000-nautical-mile range and certification planned for 2025, exemplified the premiumization trend.
Cabin technology improvements, longer maintenance intervals, and SAF compatibility further enhanced large-jet economics. Light jets remained essential in North America, where secondary airports were abundant, while new routes between Asia, the Middle East, and Africa spurred demand for large-cabin endurance.
By End User: Corporate Fleets Drive Volume While Private Individuals Accelerate Growth
Corporate operators generated 48.25% of demand in 2025 by leveraging business aviation to complete multi-city itineraries daily, gaining access to more than 5,000 airports unavailable to scheduled airlines. Board-level acceptance of carbon accounting encouraged SAF book-and-claim schemes, allowing firms to meet environmental targets without sacrificing travel speed.
Private individual usage, scaling at 11.44% CAGR, reflected rapid UHNW population growth. Dubai alone is expected to have more than 6,700 new millionaires in 2024, fueling bespoke travel to second homes. Lifestyle buyers prioritized luxury cabins, pet-friendly policies, and bespoke concierge services, alongside a range of other amenities.
By Flight Hours: Medium-Duration Dominance with Long-Range Acceleration
Flights of 2-5 hours accounted for 59.22% of activity in 2025 because they enabled executives to return the same day, avoiding hotel costs and personal downtime. Above-5-hour missions are forecast to grow fastest at 12.98% CAGR as cross-border M&A and UHNW leisure itineraries multiply. Honeywell’s 2024 survey showed 90% of operators intending to maintain or increase utilization in 2025, supporting continued fleet growth.
Short-hop segments under 2 hours remained niche, mainly for medical or island-shuttle missions. Operator optimization of empty legs and per-seat sales models also improved longer-range routing efficiency, helping fill cabins that once had to be repositioned empty.
Geography Analysis
North America held 60.94% of the business aviation services market share in 2025, supported by more than 14,000 accessible airports and stable regulatory frameworks that enabled quick, efficient, and transparent clearances. The United States, home to the largest concentration of Fortune 500 headquarters, led regional demand, while Canada and Mexico provided cross-border connectivity for energy, mining, and manufacturing sectors. Pilot shortages and increasing congestion at New York and Washington hubs posed near-term constraints, but digital scheduling tools and secondary-airport strategies mitigated disruption.
Europe remained sizable, though operators faced stringent environmental measures. The ReFuelEU Aviation mandate obliged carriers to blend SAF, prompting Lufthansa to add surcharges of up to EUR 72 per flight in 2025. The United Kingdom, Germany, and France anchored intra-European missions, whereas geopolitical tensions limited Russian activity. Fleet modernization, carbon offset schemes, and optimized routing helped operators maintain service quality under tighter emissions rules.
The Middle East and Africa emerged as the fastest-growing region with a 11.88% CAGR outlook. Saudi Arabia recorded 128 million passengers in 2024 as Vision 2030 reforms opened market access to foreign charter firms. New fixed-base operator (FBO) facilities in Dubai and Riyadh, plus relaxed cabotage rules, encouraged regional network expansion. Africa’s mining and infrastructure projects demanded point-to-point connections to remote sites, reinforcing the value proposition of the business aviation services market.

Competitive Landscape
Competition remained semi-consolidated, with high entry barriers from regulation, capital costs, and operational complexity. NetJets dominated fractional ownership with over 60% segment share, leveraging scale to assure aircraft availability and maintenance depth. Flexjet and Wheels Up pursued differentiated positioning, the latter securing USD 332 million financing in 2024 to acquire GrandView’s fleet and extend member benefits.
Technology integration offered a competitive edge. Gogo’s USD 375 million purchase of Satcom Direct created an end-to-end connectivity provider with roughly USD 890 million in combined revenue, promising seamless in-flight broadband and cockpit data connectivity. Honeywell’s 2025 decision to spin off aerospace operations aimed to sharpen its focus on avionics and propulsion innovation.
Consolidation continued as operators sought scale, route density, and bargaining power with OEMs. Yet niche providers thrived by offering bespoke luxury, specialized medical missions, or operations in emerging markets with limited competition. Therefore, the business aviation services market balanced scale efficiencies with service specialization.
Business Aviation Services Industry Leaders
Flexjet, LLC
VistaJet Group Holding Limited
Wheels Up Partners Holdings LLC
Jet Aviation AG
NetJets IP, LLC
- *Disclaimer: Major Players sorted in no particular order

Recent Industry Developments
- April 2026: VistaJet inked a deal focused on Bombardier's Smart Parts program, which not only supports parts for VistaJet's current fleet but also its future acquisitions. Notably, this includes the bulk of its Global 8000 fleet and a recent order comprising 40 firm and 120 optional Challenger 3500 aircraft. Bombardier is set to bolster parts availability and accessibility, customizing these enhancements for the Vista Bombardier fleet. This new Master Services Agreement aims to boost aircraft availability and reduce operational disruptions, ensuring Vista maintains its high service standards for clients globally.
- March 2025: OPUL Jets acquired Wallcourt Aviation, integrating fleets to broaden luxury charter reach.
- November 2024: Wheels Up secured USD 332 million to buy the GrandView fleet, enhancing medical charter and light-jet coverage.


Research Methodology Framework and Report Scope
Market Definitions and Key Coverage
Our study treats the Business Aviation Services market as all revenue earned from charter flights, fractional ownership programs, jet card or membership models, concierge and trip support, and fixed base or inflight amenity packages that keep a business aircraft mission ready. According to Mordor Intelligence analysts, the value reported for 2025, USD 59.58 billion, captures recurring service income generated once an aircraft is in service rather than the capital cost of the aircraft itself.
Scope Exclusions: Manufacture and outright sale of new or pre-owned aircraft, engines, or avionics are not included.
Segmentation Overview
- By Ownership Type
- Charter (On-Demand)
- Fractional Ownership
- Jet Card/Membership
- By Aircraft Type
- Light Jet
- Mid-Size Jet
- Large Jet
- Airliners
- By End-User
- Corporate Fleet
- Private Individual
- Government and NGO
- By Flight Duration
- Upto 2 hours
- Between 2 to 5 hours
- More than 5 Hours
- By Geography
- North America
- United States
- Canada
- Mexico
- Europe
- United Kingdom
- Germany
- France
- Russia
- Rest of Europe
- Asia-Pacific
- China
- Japan
- India
- South Korea
- Australia
- Rest of Asia-Pacific
- South America
- Brazil
- Rest of South America
- Middle East and Africa
- Middle East
- United Arab Emirates
- Saudi Arabia
- Qatar
- Rest of Middle East
- Africa
- South Africa
- Rest of Africa
- Middle East
- North America
Detailed Research Methodology and Data Validation
Primary Research
Interviews with charter operators, fractional fleet managers, FBO executives, leasing specialists, and SAF program coordinators across North America, Europe, the Gulf, and Asia helped validate utilization rates, average charter hours, and evolving membership pricing. Short online surveys with frequent business flyers further clarified service quality trade-offs shaping willingness to pay.
Desk Research
We began with wide-angle desk work that mined open datasets from bodies such as the FAA and EASA for flight activity, GAMA shipment reports for fleet dynamics, UN Comtrade customs logs for cross-border charter movements, IATA traffic statistics for macro travel trends, and World Bank wealth indicators for HNWI growth. Company 10-Ks, investor decks, and reputable aviation trade publications supplied current tariff, fuel price, and operating cost inputs. Where deeper financial granularity was essential, Mordor drew selectively on paid repositories, D&B Hoovers for operator revenue splits and Dow Jones Factiva for global FBO deal tracking. This list is illustrative, not exhaustive; additional sources were consulted to cross-check every datapoint that feeds the model.
Market Sizing and Forecasting
A top-down construct starts with regional business jet departures, seat hour factors, and average hourly yield to recreate service revenue pools, which are then tested through selective bottom-up checks, sampled operator statements, FBO fee schedules, and typical hourly charter pricing. Key variables include fleet size by ownership model, fractional share penetration, average occupied flight hours, SAF adoption cost premiums, OEM delivery backlogs, and HNWI population growth. Multivariate regression, supplemented by scenario analysis for fuel and economic cycles, drives the 2025 to 2030 forecast. Data gaps on smaller regional operators are bridged with proxy ratios derived from comparable airport slot usage.
Data Validation and Update Cycle
Outputs pass a three-layer review: automated anomaly flags, peer analyst audits, and a senior sign-off. When flight tracking platforms, customs filings, or OEM order books show variances beyond preset bands, we re-contact sources before release. Our models refresh yearly, with interim updates triggered by material events such as a major tax change or a new SAF mandate.
Why Mordor's Business Aviation Services Baseline Commands Confidence
Published estimates often differ because firms choose distinct scopes, currencies, and refresh points. Some fold in aircraft sales, others tally only new jet deliveries, while currency conversions and inflation assumptions vary.
Key gap drivers here include Mordor's service only lens, our annual refresh, and the dual validation of departure data with operator reported revenue, whereas other publishers may mix capital expenditure with operating turnover or rely on unverified average selling prices.
Benchmark comparison
| Market Size | Anonymized source | Primary gap driver |
|---|---|---|
| USD 59.58 B (2025) | Mordor Intelligence | - |
| USD 95.80 B (2024) | Global Consultancy A | Includes aircraft manufacturing and capex within scope |
| USD 72.15 B (2024) | Industry Journal B | Adds ownership costs and membership deposits, risking double count |
| USD 46.51 B (2024) | Trade Analyst C | Focuses on new jet deliveries, omits charter and trip support revenue |
The comparison shows that once differences in scope and cost components are stripped out, Mordor's figure sits at the midpoint of observable service revenue, giving decision makers a balanced, transparent baseline rooted in traceable variables and repeatable steps.


Key Questions Answered in the Report
What is the current value of the business aviation services market?
The market was valued at USD 65.58 billion in 2026 and is forecasted to reach USD 105.97 billion by 2031, reflecting a 10.07% CAGR.
Which ownership model is growing fastest?
Fractional ownership is expected to expand at 12.18% CAGR through 2031 as SMEs favor predictable costs and guaranteed aircraft access.
Why are large jets gaining popularity?
Demand for nonstop intercontinental travel and premium cabin comfort is driving large-jet growth at 11.12% CAGR.
Which region will see the fastest market growth?
The Middle East and Africa emerged as the fastest-growing region with a 11.88% CAGR outlook.
Which region has the biggest share in Business Aviation Services Market?
North America held 60.94% of the business aviation services market share in 2025, supported by more than 14,000 accessible airports and stable regulatory frameworks that permitted quick clearances.
How is sustainability influencing fleet decisions?
Operators are accelerating replacement cycles to adopt SAF-ready aircraft and advanced avionics that meet EU-ETS and CORSIA requirement
What are the main challenges facing operators today?
Pilot shortages causing wage inflation, slot constraints at major hubs, and rising compliance costs from emissions schemes are the most pressing restraints.
Page last updated on:


