Finance Lease Market Size and Share
Market Overview
| Study Period | 2020 - 2031 |
|---|---|
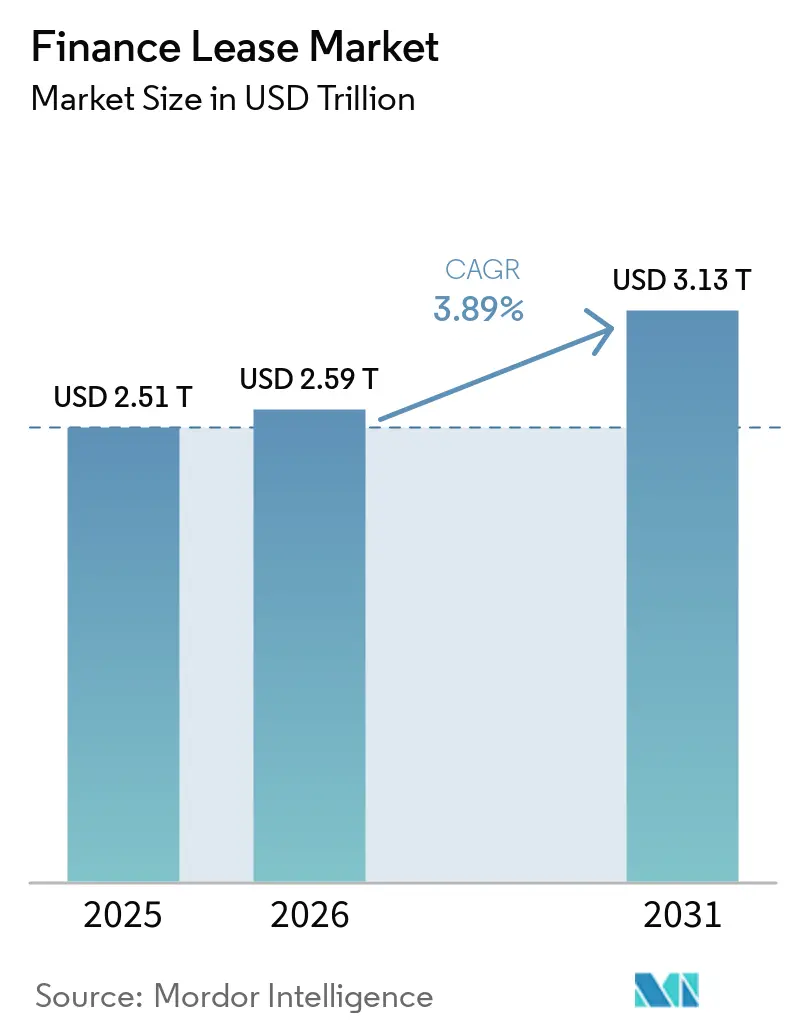
| Market Size (2026) | USD 2.59 Trillion |
| Market Size (2031) | USD 3.13 Trillion |
| Growth Rate (2026 - 2031) | 3.89% CAGR |
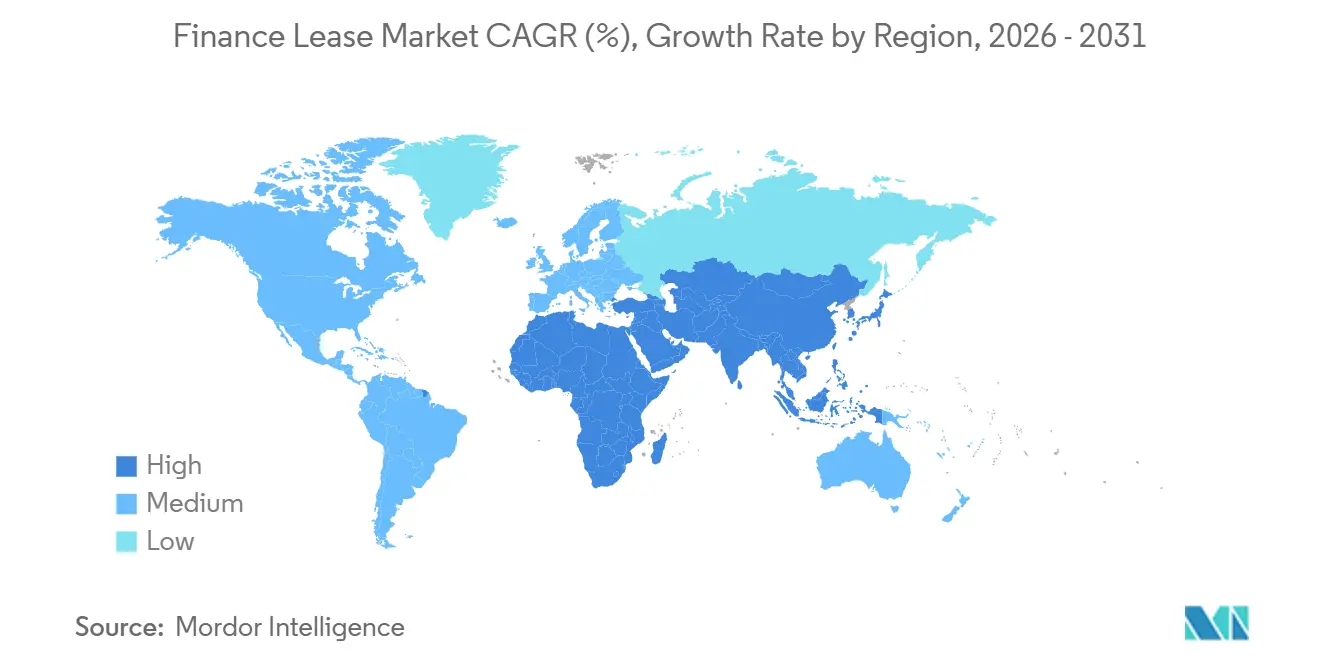
| Fastest Growing Market | Middle East and Africa |
| Largest Market | Asia-Pacific |
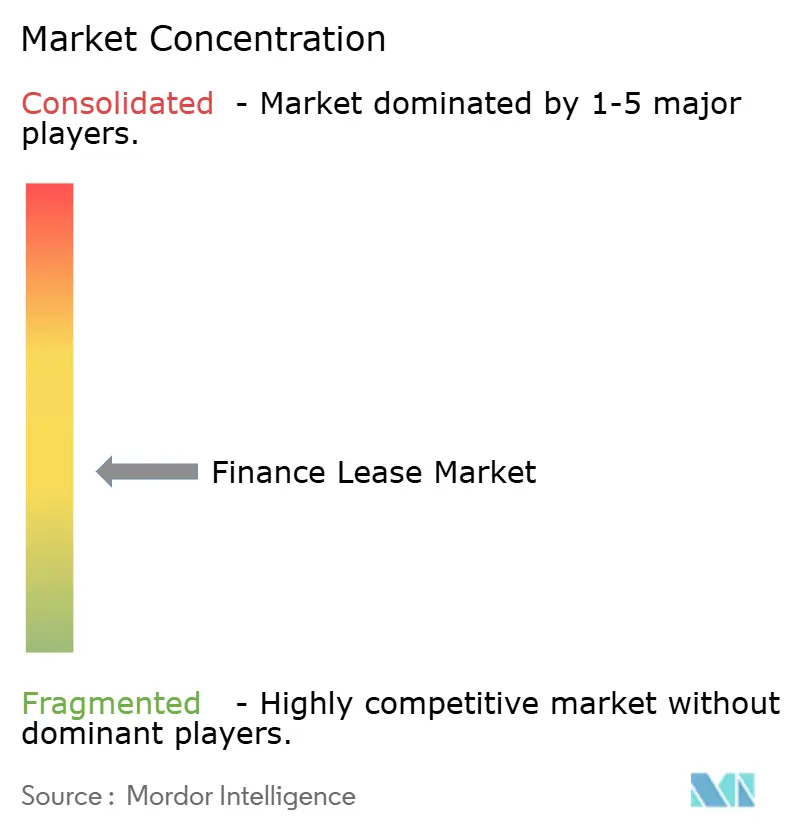
| Market Concentration | Medium |
Major Players *Disclaimer: Major Players sorted in no particular order Image © Mordor Intelligence. Reuse requires attribution under CC BY 4.0. | |
Finance Lease Market Analysis by Mordor Intelligence
The Finance Lease Market size is projected to be USD 2.51 trillion in 2025, USD 2.59 trillion in 2026, and reach USD 3.13 trillion by 2031, growing at a CAGR of 3.89% from 2026 to 2031.
The Finance lease market is growing on the back of a clear shift in corporate funding behavior, as companies place more value on liquidity preservation, predictable payment schedules, and access to productive assets without heavy upfront capital use. Changes in lease accounting rules have also made finance lease structures more relevant, because companies now weigh tax timing, depreciation treatment, and cost visibility more closely than they did when operating leases offered a clearer presentation advantage. The Finance lease market is also being reshaped by digital origination tools, embedded financing paths inside vendor channels, and faster underwriting models that help lessors serve both large enterprises and smaller borrowers more efficiently. Competition remains active across bank-affiliated lessors, captives, and independents, and the strongest opportunities are emerging where funding scale, asset expertise, and quick decision-making can be combined in sectors such as transportation, renewable energy assets, and digitally originated equipment finance. The Finance lease market still faces pressure from rate volatility, residual-value uncertainty for fast-changing assets, and cross-border legal complexity, yet the underlying demand base remains broad enough to support steady expansion through 2031.
Key Report Takeaways
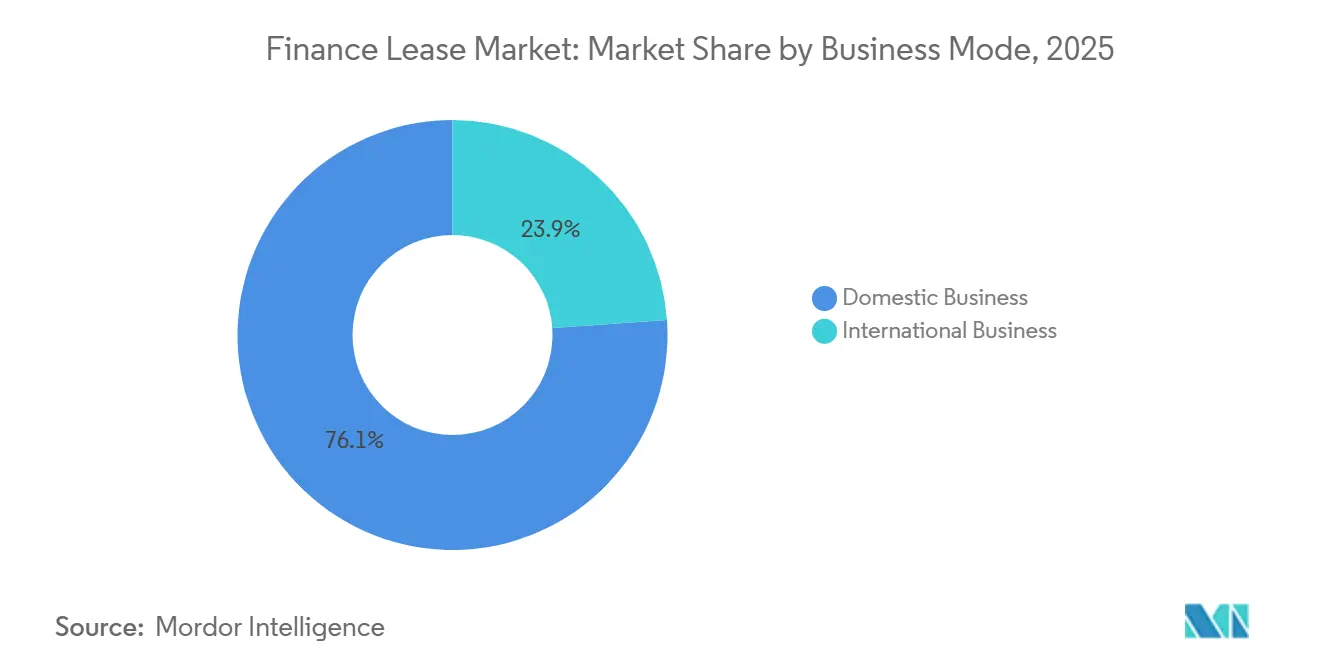
- By business mode, domestic business accounted for 76.12% of the finance lease market share in 2025, while international business is projected to grow at 5.22% CAGR through 2031.
- By asset type, vehicles captured 32.79% of the finance lease market share in 2025, while aircraft finance leases are projected to grow at 6.04% CAGR through 2031.
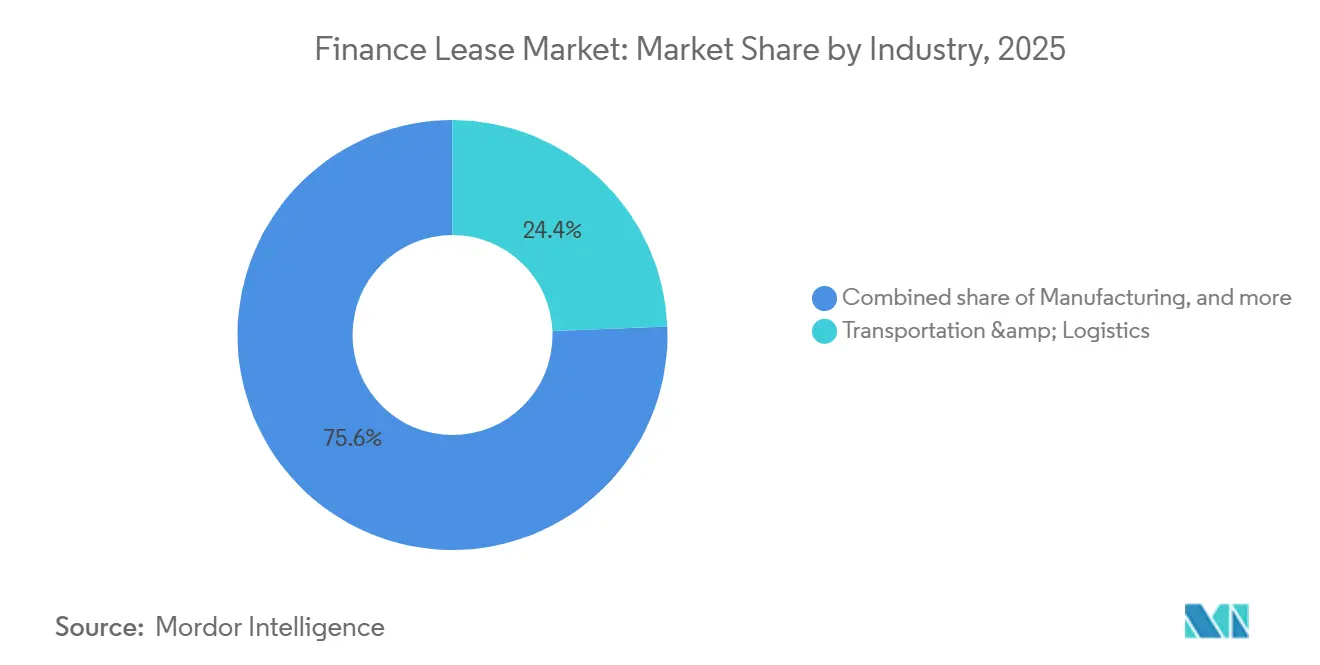
- By industry, transportation and logistics held 24.37% of the finance lease market share in 2025, while energy, utilities, and renewables are projected to expand at 6.89% CAGR through 2031.
- By lessor type, bank-owned and bank-affiliated leasing companies accounted for 47.91% of the finance lease market share in 2025, while independent leasing companies are projected to grow at a 5.77% CAGR through 2031.
- By geography, Asia-Pacific held 33.86% of the finance lease market share in 2025, while the Middle East and Africa are projected to grow at 6.52% CAGR through 2031.
Note: Market size and forecast figures in this report are generated using Mordor Intelligence’s proprietary estimation framework, updated with the latest available data and insights as of January 2026.
Global Finance Lease Market Trends and Insights
Drivers Impact Analysis*
| Driver | (~) % Impact on CAGR Forecast | Geographic Relevance | Impact Timeline |
|---|---|---|---|
| Rising Asset-Light Financing Demand | +1.1% | Global, concentrated in North America and the Asia-Pacific | Medium term (2-4 years) |
| Balance Sheet Efficiency Under IFRS 16 and ASC 842 | +0.7% | Global, primary in the EU and North America | Short term (≤ 2 years) |
| SME Credit Gap and Fast-Track Equipment Access | +0.5% | Asia-Pacific, MEA, South America | Long term (≥ 4 years) |
| Digital Underwriting and Embedded Finance Adoption | +0.6% | North America and the EU, with spillover to Asia-Pacific | Medium term (2-4 years) |
| Replacement-Cycle Financing for EV Fleets and Connected Assets | +0.4% | EU, North America, Asia-Pacific | Medium term (2-4 years) |
| Green Leasing for Energy-Efficient and Low-Carbon Assets | +0.3% | EU, Asia-Pacific core, with spillover to MEA | Long term (≥ 4 years) |
| Source: Mordor Intelligence | |||
Rising Asset-Light Financing Demand
The Finance lease market is benefiting from a broader move by companies to preserve cash while still securing access to revenue-generating assets. Corporate buyers are placing greater emphasis on liquidity discipline, which supports the use of finance leases for equipment, fleet, and technology assets that can be matched to operating cash flow. The Equipment Leasing and Finance Association said real equipment and software investment posted its strongest two-quarter performance in 20 years during H1 2025, indicating that demand has firmly shifted toward financing rather than outright ownership. This demand pattern also shifts more asset risk to lessors, especially when the financed equipment falls into categories with shorter useful lives or faster upgrade cycles. In the Finance lease market, that means growth is being supported by corporate caution on capital spending, but the quality of growth depends on whether lessors price residual and credit risk with enough discipline.
Balance Sheet Efficiency Under IFRS 16 and ASC 842
The Finance lease market is also supported by the way accounting standards now shape lease structuring decisions. The post-implementation review of IFRS 16 showed that the standard is generally working as intended, while EFRAG stated that it improved transparency and comparability by bringing most leases onto the balance sheet[1]European Financial Reporting Advisory Group, “EFRAG Releases Final Comment Letter on IASB's Post-Implementation Review of IFRS 16 Leases,” EFRAG, efrag.org. That outcome has reduced the older presentation advantage that once supported operating lease selection in many cases. For many lessees, the choice now depends more on depreciation treatment, interest recognition, tax timing, and funding logic than on simple balance sheet optics. The International Accounting Standards Board is expected to publish its project summary before the end of 2026, and that continued review keeps lease accounting relevant for multinational and cross-border structuring decisions in the Finance lease market.
SME Credit Gap and Fast-Track Equipment Access
The Finance lease market continues to gain support from the funding gap that smaller businesses face in conventional bank lending. Finance leases are often better suited to this borrower group because underwriting can focus more directly on the asset and its productive use, rather than only on the depth of the borrower's balance sheet. In Japan, total lease transaction volume reached JPY 5,298.4 billion (USD 33.92 billion) in FY2025, up 4.2% from FY2024, and both SME and public-sector lessees recorded volume growth[2]Japan Leasing Association, “Lease Statistics (FY2025),” Japan Leasing Association, leasing.or.jp. That pattern shows that access and speed remain central to demand, especially in working sectors where equipment installation cannot wait for a long credit review cycle. The Finance lease market, therefore, occupies an important position between formal bank credit and direct capital expenditure, particularly in parts of Asia, the Middle East, Africa, and South America, where smaller enterprises still face uneven access to financing.
Digital Underwriting and Embedded Finance Adoption
The Finance lease market is becoming easier to access as origination moves closer to the point of sale. Digital underwriting systems are helping lessors shorten approval times, organize more consistent credit assessments, and handle higher application volumes without the same dependence on manual review. This trend is becoming more visible when financing is offered inside OEM sales portals, vendor marketplaces, and structured procurement channels. ELFA's CapEx Finance Index reported seasonally adjusted new business volumes of USD 11.6 billion in January 2026, the highest monthly figure in the index's 20-year history, with captives showing especially strong month-on-month growth[3]Equipment Leasing & Finance Association, “CapEx Finance Index January 2026: New Equipment Demand Hit an All-Time High,” GlobeNewswire, globenewswire.com. In the Finance lease market, that kind of scale favors lessors that can combine technology, funding access, and vendor relationships into a smooth purchase-to-finance process.
Restraints Impact Analysis*
| Restraint | (~) % Impact on CAGR Forecast | Geographic Relevance | Impact Timeline |
|---|---|---|---|
| Interest Rate Volatility and Funding Spread Pressure | -0.5% | Global, primarily North America and EU | Short term (≤ 2 years) |
| Residual Value Risk in Fast-Obsolescing Asset Classes | -0.4% | Global, acute in IT and aviation sectors | Medium term (2-4 years) |
| Jurisdictional Tax, Accounting, and Repossession Complexity | -0.3% | Cross-border, MEA, and Asia-Pacific emerging markets | Long term (≥ 4 years) |
| Data Quality and Fraud-Detection Gaps in Digital Lease Origination | -0.2% | Global, acute in emerging market portfolios | Medium term (2-4 years) |
| Source: Mordor Intelligence | |||
Interest Rate Volatility and Funding Spread Pressure
The Finance lease market remains exposed to funding conditions even when lease demand is healthy. The United States saw support from three Federal Reserve rate cuts in Q4 2025, and that helped underpin strong early 2026 activity, but global rate cycles are still moving unevenly across regions. Lessors with cross-border books can face a mismatch when receivables are linked to local cash flows while funding is raised in hard currency. SMBC Aviation Capital noted that aircraft shortages kept lease rates firm enough to preserve margins even as spreads eased during 2025, but that kind of pricing support is not available in every asset class[4]SMBC Aviation Capital, “Push and Pull Factors on Aircraft Lease Rates 2026,” SMBC Aviation Capital, smbc.aero. In the Finance lease market, rate volatility does not stop origination on its own, but it can narrow margins and make pricing discipline more important for independents and other non-bank platforms.
Residual Value Risk in Fast-Obsolescing Asset Classes
Residual value uncertainty is another real restraint on the Finance lease market, especially where financed assets can lose value quickly after deployment. IT infrastructure, AI hardware, and some electric vehicle categories are moving through technology cycles faster than many older valuation models assumed. That creates a risk that end-of-term values will not align with the assumptions underlying multi-year finance contracts. The same pressure can spill over into portfolio strategy, as the most attractive growth categories can also be the least stable in terms of residual outcomes. In the Finance lease market, lessors that rely on static depreciation assumptions are more exposed when asset refresh cycles shorten, and secondary-market visibility weakens.
*Our forecasts treat driver/restraint impacts as directional, not additive. The impact forecasts reflect baseline growth, mix effects, and variable interactions.
Segment Analysis
By Business Mode: Domestic Volumes Anchored, Cross-Border Activity Accelerating
Domestic business accounted for 76.12% of global volume in 2025, keeping it firmly in the lead in the Finance lease market. This position reflects how strongly finance leasing still depends on local credit assessment, local legal enforcement, local asset servicing, and practical collateral recovery. The domestic model also gives lessors more direct oversight across the full asset life cycle, which helps with pricing, monitoring, and remarketing. That keeps domestic business relevant even during a period when multinational customers are seeking broader program coverage. The Finance lease market, therefore, remains grounded in local execution even as customer demand becomes more regional and international.
International business is still the faster-moving part of this structure, with a projected 5.22% CAGR through 2026-2031. That faster pace points to rising activity in cross-border fleet deployments, aviation sale-and-leaseback structures, and procurement programs handled through single-lessor frameworks. Japan's consolidated leasing capital investment for FY2025 reached JPY 10,932.9 billion (USD 69.99 billion), with domestic activity rising 9.4% while overseas activity declined 2.1%. This shows that even experienced lessors are selective about how they take on international risk, particularly when currency, repossession, and tax conditions vary sharply across jurisdictions. For the Finance lease market, cross-border growth is real, but the pace of expansion will still depend on whether lessors can manage complexity without weakening portfolio quality.


By Asset Type: Vehicles Lead, Aircraft Leasing Emerges as Strategic Growth Pocket
Vehicles accounted for 32.79% of total volume in 2025, making them the largest asset category in the Finance lease market share mix. Their scale stems from widespread use across transport, delivery, public services, construction support, and business fleets, as well as from easier valuation standards than those for many specialized asset types. Vehicles also fit well with structured financing because utilization patterns, replacement timing, and resale channels are easier to track in many countries. This gives lessors a more standardized product that can be written at volume and distributed across multiple verticals. In the Finance lease market, vehicle leasing remains important because it combines repeat demand with manageable collateral processes.
Aircraft finance leases are projected to grow at 6.04% CAGR through 2031, which makes aviation the fastest-growing asset pocket in the draft. The growth case is tied to supply-constrained delivery pipelines and airline dependence on lessor-backed financing when direct purchases are less practical. That keeps finance lease structures relevant in an asset class where delivery schedules, capital intensity, and fleet planning are tightly linked. Other asset groups, such as machinery, IT equipment, and specialized equipment, continue to form a large part of the base, but they do not carry the same combination of size and growth. The Finance lease market also has to treat non-aviation technology assets more carefully, because faster depreciation in connected and compute-intensive equipment can weaken end-of-term value assumptions more quickly than in vehicles or traditional machinery.
By Industry: Transportation and Logistics Anchors Volume, Energy Verticals Redefine Growth
Transportation and logistics held 24.37% of the Finance lease market share in 2025, which kept it at the center of vertical demand. The segment benefits from the direct revenue link between financed assets and operating output, as trucks, trailers, delivery fleets, and related equipment can be closely matched to cash generation. That makes amortization schedules easier to structure and easier for borrowers to justify. It also explains why this vertical remains a reliable volume anchor even when broader capital spending turns cautious. In the finance lease industry, transportation and logistics continue to set the tone for scale, as they combine broad fleet needs with established financing practices.
Energy, utilities, and renewables are projected to grow at 6.89% CAGR through 2031, making it the fastest-growing vertical in the draft. The attraction lies in the ability to deploy solar arrays, wind turbines, charging assets, and related equipment without immediate equity dilution or heavier project finance requirements. The European Investment Bank signed a EUR 600 million financing agreement with Leasys in 2026 to support 32,000 zero-emission vehicles across 10 EU countries, demonstrating how green asset deployment and lease-based funding are converging. Manufacturing, IT and telecom, construction and infrastructure, healthcare and life sciences, and retail-linked automation all remain meaningful parts of the Finance lease market, but many of them are being shaped more by replacement demand and asset complexity than by the structural acceleration seen in energy-related leasing. The finance lease industry is therefore gaining a second growth engine in low-carbon and utility-linked assets, while transportation continues to supply the larger-volume base.
By Lessor Type: Bank-Affiliated Platforms Retain Scale, Independents Compete on Speed
Bank-owned and bank-affiliated leasing companies held 47.91% of the market in 2025, which gave them the leading position in the Finance lease market. Their advantage rests on deposit-linked funding strength, established creditworthiness, and long-standing client relationships that can be leveraged for lease origination. These players also tend to have stronger balance sheet capacity for large-ticket and multi-country programs. That makes them especially competitive when customers want scale, continuity, and broad product coverage. The Finance lease market still relies heavily on these platforms because funding cost and customer reach remain central competitive tools.
Independent leasing companies are projected to grow at a 5.77% CAGR through 2031, outpacing the broader market. Their growth case is tied to faster execution, better integration with digital vendor channels, and the flexibility to serve asset niches that may sit outside standardized bank processes. ELFA's January 2026 CapEx Finance Index showed that bank new business volumes fell month on month, while captives grew strongly and independents stayed near record levels. Captive finance companies remain important where manufacturer alignment matters, but their concentration in parent-linked equipment can limit diversification. In the finance lease industry, that leaves bank-affiliated lessors with the scale edge and independents with the speed edge, and both positions are shaping how competitive share evolves.
Geography Analysis
Asia-Pacific captured 33.86% of the global Finance lease market size in 2025, which made it the largest regional block in the draft. The region combines large domestic leasing systems with broad demand across transport, industrial equipment, technology assets, and public-sector use. Japan remains an important anchor within this base, with total lease transaction volume reaching JPY 5,298.4 billion in FY2025, up 4.2% from FY2024. Japan's transport equipment segment posted double-digit growth, while information and communication equipment rose 8.7%. Personal auto leasing in Japan is projected to cross 1 million vehicles under lease by FY2026, up 50% from FY2023 end levels.
North America and Europe remained the second- and third-largest regions in the Finance lease market. In the United States, ELFA reported that total new business volumes in Q1 2026 rose 18.6% year over year, suggesting strong equipment finance demand at the start of the year. In the United Kingdom, the Finance & Leasing Association reported that total asset finance new business rose 3% in Q1 2026 versus Q1 2025, with plant and machinery finance up 16% in March and commercial vehicle finance up 13%. Germany continued to face a difficult operating environment, but Deutsche Leasing said that transformation-related demand in sustainability, digitalization, and mobility remained strong.
The Middle East and Africa is projected to grow at 6.52% CAGR through 2031, making it the fastest-growing regional segment in the Finance lease market. Saudi Arabia is an important part of that story, with Vision 2030-linked infrastructure and aviation activity creating demand across fleet, aircraft, and energy equipment financing. AviLease reported USD 664 million in revenue in 2025, up 19% year over year, and it completed its first lease deal with Riyadh Air in Q4 2025. South America also offers room for expansion, especially in domestic vehicle and machinery leasing, though currency volatility still complicates some cross-border structures. Across these higher-growth regions, the Finance lease market is being pulled forward by underpenetrated leasing adoption, expanding infrastructure needs, and the search for funding models that can support productive assets without immediate ownership outlays.

Competitive Landscape
The Finance lease market shows a moderately concentrated structure at the top, with major bank-affiliated platforms such as BNP Paribas Leasing Solutions, SMBC Group, and Bank of America holding strategic influence while a wide base of independents, captives, and specialists fills the mid-market. This produces a market structure in which scale matters, but it does not crowd out smaller competitors with asset or channel specialization. Large platforms still have an advantage in funding access, international coverage, and large-ticket execution. Smaller and mid-sized lessors can still compete where approval speed, asset knowledge, and embedded vendor access matter more than global footprint. The Finance lease market is therefore consolidating at the top without becoming closed to focused competitors.
One clear pattern is that leading groups are using acquisitions to add origination reach and asset depth faster than they could build them organically. In April 2026, Sumitomo Corporation, SMBC Aviation Capital, Apollo, and Brookfield completed the acquisition of Air Lease Corporation and renamed it Sumisho Air Lease Corporation, expanding SMBC Aviation Capital's fleet to 1,700 owned, serviced, and committed aircraft with a USD 26 billion new-technology orderbook. In 2026, BNP Paribas said Arval entered exclusive negotiations to acquire Athlon from Mercedes-Benz Group, a move that would create a combined full-service leasing fleet close to 2.3 million vehicles. These moves show that leading firms are buying distribution, asset portfolios, and customer access where scale advantages are becoming more valuable.
A second pattern is that funding access and digital capability are becoming stronger differentiators across the Finance lease market. DLL closed its first United States securitization transaction of 2026 at USD 672 million, demonstrating continued investor appetite for diversified lease collateral and confirming that non-bank lessors can still access competitive capital markets funding. That matters because the next wave of competition is forming around embedded leasing, green asset financing, and mid-market programs that need both rapid approval and durable funding. The Finance lease market is also opening up more space in SME digital origination, renewable asset leasing, and manufacturer-aligned solutions for OEMs without their own captive finance arms. Overall, the competitive field remains active rather than closed, but firms that combine capital strength with technology-led execution are best positioned to gain share.
Finance Lease Industry Leaders
BNP Paribas Leasing Solutions
Sumitomo Mitsui Finance and Leasing Co. Ltd
Wells Fargo Bank, N.A.
DLL Group
Societe Generale Equipment Finance
- *Disclaimer: Major Players sorted in no particular order

Recent Industry Developments
- June 2026: The European Investment Bank signed a EUR 200 million financing agreement with BNP Paribas Leasing Solutions to support SMEs and mid-cap companies in the agriculture and bioeconomy sectors across Europe. This transaction deepens the use of finance leases as a conduit for green and agricultural transition financing, leveraging BNP Paribas Leasing Solutions' EUR 38.8 billion managed portfolio.
- April 2026: Sumitomo Corporation, SMBC Aviation Capital, Apollo, and Brookfield completed the acquisition of Air Lease Corporation, renaming it Sumisho Air Lease Corporation. The USD 7.4 billion equity valuation, USD 28.2 billion including assumed debt, transfers Air Lease's full orderbook to SMBC Aviation Capital, expanding its committed aircraft count to 1,700 and new-technology orderbook to 420 aircraft valued at USD 26 billion.
- February 2026: DLL, the global asset finance company, announced a strategic partnership with BYD Europe to provide finance and operating leases for BYD electric trucks and buses across 9 European markets, including the Netherlands, Germany, France, and the United Kingdom. The deal extends DLL's green fleet financing capabilities to one of China's largest EV manufacturers.
- January 2026: DLL closed its first United States Asset-Backed Securitization of 2026, "DLLMT 2026-1," issuing notes totaling USD 672 million backed by loans and leases in construction, transportation, and industrial sectors. The transaction attracted new investors and demonstrated sustained ABS market appetite for diversified equipment lease collateral.


Global Finance Lease Market Report Scope
| Domestic Business |
| International Business |
| Machinery and Equipment |
| Vehicles |
| Aircrafts |
| IT, Technology and Office Equipment |
| Other Assets |
| Transportation and Logistics |
| Manufacturing |
| IT and Telecom |
| Construction and Infrastructure |
| Energy, Utilities and Renewables |
| Healthcare and Life Sciences |
| Retail, Wholesale and E-commerce |
| Public Sector and Government |
| Other Industry Segments |
| Bank-Owned / Bank-Affiliated Leasing Companies |
| Captive Finance Companies (Manufacturer-owned) |
| Independent Leasing Companies |
| Other NBFIs / Specialized Lessors |
| North America | United States |
| Canada | |
| Mexico | |
| South America | Brazil |
| Argentina | |
| Rest of South America | |
| Europe | United Kingdom |
| Germany | |
| France | |
| Italy | |
| Spain | |
| Rest of Europe | |
| Asia-Pacific | India |
| China | |
| Japan | |
| South Korea | |
| Australia | |
| South East Asia (Singapore, Malaysia, Thailand, Indonesia, Vietnam, and Philippines) | |
| Rest of Asia-Pacific | |
| Middle East and Africa | United Arab Emirates |
| Saudi Arabia | |
| South Africa | |
| Nigeria | |
| Rest of Middle East and Africa |
| By Business Mode | Domestic Business | |
| International Business | ||
| By Asset Type | Machinery and Equipment | |
| Vehicles | ||
| Aircrafts | ||
| IT, Technology and Office Equipment | ||
| Other Assets | ||
| By Industry | Transportation and Logistics | |
| Manufacturing | ||
| IT and Telecom | ||
| Construction and Infrastructure | ||
| Energy, Utilities and Renewables | ||
| Healthcare and Life Sciences | ||
| Retail, Wholesale and E-commerce | ||
| Public Sector and Government | ||
| Other Industry Segments | ||
| By Lessor Type | Bank-Owned / Bank-Affiliated Leasing Companies | |
| Captive Finance Companies (Manufacturer-owned) | ||
| Independent Leasing Companies | ||
| Other NBFIs / Specialized Lessors | ||
| By Geography | North America | United States |
| Canada | ||
| Mexico | ||
| South America | Brazil | |
| Argentina | ||
| Rest of South America | ||
| Europe | United Kingdom | |
| Germany | ||
| France | ||
| Italy | ||
| Spain | ||
| Rest of Europe | ||
| Asia-Pacific | India | |
| China | ||
| Japan | ||
| South Korea | ||
| Australia | ||
| South East Asia (Singapore, Malaysia, Thailand, Indonesia, Vietnam, and Philippines) | ||
| Rest of Asia-Pacific | ||
| Middle East and Africa | United Arab Emirates | |
| Saudi Arabia | ||
| South Africa | ||
| Nigeria | ||
| Rest of Middle East and Africa | ||


Key Questions Answered in the Report
What is the projected value of the finance lease space by 2031?
The draft places the finance lease market size at USD 3.13 trillion by 2031, up from USD 2.59 trillion in 2026, with a 3.9% CAGR over 2026-2031.
Which business mode leads current global volume?
Domestic business leads, with 76.12% of total volume in 2025, reflecting the importance of local underwriting, collateral recovery, and servicing.
Which asset category is growing the fastest through 2031?
Aircraft finance leases are the fastest-growing asset type in the draft, with a projected 6.04% CAGR through 2031.
Which end-use vertical is expanding the fastest?
Energy, utilities and renewables is the fastest-growing vertical, with a projected 6.89% CAGR through 2031 as developers use lease structures for low-carbon asset deployment.
Which region offers the strongest growth outlook?
The Middle East and Africa has the highest projected regional CAGR at 6.52% through 2031, supported by infrastructure, aviation, and equipment financing demand.
What is changing competition among lessors?
Bank-affiliated lessors still lead on scale, but independents are growing faster at 5.77% CAGR because speed, digital origination, and vendor-channel access are becoming more important.
Page last updated on:


