Micro Finance Market Size and Share
Market Overview
| Study Period | 2020 - 2031 |
|---|---|
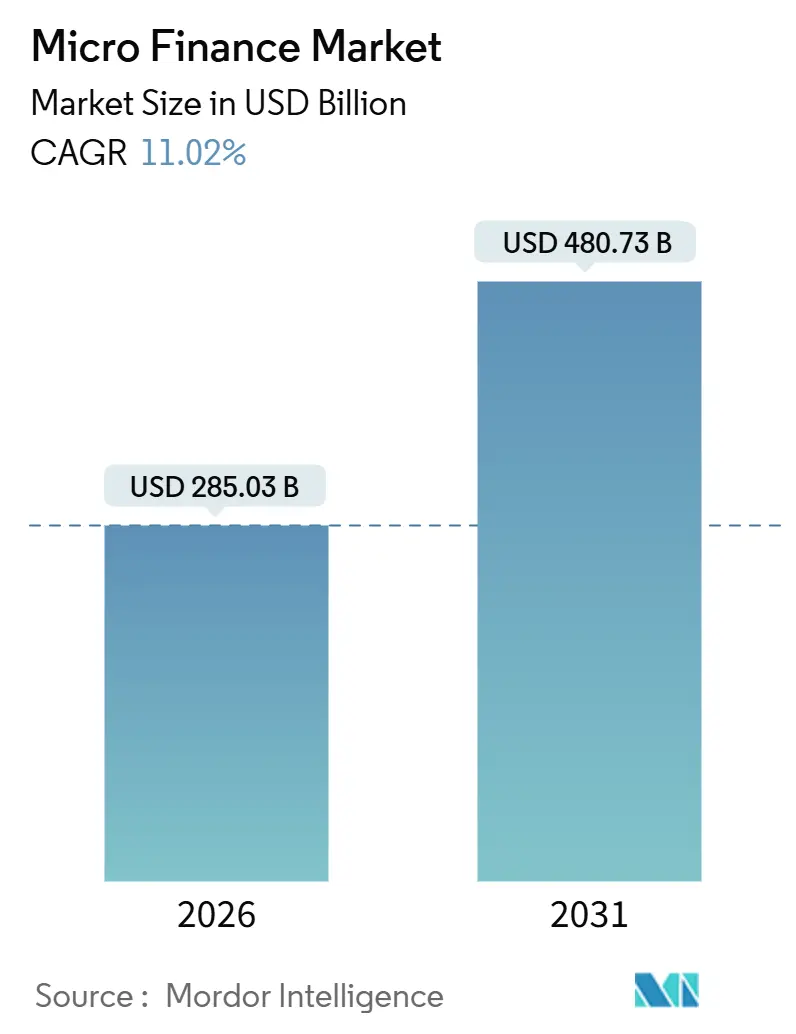
| Market Size (2026) | USD 285.03 Billion |
| Market Size (2031) | USD 480.73 Billion |
| Growth Rate (2026 - 2031) | 11.02% CAGR |
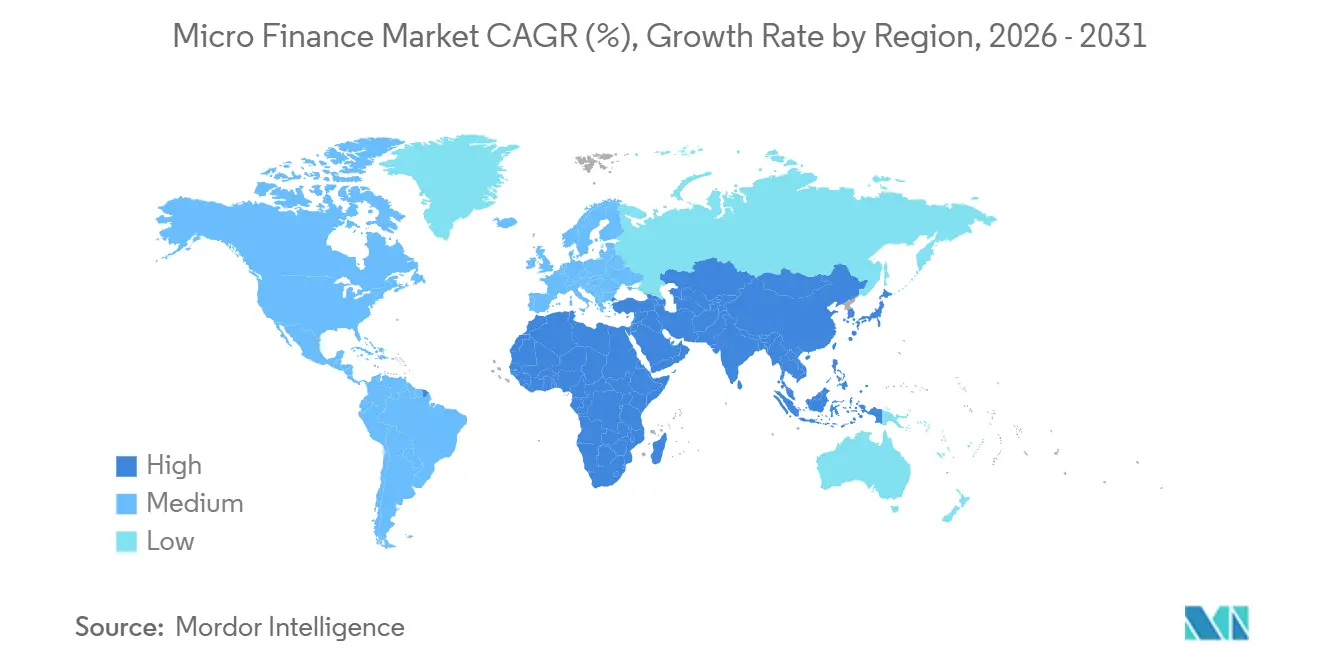
| Fastest Growing Market | Middle East and Africa |
| Largest Market | Asia Pacific |
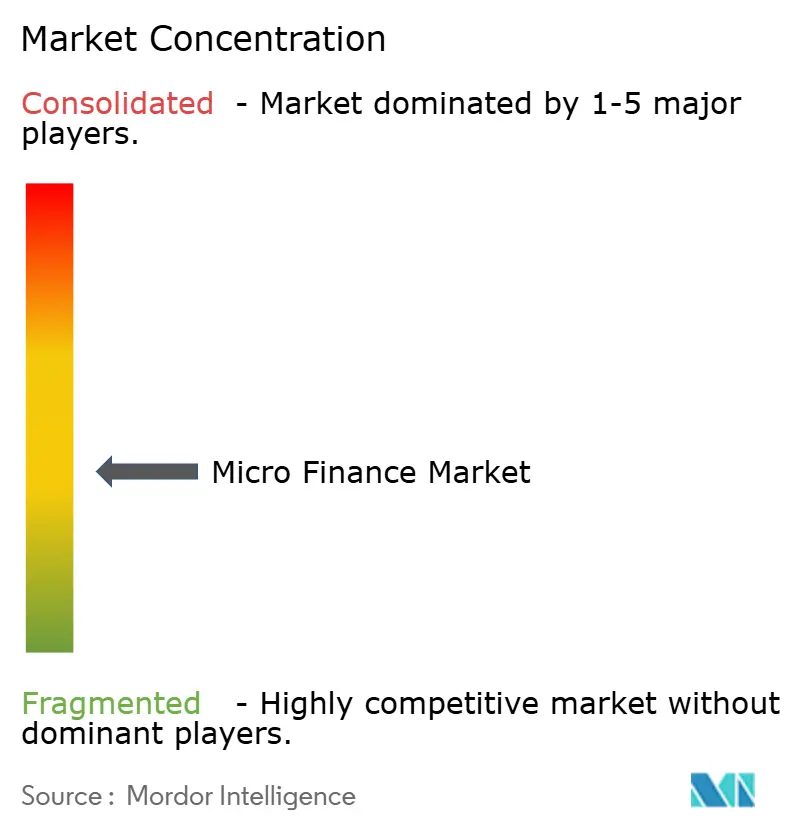
| Market Concentration | Medium |
Major Players *Disclaimer: Major Players sorted in no particular order Image © Mordor Intelligence. Reuse requires attribution under CC BY 4.0. | |
Micro Finance Market Analysis by Mordor Intelligence
The microfinance market reached USD 285.03 billion in 2026, and the market size is projected to reach USD 480.73 billion by 2031 at an 11.02% CAGR, reflecting stable demand for affordable small-ticket credit in developing regions. Government-backed digital identity systems, led by India’s Aadhaar enrollment for 1.2 billion residents, reduced know-your-customer costs by up to 80%, which expanded formal onboarding for first-time borrowers at scale[1]Unique Identification Authority of India, “Aadhaar Dashboard,” UIDAI, uidai.gov.in Rising smartphone and mobile penetration, with 2025 smartphone ownership at 68% and mobile access at 86%, shifted origination and servicing to digital channels that lower unit costs for micro-lenders. Asia-Pacific holds the largest regional presence, and the Middle East and Africa post the fastest growth, which aligns with mobile-money-led inclusion and targeted policy frameworks for inclusive finance. Lenders are using data-driven underwriting, hybrid delivery models, and partnerships with payment networks and commerce platforms to compress approval times and expand coverage to previously excluded micro-enterprises and low-income households.
Key Report Takeaways
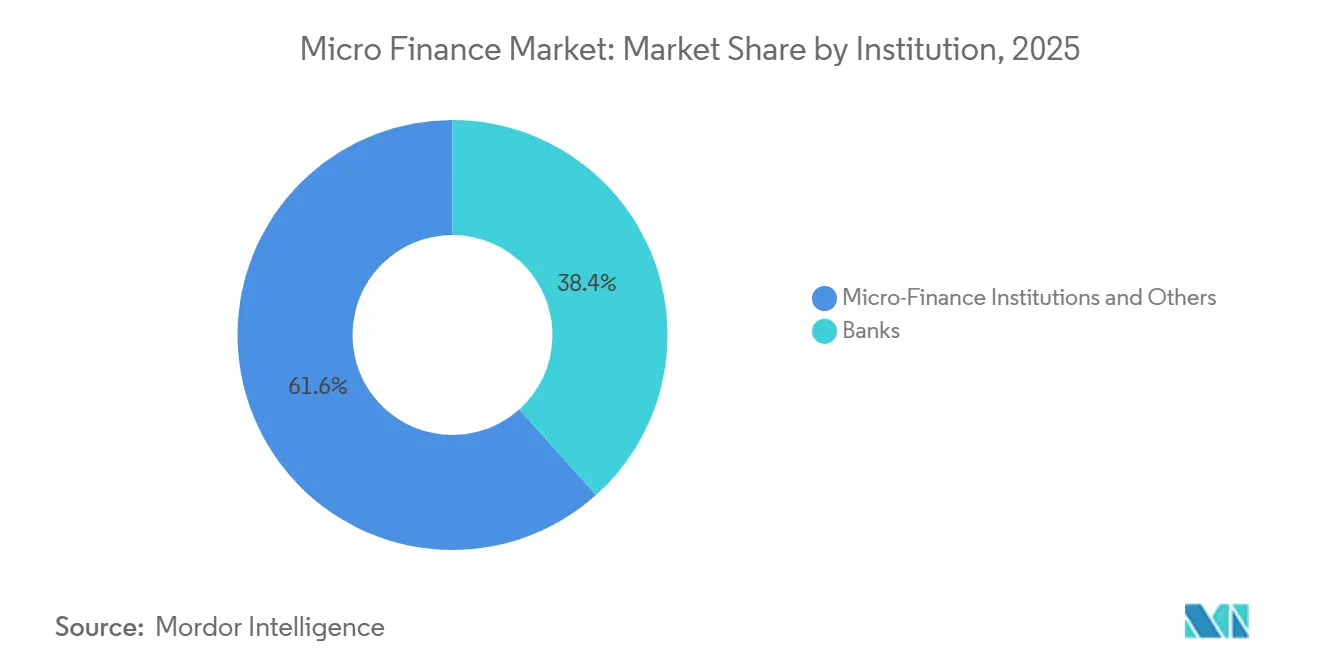
- By institution, microfinance institutions and others led with 61.64% of the microfinance market share in 2025. This segment is forecasted to expand at a 12.74% CAGR through 2031.
- By end-user, business borrowers accounted for a 66.28% share in 2025. Retail lending is projected to grow at an 11.56% CAGR through 2031.
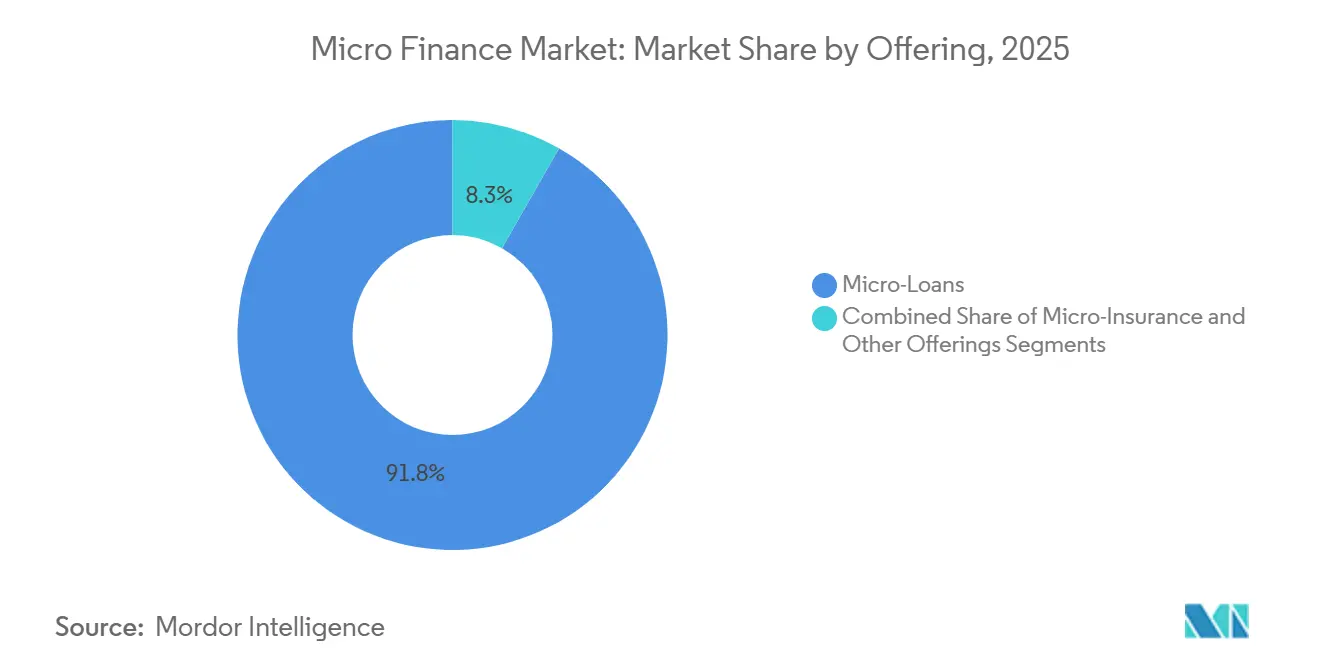
- By offering microloans, it commanded a 91.75% share in 2025. Micro-insurance is expected to grow at a 14.42% CAGR through 2031.
- By channel, offline accounted for a 68.43% share in 2025. Online is projected to expand at a 15.33% CAGR through 2031.
- By geography, Asia-Pacific led with a 44.31% share in 2025. The Middle East and Africa region is forecasted to grow at a 13.21% CAGR through 2031.
Note: Market size and forecast figures in this report are generated using Mordor Intelligence’s proprietary estimation framework, updated with the latest available data and insights as of January 2026.
Global Micro Finance Market Trends and Insights
Drivers Impact Analysis*
| Driver | (~) % Impact on CAGR Forecast | Geographic Relevance | Impact Timeline |
|---|---|---|---|
| Government-led financial inclusion programs | 2.1% | Global, with concentrated gains in South Asia (India's Jan Dhan accounts surpassed 500M), East Africa (Ethiopia's mobile-money accounts grew tenfold), and Latin America (Colombia's Banca de las Oportunidades) | Medium term (2-4 years) |
| Digital/mobile penetration lowers servicing costs | 2.8% | Asia-Pacific (smartphone penetration >70% in 2025), Sub-Saharan Africa (mobile-money transactions 40% of adults), Southeast Asia (Indonesia fintech revenue USD 8.6B by 2025) | Short term (≤ 2 years) |
| Rising unmet MSME credit demand | 2.3% | Global - USD 5.7T gap across 119 EMDEs; particularly acute in South Asia (India), Sub-Saharan Africa (Nigeria USD 32.2B gap), and the Middle East (Pakistan USD 6B shortfall) | Long term (≥ 4 years) |
| Securitization & impact-investing inflows into microloan assets | 1.5% | Latin America (USD 2.74B blue-bond issuance 2023), Europe (ESG-aligned capital pools), Asia-Pacific (Accion Ventures USD 61.6M Fund II closure Sept 2025) | Medium term (2-4 years) |
| Embedded finance via B2B commerce platforms | 1.6% | North America and EU (mature fintech ecosystems), Asia-Pacific early movers (UPI-linked merchant flows in India), emerging adoption in Africa/Middle East (projected USD 40B by 2029) | Long term (≥ 4 years) |
| Climate-resilience & green microfinance products | 0.9% | Sub-Saharan Africa (80% marginal farmers face yield losses), Latin America (Nicaragua's Financiera FDL USD 2.4M green portfolio by 2026), South Asia (Incofin Climate-Smart Fund USD 550M over 5 years) | Medium term (2-4 years) |
| Source: Mordor Intelligence | |||
Government-Led Financial Inclusion Programs Propel Formal Account Penetration
By 2024, formal account ownership reached 75% in low and middle-income economies, and expanded nationwide digital identity and direct benefit transfer schemes reduced onboarding frictions for microfinance borrowers in underserved regions[2]Asad Islam, “Global Findex Database 2024,” The World Bank, worldbank.org. Aadhaar enrollment now covers 1.2 billion residents in India, and enabled microfinance institutions to compress KYC cost and verify borrower identity faster at the point of application. Jan Dhan financial inclusion accounts crossed 500 million, and digitized benefit transfer rails created transaction histories that alternative credit scoring models can parse for thin-file borrowers. Governments in Africa and Latin America backed interoperable payment and identity systems, which improved the reliability of borrower verification and reduced paperwork burdens for microfinance portfolios. These policy-led rails strengthen formalization, allow faster onboarding in rural districts, and expand the microfinance market through lower compliance overhead at origination and servicing.
Digital and Mobile Penetration Compress Operating Costs, Unlocking Remote Reach
Global smartphone ownership passed 68% in 2025, and mobile penetration reached 86%, which turned handsets into all-in-one channels for application, disbursement, and repayment in the microfinance market. A leading example showed 98% retail transactions conducted digitally by October 2025, which reduced per-customer service costs and improved portfolio monitoring at scale. Unified real-time payment systems now help lenders automate KYC, biometrics, and instant credit disbursals that reach remote borrowers who lack access to physical branches. In Southeast Asia, super-apps use digital wallets to integrate micro-savings and small-ticket loans for underbanked users, while lenders deploy hybrid models that blend chatbot onboarding with human support for complex cases. These delivery models improve satisfaction and cut marginal costs per loan, which builds room for institutions to serve sub-USD 200 tickets without compromising service quality in the microfinance market.
Unmet MSME Credit Demand Sustains Structural Growth Despite Cyclical Headwinds
A persistent USD 5.7 trillion financing gap across 119 emerging and developing economies indicates a long-term runway for MSME-focused portfolios in the microfinance market. Women-owned MSMEs comprise USD 1.9 trillion of the shortfall and are now a priority segment for gender-lens lending that pairs capital with business training and collateral-light underwriting. India reported 6.2 crore registered MSMEs by 2025, and formal credit penetration for small and micro units remains low, which sets the stage for portfolio growth as digital footprints expand. Nigeria’s MSME credit shortfall near USD 32.2 billion reflects large informal merchant bases, and fintech-MFI partnerships are using alternative data from payments and utilities to underwrite without traditional collateral in the microfinance market. Multilateral programs such as the World Bank’s 2025 MSME access projects in Pakistan and Uzbekistan demonstrate continued policy support to mobilize private capital for small business lending.
Securitization and Impact-Investing Capital Smooth Funding Volatility
Impact investors and specialist funds are channeling capital toward micro-loan assets and inclusive fintech, which helps balance pro-cyclical bank funding in the microfinance market. Accion Ventures closed a USD 61.6 million Fund II in September 2025 to back distribution technology that embeds micro-lending into marketplaces and ecommerce platforms. Incofin’s Climate-Smart Microfinance Fund plans to invest USD 550 million over five years across more than 50 institutions, with a focus on climate adaptation and renewable solutions for low-income borrowers. India’s NBFC-MFI funding fell 54% year-over-year in Q4 FY25 as bank credit fell 38% to INR 57,000 crore (USD 6.9 billion), which pushed smaller players to scale back originations and exit marginal areas. Structured social loans, securitizations, and development finance lines are enabling better-capitalized institutions to manage liquidity cycles and sustain growth.
Restraints Impact Analysis*
| Restraint | (~) % Impact on CAGR Forecast | Geographic Relevance | Impact Timeline |
|---|---|---|---|
| High effective interest rates & borrower over-indebtedness | -2.3% | Global, acute in India, Bangladesh, Sub-Saharan Africa | Short term (≤ 2 years) |
| Complex & evolving regulatory compliance requirements | -1.1% | Global, particularly stringent in India, EU, North America | Medium term (2-4 years) |
| Tightening wholesale funding from mainstream banks post-COVID | -0.8% | Global, with severe impact in emerging markets | Medium term (2-4 years) |
| Data-privacy & cybersecurity concerns in digital channels | -0.6% | Global, particularly acute in digitally advanced markets | Short term (≤ 2 years) |
| Source: Mordor Intelligence | |||
High Interest Rates and Over-Indebtedness Drive Portfolio-Quality Deterioration
India’s microfinance gross non-performing assets rose to 16% in fiscal 2025, and portfolio-at-risk in the 31–180 bucket increased, which pressured capital and slowed originations among smaller lenders. Credit costs for NBFC-MFIs climbed, and write-offs and stress sales increased as institutions cleaned legacy books and refocused on secured lending. One leading bank sold INR 6,872 crore (USD 828.0 million) of NPAs for INR 902 crore (USD 108.7 million) in December 2025 to accelerate balance sheet repair and pivot to asset-backed exposure. Multi-borrowing risks peaked in select Indian states where a sizable share of clients held four or more active loans, which amplified delinquency during income shocks. Effective rates of 18–24% in India and higher in some African markets invited policy scrutiny, which tightened collection conduct rules and emphasized borrower protection.
Regulatory Complexity Reshapes Institutional Conduct and Portfolio Composition
State-level restrictions in India disrupted collections in early 2025, and national guardrail changes in April 2025 capped active lenders per client at three and introduced a stricter debt-to-income test. Embargoes were lifted for specific lenders in early 2025 after compliance improvements, which illustrated how regulatory actions can trigger sharp swings in growth trajectories for microfinance market participants. A June 2025 circular revised the qualifying-asset criteria from 75% to 60% for NBFC-MFIs, which enabled diversification into secured MSME and gold-backed lending. In the European Union, DORA and NIS2 brought bank-grade digital resilience standards to smaller lenders, which increased cyber and third-party risk management costs in digital channels. Regulatory harmonization on green disclosures and parametric insurance remains incomplete in several markets, which delays international capital access for climate-linked micro-loan portfolios.
*Our forecasts treat driver/restraint impacts as directional, not additive. The impact forecasts reflect baseline growth, mix effects, and variable interactions.
Segment Analysis
By Institution: MFIs Exploit Cost Advantage; Banks Leverage Scale
Microfinance institutions and others held a 61.64% share in 2025 and are projected to grow at a 12.74% CAGR through 2031, which reflects field distribution and a cost-to-income edge versus universal banks in the microfinance market. India’s NBFC-MFIs accounted for the largest lender type by gross loan portfolio in late 2024, followed by banks and small finance banks, which shows specialization advantages in joint-liability and rural reach. Banks faced steeper asset-quality volatility during 2025 because NBFC-MFIs executed faster write-offs and sales to asset reconstruction companies, which compressed reported GNPA. A 2025 rule change that revised qualifying asset criteria from 75% to 60% allowed MFIs to expand into gold-backed loans and secured MSME term finance, which reduced risk concentration and diversified revenue. Small finance banks blended deposit franchises with micro-lending DNA and reported strong deposit and loan growth, which improved funding stability and credit delivery in the microfinance market.
MFIs maintain a 10–15 percentage-point cost-to-income advantage over banks, which supports faster growth in districts where branch density and income documentation remain limited. Deposit-taking banks retain lower-cost funding and central-bank refinance access, which helps them scale secured credit and absorb cyclical stress with smaller margin compression. A leading small finance bank filed for a universal license in early 2025 and reported Q3 FY26 deposits at INR 42,219 crore (USD 5.1 billion) and loans at INR 37,055 crore (USD 4.5 billion), which signals maturation of the model. The microfinance industry adapts by segmenting risk more tightly and by using blended analytics to balance unsecured and secured exposure across borrower cohorts. Data-driven underwriting spreads faster among MFIs than legacy banks, and it helps narrow turnaround time to disbursal across the microfinance market.


By End-User: Business Demand Dominates; Retail Segment Accelerates via Women Borrowers
Business borrowers accounted for 66.28% of end-user demand in 2025, and unmet MSME credit needs continue to anchor a large share of originations for the microfinance market. Women-owned MSMEs hold USD 1.9 trillion of the global shortfall, and targeted lending programs link credit with training and flexible repayment aligned to cash flows. India lists 6.2 crore registered MSMEs with high acceptance of digital payments, yet formal credit penetration in small and micro units remains low and creates room for portfolio deepening. Nigeria’s MSME credit gap is near USD 32.2 billion, and Pakistan’s dedicated inclusion projects show policy focus on sustainable small-business finance. Alternative data from POS terminals and utility histories now supports thin-file underwriting that broadens coverage for merchants and gig workers in the microfinance market.
Retail consumer borrowing is growing at an 11.56% CAGR through 2031, propelled by the high share of women borrowers and wider adoption of mobile money in Sub-Saharan Africa. Most microfinance loans in India are still used for income-generating activities such as petty retail, livestock, and home production, which aligns repayment with business cash flows. Household-purpose loans represent a smaller share and typically carry tighter eligibility checks to limit repayment stress in vulnerable segments. Average ticket size climbed to INR 53,776 (USD 647.9) by December 2024, which indicates a shift toward higher-value loans for repeat borrowers who built repayment records. Rural borrowers accounted for a rising share of clients, and lenders offset climate and commodity shocks with parametric insurance and sectoral diversification in the microfinance market.
By Offering: Micro-Loans Anchor Portfolios; Micro-Insurance Scales on Mobile Distribution
Microloans represented 91.75% of offerings in 2025 and support working capital and livelihood assets that use weekly or monthly repayment cycles in the microfinance market. India’s gross microfinance loan portfolio reached INR 3.81 lakh crore (USD 45.9 billion) as of March 2025, and the sector right-sized after funding and regulatory changes constrained originations through fiscal 2025. Average ticket size increased, and loans above INR 1 lakh gained share for seasoned borrowers after a period of asset-quality stress. Micro-insurance is growing at a 14.42% CAGR through 2031, and mobile-enabled premium collection and parametric triggers shorten claims cycles and improve policy retention. Global coverage expanded significantly by 2024, and health-related lines rose as out-of-pocket medical costs increased alongside targeted public subsidies.
The microfinance market size for micro-insurance is projected to expand at a 14.42% CAGR through 2031 as mobile distribution scales outreach beyond branch footprints. Property and index-based agricultural coverage use satellite and sensor triggers to automate payouts and remove manual adjudication delays that historically undermined trust. Cooperatives and MFIs distribute weather-index products to smallholder farmers in Asia and Africa to protect seasonal cash flows and stabilize borrower resilience. Gig workers in cities adopt accident and disability add-ons priced at low monthly premiums that are bundled into wallets, which supports new coverage in excluded segments. Regulators are moving toward green and parametric reporting standards, but gaps in definitions and metrics still limit the scale of international capital dedicated to these offerings.

By Channel: Offline Trust Sustains Majority Share; Online Velocity Reshapes Economics
Offline channels held 68.43% share in 2025, sustained by in-person verification and joint-liability meetings that build trust in low-literacy segments in the microfinance market. Indian lenders operated more than 37,000 branches and deployed significant field teams, which ensured proximity and monitoring but added fixed costs to the operating model. Social-collateral lending performs best in cohesive communities, and it maintains discipline in repayment where formal collateral is scarce. Online channels are projected to grow at a 15.33% CAGR through 2031, and credit scoring models powered by alternative data helped cut approval times from days to hours. The mix is shifting toward mobile-enabled origination and servicing as biometric authentication, instant KYC, and real-time disbursal ride on national payment rails.
The microfinance market size for online channels is projected to expand at a 15.33% CAGR as hybrid delivery blends digital onboarding with human support for complex queries. One large Indian lender disclosed 98% digital retail transactions by October 2025, which allowed earlier detection of delinquency risks and proactive customer engagement. Digital-only services can suffer lower satisfaction and transparency in fees, and lenders that retain human touchpoints report stronger comprehension and outcomes for borrowers. Digital collection of micro-insurance premiums and small amortizing payments expands coverage by allowing tiny installments through mobile money. A design that emphasizes clear consent and privacy standards builds trust at origination and supports retention as channels shift toward digital in the microfinance market.
Geography Analysis
Asia-Pacific held a 44.31% share in 2025, driven by India’s MSME base and China’s inclusive finance programs that direct quotas for small-ticket rural credit in the microfinance market. India’s microfinance gross loan portfolio stood at INR 3.81 lakh crore (USD 45.9 billion) as of March 2025, while regulatory tightening in 2025 limited overleveraged borrower exposures and slowed new disbursals. Southeast Asian markets benefit from digital wallets and super-apps that link payments with small-ticket credit for merchants and households. Transaction data from e-commerce and remittance platforms enables microlending to thin-file merchants, which expands product reach without branch buildouts. Regional growth is reinforced by open payment rails and sandbox programs that support partnerships between MFIs and fintech in the microfinance market.
The Middle East and Africa region is forecast to grow at a 13.21% CAGR through 2031 as mobile-money adoption supports layered products such as micro-credit and insurance. A high share of adults in Sub-Saharan Africa hold only mobile-money accounts, which positions providers to integrate credit and savings services into everyday payment flows[3]The World Bank, “Financial Inclusion in Sub-Saharan Africa 2024,” The World Bank, worldbank.org. Kenya, Ghana, and Uganda show strong uptake of mobile-led borrowing, and digital-first products dominate where branches are sparse and connectivity is high. Nigeria’s MSME financing gap of USD 32.2 billion remains a priority for alternative-data underwriting that can score informal enterprises in the microfinance market. Islamic finance shapes product design in the Gulf Cooperation Council, and profit-and-loss sharing contracts attract Sharia-compliant capital with asset-backed structures.
Latin America channels institutional appetite for impact through microfinance-linked structures, while Brazil and Mexico attract the majority of venture funding that flows to inclusive fintech. Mobile-money account use rose through 2024 in the region, and formal savings via mobile wallets expanded as regulatory frameworks matured. Longstanding providers in Mexico and Bolivia evolved into regulated entities that blend financial inclusion aims with shareholder return targets in the microfinance market. Targeted public programs in Colombia reinforced financial inclusion through policy alignment that is resilient to donor cycles. North America’s inclusion finance is anchored by community development lenders and specialized programs that evaluate small-business applicants for fair lending outcomes, while compliance standards for data collection are phased in through 2026 and 2027.

Competitive Landscape
The microfinance market remains moderately fragmented, and top players do not hold pricing power across all geographies, which encourages local specialization and technology-led differentiation. Better-capitalized institutions used securitization and international social loans to offset domestic funding volatility during fiscal 2025, and smaller lenders slowed new originations to preserve liquidity[4] CreditAccess Grameen, “USD 100 Million Social Loan Announcement,” CreditAccess Grameen, creditaccessgrameen.in. AI-driven credit scoring reduced approval times from 12 days to 2.5 days in 2026 for leading adopters, which improved unit economics for small-ticket loans. Blockchain-based identity pilots lowered KYC processing time and improved privacy controls for digital onboarding as cyber rules tightened. Embedded-finance partnerships with agri-input suppliers and B2B marketplaces expanded point-of-sale credit offers that leverage payment histories for underwriting in the microfinance market.
A leading bank executed a sale of INR 6,872 crore (USD 828.0 million) NPAs for INR 902 crore (USD 108.7 million) in December 2025, and shifted toward asset-backed exposure to stabilize returns. A small finance bank applied for a universal banking license in early 2025, which would broaden product authority and lower capital charges if approved. MFIs rebalanced unsecured portfolios by introducing gold-backed loans that scale with existing branch networks and de-risk exposure as macro pressures persisted. Social loan facilities and DFI lines supported issuance for top-tier credits that maintained governance standards and public reporting in the microfinance market.
White-space opportunities cluster around climate resilience, women-owned MSMEs, and gig-worker protection, and lenders are piloting parametric insurance and embedded accident coverage to address these gaps. A South African digital bank reached unicorn valuation at USD 1.5 billion in December 2024 and scaled to 11 million customers using zero-fee digital accounts and embedded micro-insurance. International networks plan new country coverage in 2025 and 2026 as they extend lines to inclusive finance partners and target large MSME credit gaps. Standard-setting by regional associations framed microfinance as a climate tool and attracted ESG-linked capital that reduces the cost of funds relative to untargeted portfolios in the microfinance market. These shifts reinforce a move from access-only expansion to outcomes-focused resilience that pairs digital infrastructure with prudential oversight and impact capital.
Micro Finance Industry Leaders
Annapurna Finance
BSS Microfinance Limited
Asirvad Microfinance Limited
Bandhan Bank
CreditAccess Grameen Limited
- *Disclaimer: Major Players sorted in no particular order

Recent Industry Developments
- December 2025: The World Bank approved a USD 100 million loan and a USD 5 million grant for Uzbekistan’s Access to Finance for Jobs and Growth Project, launching a new access-to-finance program that aims to mobilize an additional USD 500 million by 2030.
- November 2025: Oikocredit announced plans to add Panama to its focus countries in Latin America and the Caribbean and approved a new credit line in 2025 with additional loans in 2026, marking a geographic expansion.
- September 2025: Accion Ventures closed a USD 61.6 million Fund II to invest in inclusive fintechs that embed micro-lending, which represents a new fund launch and an expansion of available venture capital for the sector.
- September 2025: Incofin’s Climate-Smart Microfinance Fund announced plans to invest USD 550 million over five years across more than 50 microfinance institutions, signaling the launch and scale-up of a climate-focused financing vehicle.


Research Methodology Framework and Report Scope
Market Definitions and Key Coverage
Our study defines the microfinance market as all revenue earned from the extension of micro-loans, micro-savings, micro-insurance, and closely allied digital services that target low-income individuals, micro enterprises, and self-help groups through regulated banks, licensed micro-finance institutions, and non-bank finance companies. According to Mordor Intelligence, values are reported in nominal USD and cover 2019 through 2030, with the current baseline pegged at USD 256.74 billion for 2025.
Scope exclusion: Products that mimic payday lending, informal rotating savings clubs, or pure remittance platforms without credit intermediation remain outside the definition.
Segmentation Overview
- By Institution
- Banks
- Micro-Finance Institutions (MFIs) and Others
- By End-Users
- Businesses
- Retail (Consumers)
- By Offering
- Micro-Loans
- Micro-Insurance
- Other Offerings
- By Channel
- Online
- Offline
- By Region
- North America
- United States
- Canada
- Mexico
- South America
- Brazil
- Argentina
- Chile
- Colombia
- Rest of South America
- Europe
- United Kingdom
- Germany
- France
- Spain
- Italy
- Benelux (Belgium, Netherlands, and Luxembourg)
- Nordics (Sweden, Norway, Denmark, Finland, and Iceland)
- Rest of Europe
- Asia-Pacific
- China
- India
- Japan
- South Korea
- Australia
- South-East Asia (Singapore, Indonesia, Malaysia, Thailand, Vietnam, and Philippines)
- Rest of Asia-Pacific
- Middle East and Africa
- United Arab Emirates
- Saudi Arabia
- South Africa
- Nigeria
- Rest of Middle East and Africa
- North America
Detailed Research Methodology and Data Validation
Primary Research
Mordor analysts conduct interviews and structured surveys with field officers of MFIs, deposit-taking banks, fintech lenders, and credit bureau executives across Asia, Africa, and Latin America. These discussions validate penetration assumptions, interest-rate spreads, and delinquency trends that are hard to capture in public statistics.
Desk Research
We start with structured desk research that maps the size of potential borrower pools, funding flows, and service provider footprints using open sources such as the World Bank Global Findex, IMF Financial Access Survey, the Consultative Group to Assist the Poor, and national central-bank microcredit registries. Company filings, investor presentations, and reputable press articles supply recent disbursement volumes and average ticket sizes, while paid resources like D&B Hoovers and Dow Jones Factiva help us reconcile revenue streams and geographic mixes. A wide sweep of trade journals, patent alerts via Questel, and aid-agency tenders further clarifies technology adoption and donor funding. The sources listed are illustrative, not exhaustive, and many additional references underpin the dataset.
Market-Sizing & Forecasting
A top-down construct links borrower headcount, average loan balance, and ancillary fee pools to derive gross market value, which is then sanity-checked through selective bottom-up supplier roll-ups and sampled average-selling-price times volume estimates. Key variables include smartphone penetration, women's self-help group growth, gross domestic product per capita, non-performing loan ratios, regulatory interest-rate caps, and concessional funding inflows. Multivariate regression, supported by expert consensus on the driver trajectories, underpins the 2025-2030 forecast, and gaps in bottom-up coverage are bridged by calibrated penetration factors.
Data Validation & Update Cycle
Every model pass is subjected to variance checks against historical series, peer disclosures, and trade data. Outliers trigger a second round of analyst review before sign-off. The report is refreshed annually, with interim updates when new regulation or macro shocks shift the outlook, ensuring clients receive a current and balanced view.
Why Our Micro Finance Baseline Commands Reliability
Published estimates often diverge because firms anchor on different revenue mixes, service scopes, and exchange-rate cut-offs before projecting varied growth paths.
Key gap drivers include wider inclusion of micro-savings by some publishers, exclusion of micro-insurance by others, one-off donor grant inflows that inflate toplines, and the use of static 2023 currency rates rather than rolling averages. Mordor's disciplined scope alignment, dual validation loop, and yearly refresh mitigate these distortions.
Benchmark comparison
| Market Size | Anonymized source | Primary gap driver |
|---|---|---|
| USD 256.74 B (2025) | Mordor Intelligence | - |
| USD 310.10 B (2025) | Global Consultancy A | Includes micro-savings balances and applies high loan growth assumed uniformly across regions |
| USD 239.09 B (2025) | Trade Journal B | Excludes micro-insurance revenues and relies on historic CAGR extension without primary validation |
| USD 255.69 B (2025) | Industry Consultancy C | Uses fixed 2023 FX rates and omits informal online lenders from Asia-Pacific share |
Recent public releases show figures spanning USD 239.09 billion to USD 310.10 billion for 2025. The comparison highlights that, while totals differ, Mordor's variable-based model and transparent driver set offer a balanced, reproducible baseline that decision-makers can trace back to clear assumptions and refresh cycles.


Key Questions Answered in the Report
What is the current size and growth outlook for the microfinance market?
The microfinance market reached USD 285.03 billion in 2026 and is projected to hit USD 480.73 billion by 2031 at an 11.02% CAGR.
Which region leads in the microfinance market and which grows fastest?
Asia-Pacific leads with 44.31% share in 2025, while the Middle East and Africa are the fastest growing at a 13.21% CAGR through 2031.
Which customer group drives most demand in microfinance?
Business borrowers held 66.28% of end-user demand in 2025, while retail shows the fastest growth at an 11.56% CAGR to 2031.
Which products and channels are most important in microfinance today?
Micro-loans accounted for 91.75% of offerings in 2025, and offline channels held 68.43% share, while micro-insurance and online channels recorded the fastest growth.
How is regulation affecting the microfinance market in India?
Guardrail 2.0, introduced in April 2025, capped active lenders per borrower and tightened debt-to-income checks, while a June 2025 circular allowed NBFC-MFIs to diversify into secured assets.
What role does embedded finance play in micro-lending expansion?
Embedded finance lowers acquisition costs and uses payment histories to underwrite micro-credit at the point of sale, which improves unit economics for sub-USD 500 tickets.
Page last updated on:


