Fillings And Toppings Market Size and Share
Market Overview
| Study Period | 2020 - 2030 |
|---|---|
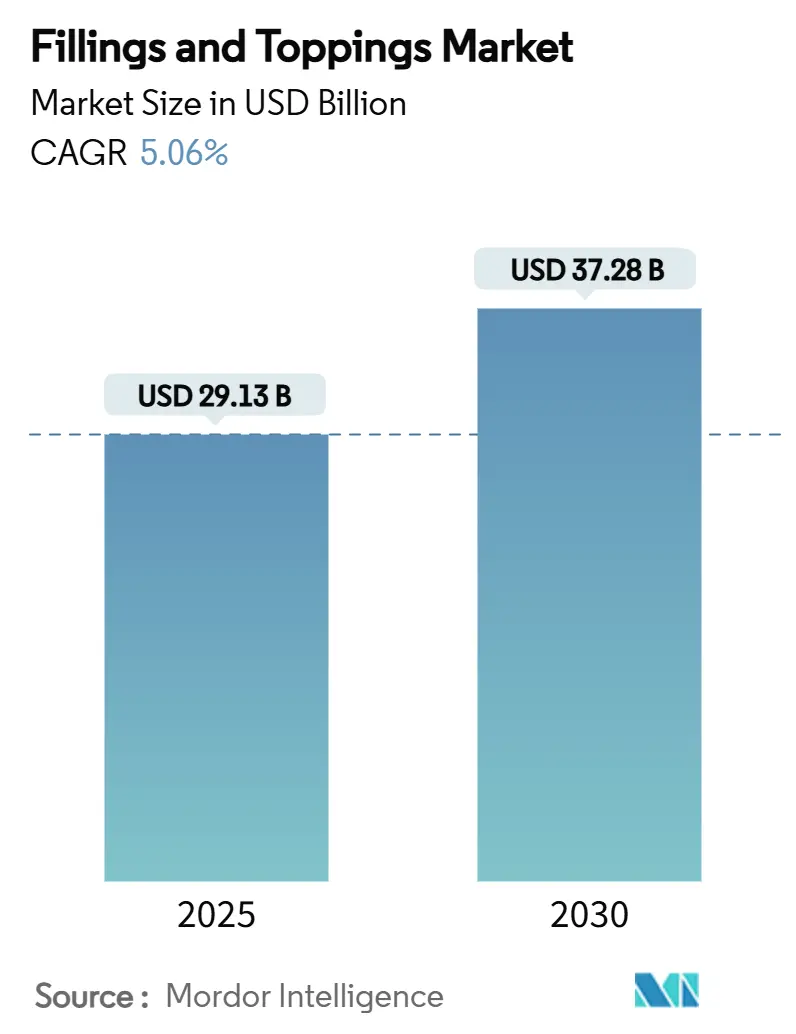
| Market Size (2025) | USD 29.13 Billion |
| Market Size (2030) | USD 37.28 Billion |
| Growth Rate (2025 - 2030) | 5.06% CAGR |
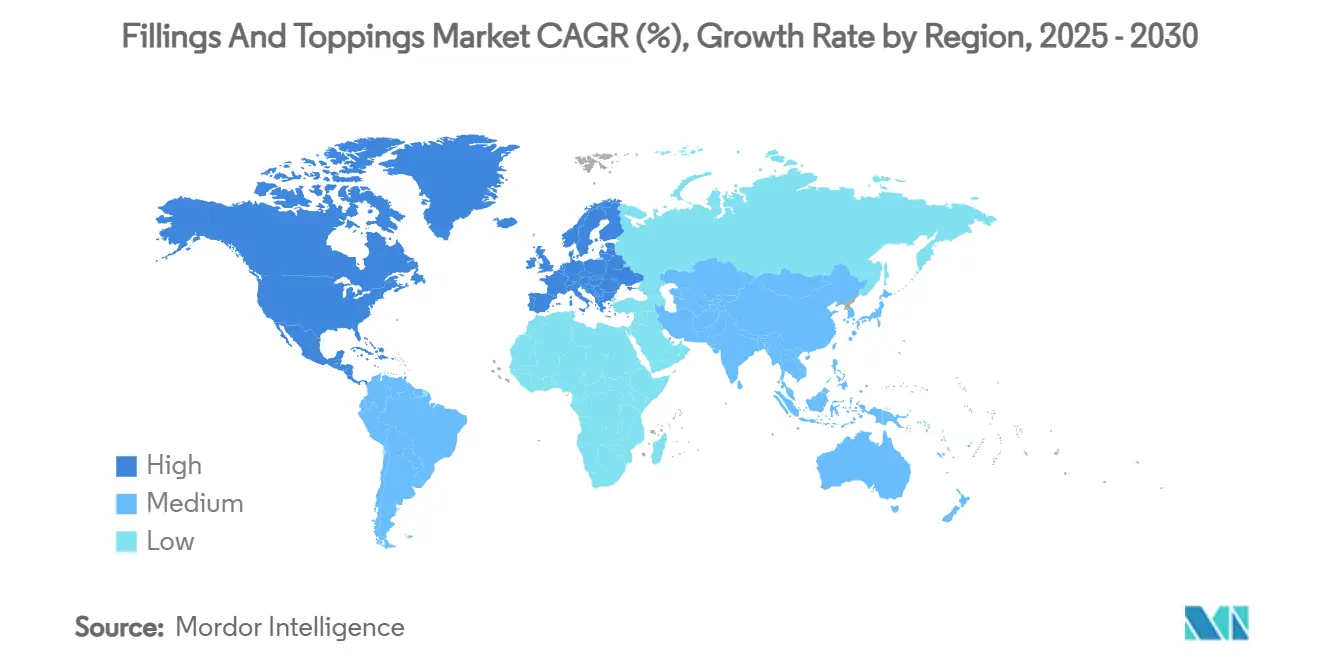
| Fastest Growing Market | Asia Pacific |
| Largest Market | Europe |
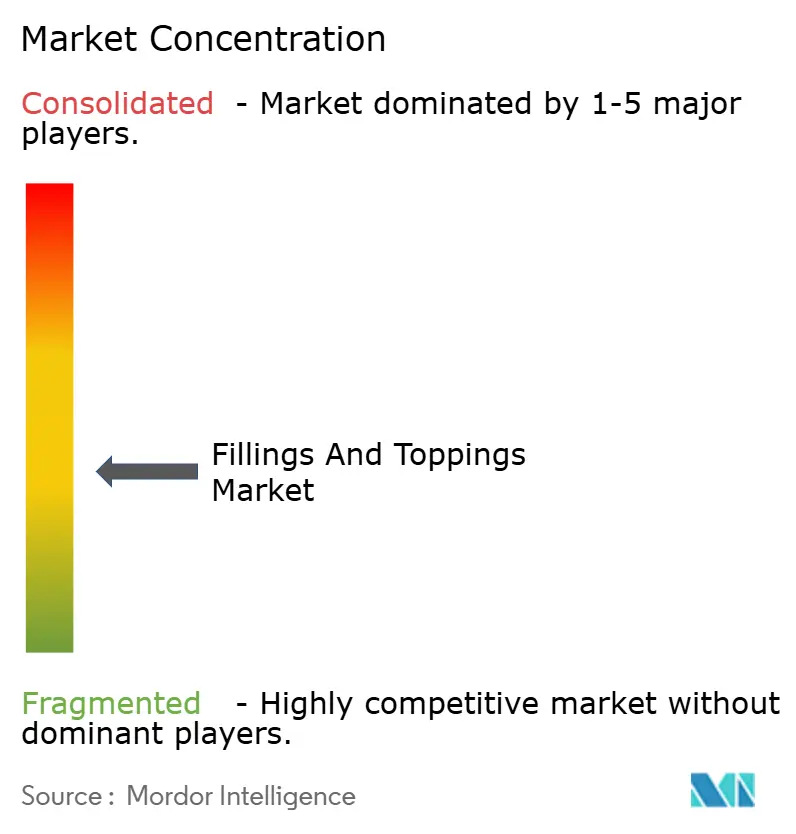
| Market Concentration | Medium |
Major Players
*Disclaimer: Major Players sorted in no particular order Image © Mordor Intelligence. Reuse requires attribution under CC BY 4.0. |
|
Fillings And Toppings Market Analysis by Mordor Intelligence
The fillings and toppings market size stands at USD 29.13 billion in 2025 and is forecast to reach USD 37.28 billion by 2030, progressing at a 5.06% CAGR over the period. Robust demand from bakery, confectionery, and dairy processors, coupled with rapid product launches that emphasize clean labels, convenience, and premium flavors, positions the fillings and toppings market for steady expansion. In line with this, an increased production of respective product types is supporting the usage of fillings and toppings, driving the market's growth. For instance, according to Statistics Malaysia, in 2024, around 140,000 metric tons of biscuits were produced in Malaysia. This indicated an increase in production volume for biscuits, when around 124,000 metric tons being produced in 2023[1]Source: All Nippon Kashi Association (Japan), "Confectionery data 2024", www.anka-kashi.com. Europe continues to provide a secure revenue base, but dynamic urbanization, a swelling middle class, and growing e-commerce adoption in Asia-Pacific now anchor the next wave of growth. Intensifying vertical integration, rising plant-based innovation, and the growing influence of precision-fermentation ingredients further shape competitive behavior within the fillings and toppings market. However, raw-material price swings, especially for eggs and cocoa, and tight food-safety regulations raise cost structures, making supply-chain agility and risk hedging core strategic priorities.
Key Report Takeaways
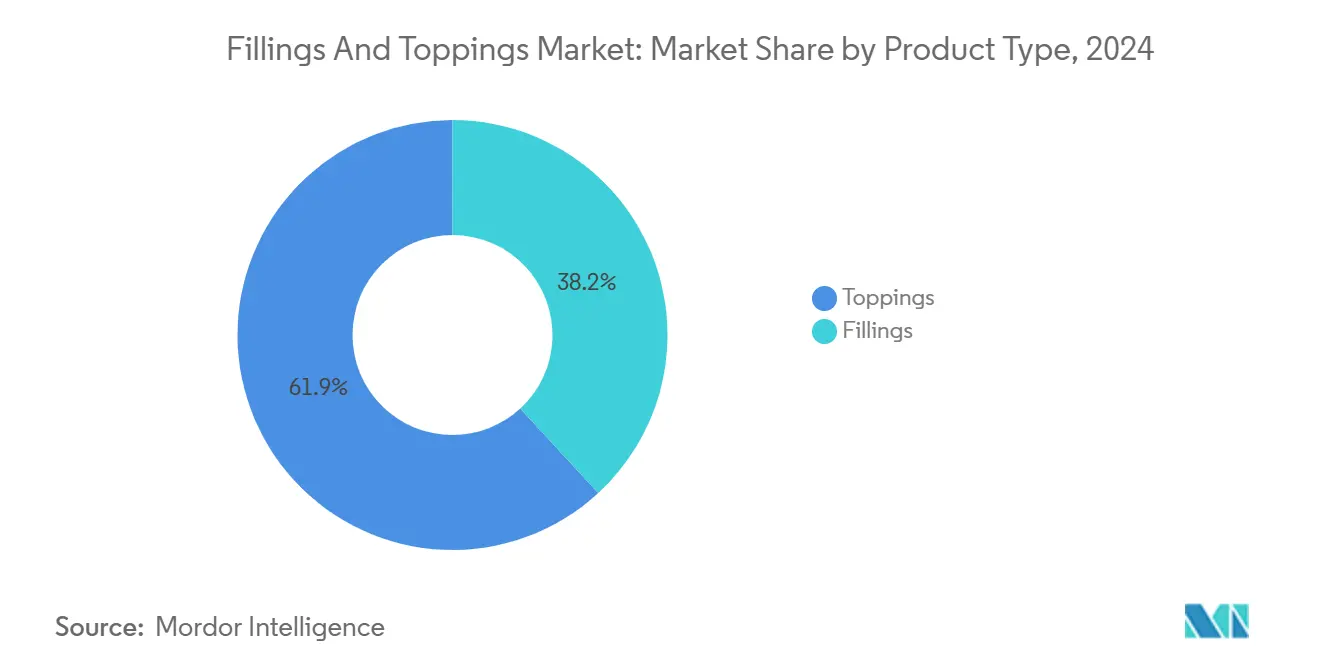
- By product category, toppings accounted for 61.85% of the fillings and toppings market share in 2024. Fillings are projected to expand at a 5.65% CAGR through 2030, the quickest pace among product categories.
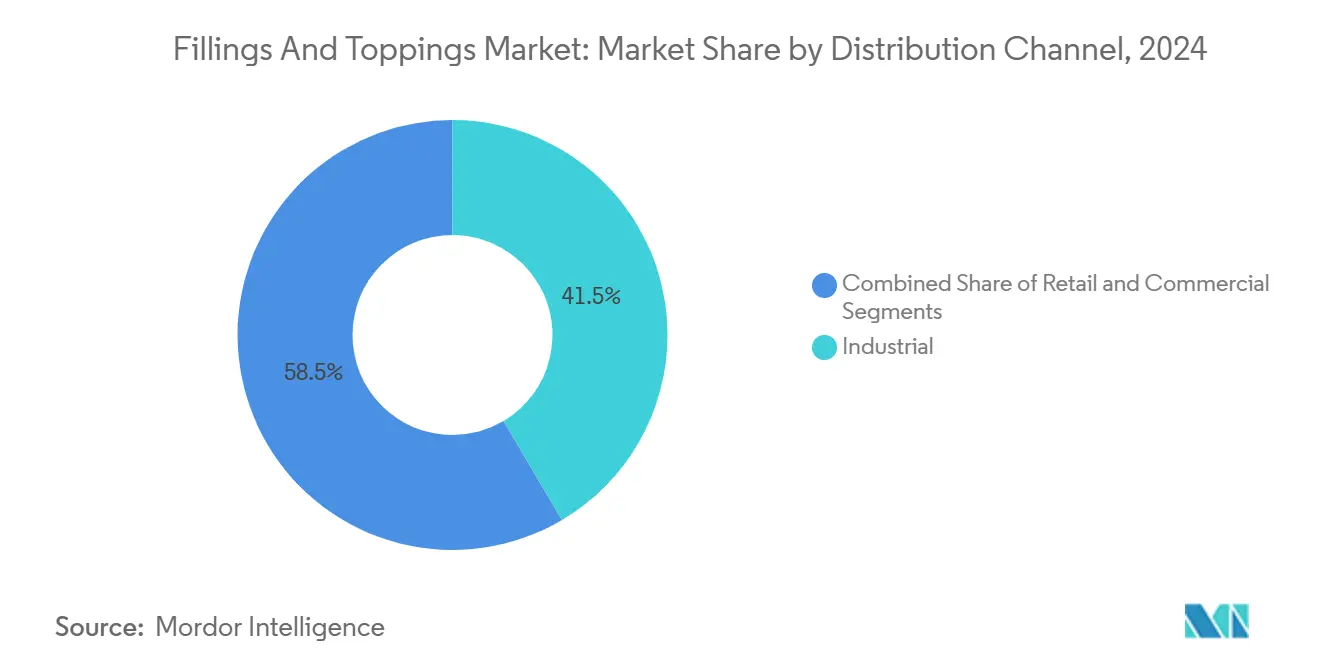
- By distribution channel, the industrial segment held 41.50% of the fillings and toppings market share in 2024. Retail channels are forecast to grow at a 6.64% CAGR to 2030, outpacing all other channels.
- By geography, Europe led with 34.20% revenue share in 2024. Asia-Pacific is expected to register the fastest regional CAGR of 6.10% through 2030.
Global Fillings And Toppings Market Trends and Insights
Driver Impact Analysis*
| Driver | (~) % Impact on CAGR Forecast | Geographic Relevance | Impact Timeline |
|---|---|---|---|
| Increasing Consumer Demand for Convenience Foods | +1.2% | Global, with the strongest impact in North America and Asia-Pacific | Medium term (2-4 years) |
| Growing Health Consciousness and Clean Label Trends | +1.8% | Global, led by Europe & North America | Long term (≥ 4 years) |
| Expansion of Bakery, Confectionery, and Dairy Sectors | +1.1% | Global, with accelerated growth in Asia-Pacific | Medium term (2-4 years) |
| Innovation in Flavors, Textures, and Product Formulations | +0.9% | Global, concentrated in developed markets | Long term (≥ 4 years) |
| Rising Adoption of Plant-Based and Vegan Alternatives | +0.7% | Europe & North America, expanding to Asia-Pacific | Long term (≥ 4 years) |
| Growing Focus on Sustainability and Eco-Friendly Ingredients | +0.6% | Europe-led, with global adoption | Long term (≥ 4 years) |
| Source: Mordor Intelligence | |||
Increasing Consumer Demand for Convenience Foods
The convenience foods revolution continues reshaping the fillings and toppings landscape as urbanization accelerates globally. Consumer preferences increasingly favor ready-to-eat and easy-to-prepare options, with frozen food consumption patterns demonstrating this shift. For instance, according to the International Food Information Council, in 2024, a total of 60% of respondents in the United States stated that they snack once or twice a day. Moreover, about 14% of respondents stated that they snack three times a day or more[2]Source: Statistics Malaysia, "Monthly manufacturing statistics Malaysia December 2024", newss.statistics.gov.my. Such factors showcase rising demand for bite-sized portions and global cuisine flavors, particularly among Millennials and Gen Z demographics. This demographic transition drives innovation in portion control and flavor diversity, creating opportunities for specialized filling applications in frozen appetizers and desserts. The trend extends beyond traditional categories, with frozen bites and mini portions evolving into a USD 2.4 billion market segment. Food service operators increasingly rely on pre-prepared fillings and toppings to maintain consistency while reducing labor costs, particularly as the industry faces persistent staffing challenges.
Growing Health Consciousness and Clean Label Trends
Health-conscious consumption patterns fundamentally alter ingredient selection criteria, with consumers prioritizing ingredient transparency. For instance, according to the International Food Information Council, in 2023, approximately 29% of respondents in the United States mentioned that they buy food and beverages on a regular basis because they are labeled as "clean-label"[3]Source: International Food Information Council, "Food & Health Survey 2024", www.ific.org. This shift compels manufacturers to reformulate products using recognizable, minimally processed ingredients while maintaining taste and texture profiles. Protein fortification emerges as a dominant trend, with high-protein claims proliferating across diverse food categories, including snacks, beverages, and desserts. The regulatory environment supports this transition, with the FDA's updated Food Code 2022 incorporating sesame as a major allergen, reflecting evolving health awareness. Clean label initiatives extend beyond ingredient lists to encompass production methods, with consumers increasingly scrutinizing manufacturing processes and sourcing practices. This trend creates competitive advantages for companies investing in transparent supply chains and natural ingredient sourcing capabilities.
Expansion of Bakery, Confectionery, and Dairy Sectors
The bakery sector demonstrates robust expansion momentum, with 53% of operators expecting significant revenue gains in 2024 and 95% anticipating volume increases. Capital investment priorities focus on capacity growth (84% of operators) and automation (68%), reflecting industry confidence in long-term demand trajectories. Dairy processing infrastructure experiences parallel expansion, exemplified by Darigold's USD 600 million facility in Washington, designed to process 8 million pounds of milk daily. These capacity additions create downstream demand for specialized fillings and toppings, particularly in artisanal cheese applications and premium dairy products. The confectionery segment benefits from premiumization trends, with consumers willing to pay higher prices for quality ingredients and unique flavor combinations. Commodity price pressures for cocoa and flour have risen significantly, yet operators maintain expansion plans, indicating strong underlying demand fundamentals.
Innovation in Flavors, Textures, and Product Formulations
Technological advancement in food processing enables unprecedented innovation in flavor delivery systems and texture modification. Precision fermentation technologies, exemplified by partnerships like Leprino Foods and Fooditive Group, produce non-animal casein proteins that replicate traditional dairy functionality. These innovations address both sustainability concerns and dietary restrictions while maintaining the sensory characteristics consumers expect. Artificial intelligence integration in food manufacturing optimizes formulation processes, enabling real-time quality control and predictive analytics for ingredient performance. Flavor companies like those acquired by Glanbia for USD 300 million in 2024 specialize in organic and natural ingredients, reflecting market premiumization toward authentic taste profiles. The convergence of technology and culinary expertise creates opportunities for customized formulations that address specific dietary needs while delivering superior sensory experiences.
Restrains Impact Analysis*
| Restraint | (~) % Impact on CAGR Forecast | Geographic Relevance | Impact Timeline |
|---|---|---|---|
| Competition from Substitute Products | -0.8% | Global, particularly intense in mature markets | Short term (≤ 2 years) |
| Stringent Food Safety and Regulatory Compliance | -0.6% | Global, with varying regional intensity | Medium term (2-4 years) |
| Environmental and Sustainability Concerns | -0.5% | Europe-led, expanding globally | Long term (≥ 4 years) |
| Raw Material Price Volatility | -0.4% | Global, with regional supply chain variations | Short term (≤ 2 years) |
| Source: Mordor Intelligence | |||
Competition from Substitute Products
Substitute product competition intensifies as alternative ingredients gain market acceptance and cost competitiveness. Plant-based protein alternatives, particularly those derived from precision fermentation, challenge traditional dairy-based fillings and toppings across multiple application categories. The emergence of novel protein sources, including canola and fermentation-derived whey proteins, provides food manufacturers with cost-effective alternatives that meet clean label requirements. Home-cooking trends, accelerated during recent years, reduce demand for commercial food service applications where fillings and toppings traditionally command premium pricing. Direct-to-consumer ingredient sales through e-commerce platforms enable consumers to create customized solutions, potentially displacing traditional commercial formulations. The competitive threat extends to functional ingredients, where synthetic alternatives may offer superior performance characteristics at lower costs.
Stringent Food Safety and Regulatory Compliance
Regulatory complexity increases operational costs and market entry barriers as food safety standards evolve globally. The FDA's Hazard Analysis and Risk-Based Preventive Controls requirements mandate comprehensive food safety plans, including hazard analysis, preventive controls, monitoring, and verification protocols. European regulations, including the updated Packaging and Packaging Waste Regulation effective February 2025, impose additional compliance burdens related to sustainability and circular economy principles. Asia-Pacific markets demonstrate varying regulatory frameworks, requiring companies to navigate multiple compliance regimes simultaneously. The cost of maintaining preventive controls, qualified individuals, and documentation systems creates particular challenges for smaller manufacturers. Regulatory harmonization remains incomplete across major markets, necessitating duplicative testing and certification processes that increase time-to-market and development costs.
*Our forecasts treat driver/restraint impacts as directional, not additive. The impact forecasts reflect baseline growth, mix effects, and variable interactions.
Segment Analysis
By Product Type: Fillings Drive Innovation Despite Toppings Dominance
Toppings maintain market leadership with 61.85% share in 2024, reflecting established applications in bakery and confectionery products where visual appeal and texture enhancement drive consumer preference. However, fillings demonstrate superior growth dynamics at 5.65% CAGR through 2030, indicating shifting consumer preferences toward premium applications and functional ingredients. Sugar toppings and chocolate-caramel variants dominate the toppings segment, while cheese and whipping cream applications serve specialized market niches with higher margin potential.
The fillings segment benefits from innovation in fruit-based applications and cream-based formulations that address health-conscious consumer demands. Chocolate fillings maintain steady demand across confectionery applications, while emerging categories focus on plant-based alternatives and functional ingredients. Precision fermentation technologies enable non-animal protein production, exemplified by Leprino Foods' partnership to develop casein alternatives for cheese, beverage, and dessert applications. The segment's growth trajectory reflects premiumization trends where consumers prioritize quality ingredients and unique flavor profiles over traditional cost considerations.


By Distribution Channel: Retail Expansion Challenges Industrial Leadership
Industrial channels command 41.50% market share in 2024, serving large-scale food manufacturers and commercial bakeries that require consistent quality and bulk purchasing arrangements. However, retail channels exhibit the highest growth potential at 6.64% CAGR through 2030, driven by direct-to-consumer trends and e-commerce penetration. Commercial applications, including restaurants, hotels, and catering services, occupy an intermediate position with steady demand patterns tied to the food service industry recovery.
Supermarkets and hypermarkets maintain dominant positions within retail channels, leveraging extensive distribution networks and consumer accessibility. Convenience stores and online retail platforms demonstrate accelerated growth as consumer shopping patterns evolve toward immediate gratification and home delivery preferences. The channel dynamics reflect broader industry consolidation, with major acquisitions like Mars' USD 36 billion Kellanova purchase enhancing distribution capabilities across multiple channels. Industrial customers increasingly demand customized formulations and sustainable packaging solutions, creating opportunities for specialized suppliers with technical expertise.

Geography Analysis
Europe delivered 34.20% of 2024 revenue on the strength of entrenched patisserie traditions, high per-capita confectionery spend, and regulatory trust in quality standards. Consumers pay premiums for authentic buttercream fillings, sustaining margins despite input inflation. Ingredient producers benefit from cluster effects in Belgium, France, and Germany, enabling collaborative innovation in fat-reduction and sugar-replacement technologies.
Asia-Pacific, by contrast, opens new volume frontiers: 6.10% CAGR through 2030 reflects rising middle-class dessert occasions and the penetration of Western bakery formats into tier-two cities. Expanding cold-chain networks in India and Indonesia preserve fill integrity in snack cakes distributed over long hauls, unlocking rural demand pockets. Regional flavor localization—think matcha custard in Japan or durian cream in Malaysia—speaks to cultural resonance, strengthening brand sentiment and feeding the fillings and toppings market momentum.
North America sits between the two extremes, leveraging advanced automation in continuous aeration lines and AI-enabled vision inspection to uphold high output consistency. Dessert toppings remain a fixture in quick-service restaurant innovation cycles, from churro dip cups to high-protein yogurt parfait layers. Local sourcing initiatives, such as berry alliances in the Pacific Northwest, mitigate supply-chain risk and reinforce sustainability narratives.

Competitive Landscape
The fillings and toppings market exhibits moderate concentration with established players leveraging vertical integration strategies and emerging disruptors focusing on sustainable innovation. Major companies like Barry Callebaut, Cargill, and Puratos maintain competitive advantages through extensive distribution networks and technical expertise in flavor development.
The competitive intensity increases through strategic acquisitions, exemplified by recent transactions including Mars' USD 36 billion Kellanova purchase and Tate & Lyle's USD 1.8 billion CP Kelco acquisition in 2024, which enhance scale economies and innovation capabilities. Technology adoption differentiates competitive positioning, with leaders investing in AI-driven quality control systems and precision fermentation capabilities. White-space opportunities emerge in plant-based alternatives and functional ingredients, where companies like those partnering with Cargill and ENOUGH develop sustainable protein solutions through zero-waste fermentation processes.
Smaller players compete through specialized applications and regional expertise, particularly in emerging markets where local flavor preferences create barriers to entry for global competitors. The competitive landscape continues evolving through consolidation activities and technological disruption, with success increasingly dependent on innovation capabilities and sustainable ingredient sourcing.
Fillings And Toppings Industry Leaders
-
Barry Callebaut AG
-
Cargill Inc.
-
Puratos Group
-
Dawn Food Products Inc.
-
Kerry Group plc
- *Disclaimer: Major Players sorted in no particular order

Recent Industry Developments
- June 2025: Puratos and AMF jointly opened a cutting-edge pilot bakery at Puratos USA headquarters in Pennsauken, NJ. This facility accelerates innovation by allowing customers to collaborate on product development, optimize recipes, test ingredients, including toppings and fillings, and train bakery teams using advanced automation and sensory research tools.
- November 2024: Puratos partnered with Future Food-Tech to support innovations related to ingredients that improve gut microbiome health, including prebiotics, postbiotics, and fermented ingredients. This challenge aligns with health-focused trends in bakery and filling ingredients, targeting functional food innovation in 2025.
- October 2024: Puratos extended its Ambiante range of ready-to-whip toppings to include a plant-based, dairy-free chocolate flavor designed for toppings and fillings. This product was asserted to offer a smooth, mousse-like texture and is free from artificial flavors and colors. It uses sustainably sourced cocoa powder through Puratos’s Cacao-Trace program, targeting premium patisserie and dessert applications with an emphasis on taste and sustainability.
- June 2024: Lassonde, a producer of fruit-based snacks and beverages, acquired Summer Garden Food Manufacturing, which specializes in specialty sauces, including sugar-free sauces that could complement toppings and fillings. This nearly doubles Lassonde’s US market presence and expands its product capabilities.


Global Fillings And Toppings Market Report Scope
| Toppings | Sugar Toppings |
| Chocolate and Caramel Toppings | |
| Cheese | |
| Whipping Cream Toppings | |
| Others | |
| Fillings | Fruit Fillings |
| Cream-based Fillings | |
| Chocolate Fillings | |
| Others |
| Industrial | |
| Commercial | Restaurants |
| Hotels | |
| Catering | |
| Retail | Supermakets/Hypermarkets |
| Convenience Stores | |
| Online Retail Stores | |
| Other Retail Stores |
| North America | United States |
| Canada | |
| Mexico | |
| Rest of North America | |
| South America | Brazil |
| Argentina | |
| Colombia | |
| Chile | |
| Rest of South America | |
| Europe | United Kingdom |
| Germany | |
| France | |
| Italy | |
| Spain | |
| Russia | |
| Sweden | |
| Belgium | |
| Poland | |
| Netherlands | |
| Rest of Europe | |
| Asia-Pacific | China |
| Japan | |
| India | |
| Thailand | |
| Singapore | |
| Indonesia | |
| South Korea | |
| Australia | |
| New Zealand | |
| Rest of Asia-Pacific | |
| Middle East and Africa | United Arab Emirates |
| South Africa | |
| Saudi Arabia | |
| Nigeria | |
| Egypt | |
| Morocco | |
| Turkey | |
| Rest of Middle East and Africa |
| By Product Type | Toppings | Sugar Toppings |
| Chocolate and Caramel Toppings | ||
| Cheese | ||
| Whipping Cream Toppings | ||
| Others | ||
| Fillings | Fruit Fillings | |
| Cream-based Fillings | ||
| Chocolate Fillings | ||
| Others | ||
| By Distribution Channel | Industrial | |
| Commercial | Restaurants | |
| Hotels | ||
| Catering | ||
| Retail | Supermakets/Hypermarkets | |
| Convenience Stores | ||
| Online Retail Stores | ||
| Other Retail Stores | ||
| By Geography | North America | United States |
| Canada | ||
| Mexico | ||
| Rest of North America | ||
| South America | Brazil | |
| Argentina | ||
| Colombia | ||
| Chile | ||
| Rest of South America | ||
| Europe | United Kingdom | |
| Germany | ||
| France | ||
| Italy | ||
| Spain | ||
| Russia | ||
| Sweden | ||
| Belgium | ||
| Poland | ||
| Netherlands | ||
| Rest of Europe | ||
| Asia-Pacific | China | |
| Japan | ||
| India | ||
| Thailand | ||
| Singapore | ||
| Indonesia | ||
| South Korea | ||
| Australia | ||
| New Zealand | ||
| Rest of Asia-Pacific | ||
| Middle East and Africa | United Arab Emirates | |
| South Africa | ||
| Saudi Arabia | ||
| Nigeria | ||
| Egypt | ||
| Morocco | ||
| Turkey | ||
| Rest of Middle East and Africa | ||


Key Questions Answered in the Report
What is the current value of the fillings and toppings market?
The fillings and toppings market size is USD 29.13 billion in 2025.
How fast is the fillings and toppings market expected to grow?
The market is projected to expand at a 5.06% CAGR, reaching USD 37.28 billion by 2030.
Which product segment is growing the quickest?
Fillings are on track to post a 5.65% CAGR, outpacing toppings through 2030.
Which region is forecast to grow the fastest?
Asia-Pacific leads regional growth with a 6.10% CAGR to 2030.
What share do industrial buyers hold in distribution?
Industrial channels account for 41.50% of the fillings and toppings market share as of 2024.
What are the key regulatory shifts affecting suppliers?
The EU’s Packaging and Packaging Waste Regulation and updated FDA allergen rules impose new sustainability and safety requirements.
Page last updated on:


