Sugar Toppings Market Size and Share
Market Overview
| Study Period | 2021 - 2031 |
|---|---|
| Market Size (2026) | USD 10.26 Billion |
| Market Size (2031) | USD 13.84 Billion |
| Growth Rate (2026 - 2031) | 6.12% CAGR |
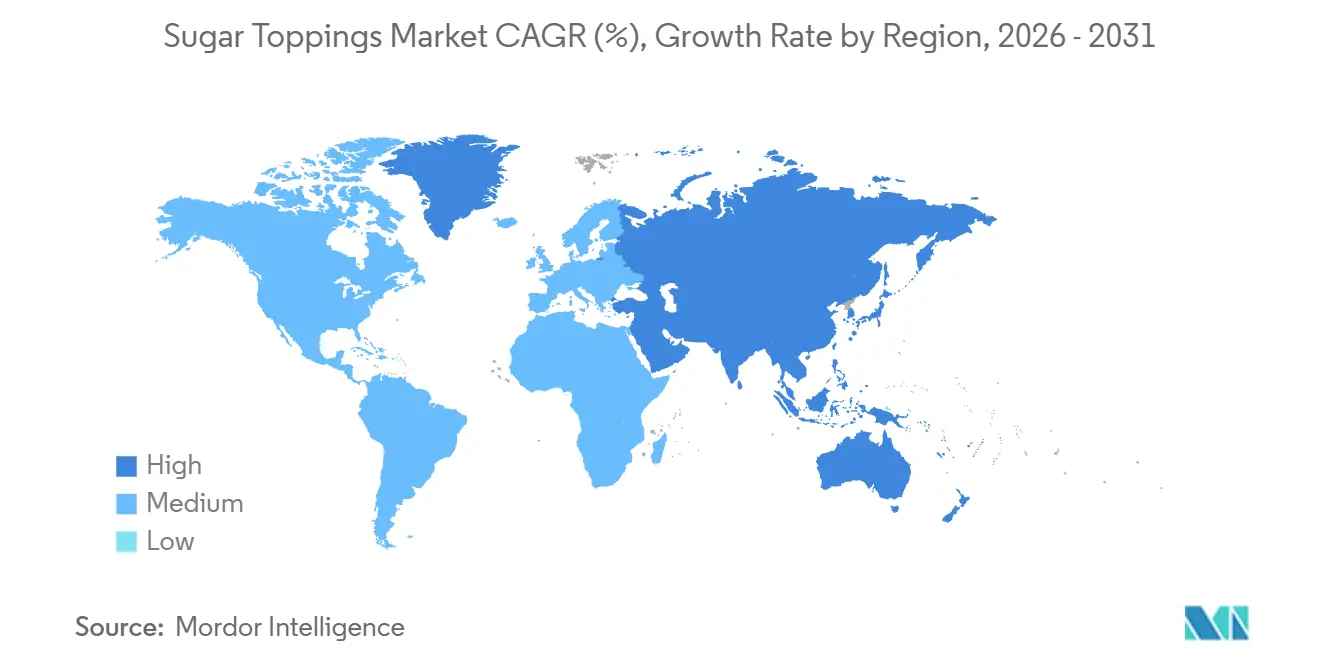
| Fastest Growing Market | Asia-Pacific |
| Largest Market | North America |
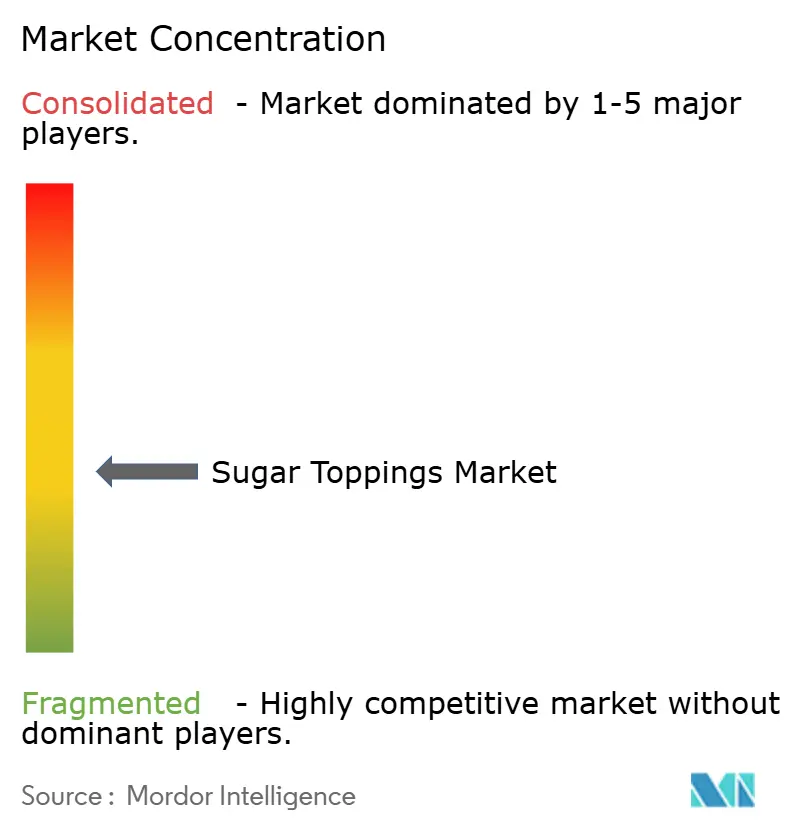
| Market Concentration | Medium |
Major Players *Disclaimer: Major Players sorted in no particular order Image © Mordor Intelligence. Reuse requires attribution under CC BY 4.0. | |
Sugar Toppings Market Analysis by Mordor Intelligence
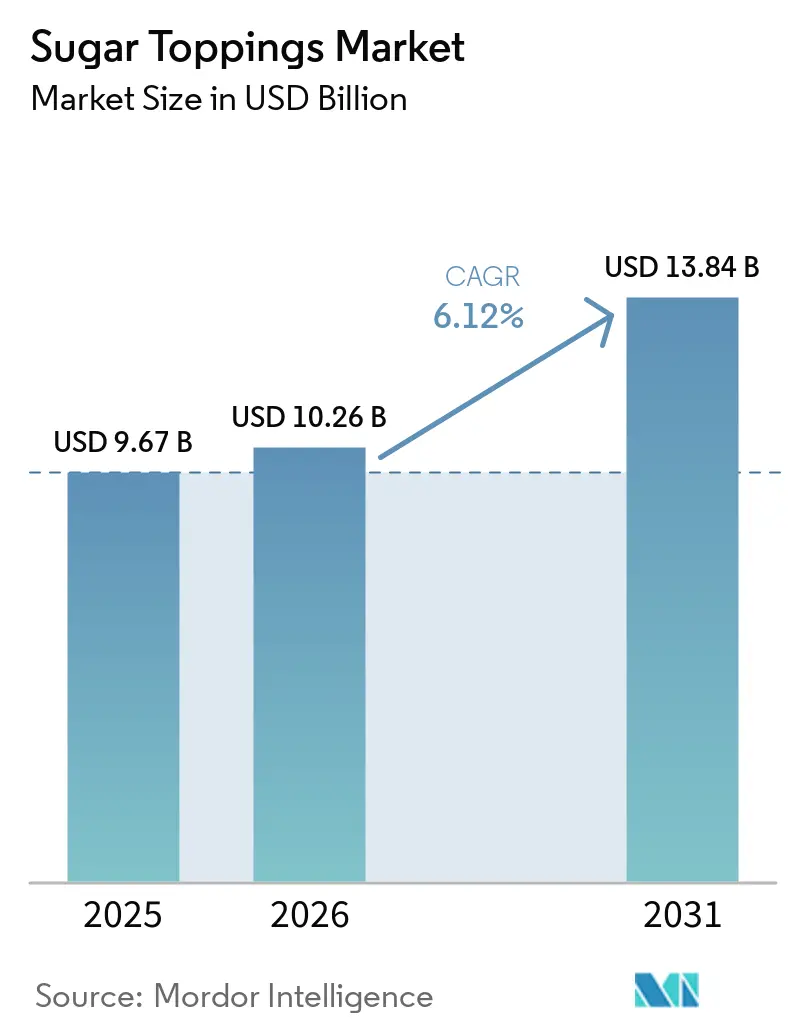
The Sugar Toppings Market size was valued at USD 9.67 billion in 2025 and is estimated to grow from USD 10.26 billion in 2026 to reach USD 13.84 billion by 2031, at a CAGR of 6.12% during the forecast period (2026-2031). Robust growth reflects consumers’ twin desires for indulgence and perceived wellness, the proliferation of quick-service restaurants (QSRs), and the social media baking boom. Liquid and syrup toppings remain the workhorses of modern kitchens because they dispense easily at scale and photograph well for digital platforms. Premiumization motivates brands to add localized flavors, plant-based ingredients, and textural twists that command higher price points while meeting shifting health guidelines. Meanwhile, manufacturers must navigate cocoa and sugar price volatility alongside European color-additive restrictions that push reformulation and supply-chain agility.
Key Report Takeaways
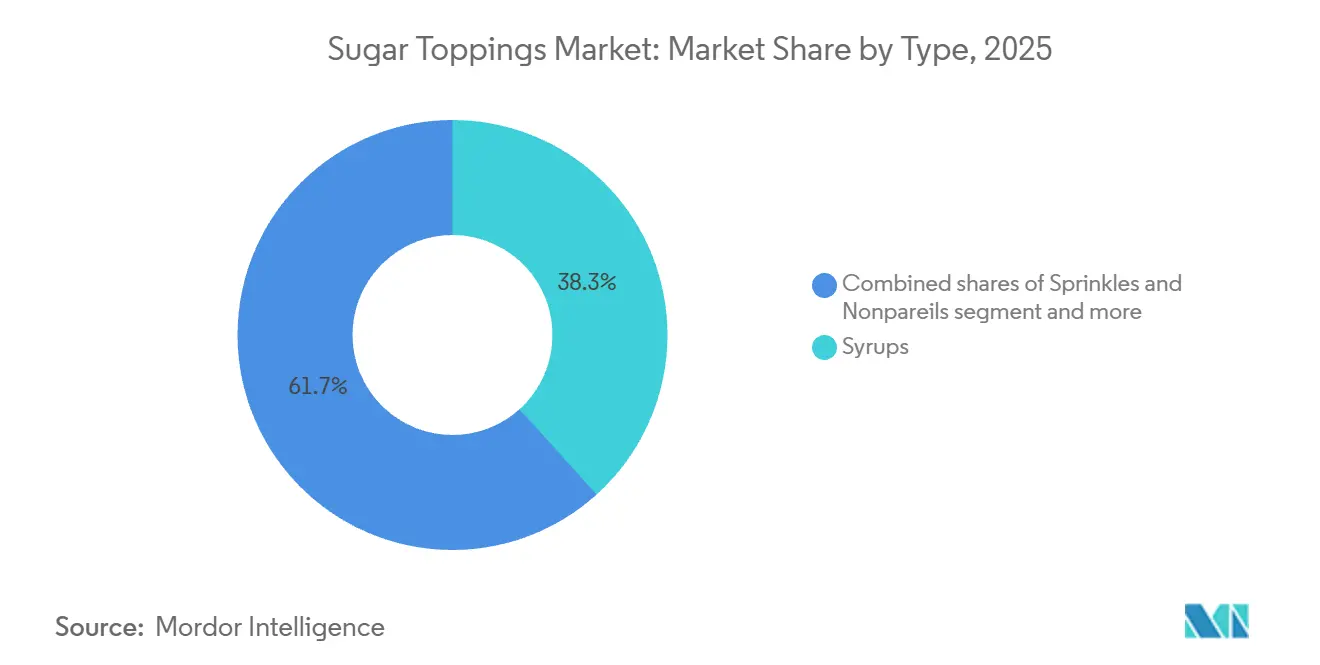
- By type, syrups held 38.31% of the sugar toppings market share in 2025, while whipped and foam toppings were projected to grow at a CAGR of 7.12%.
- By form, liquid toppings captured 57.91% of the dessert toppings market size in 2025 and are set to rise at 6.98% through 2031, outpacing dry and semi-solid formats.
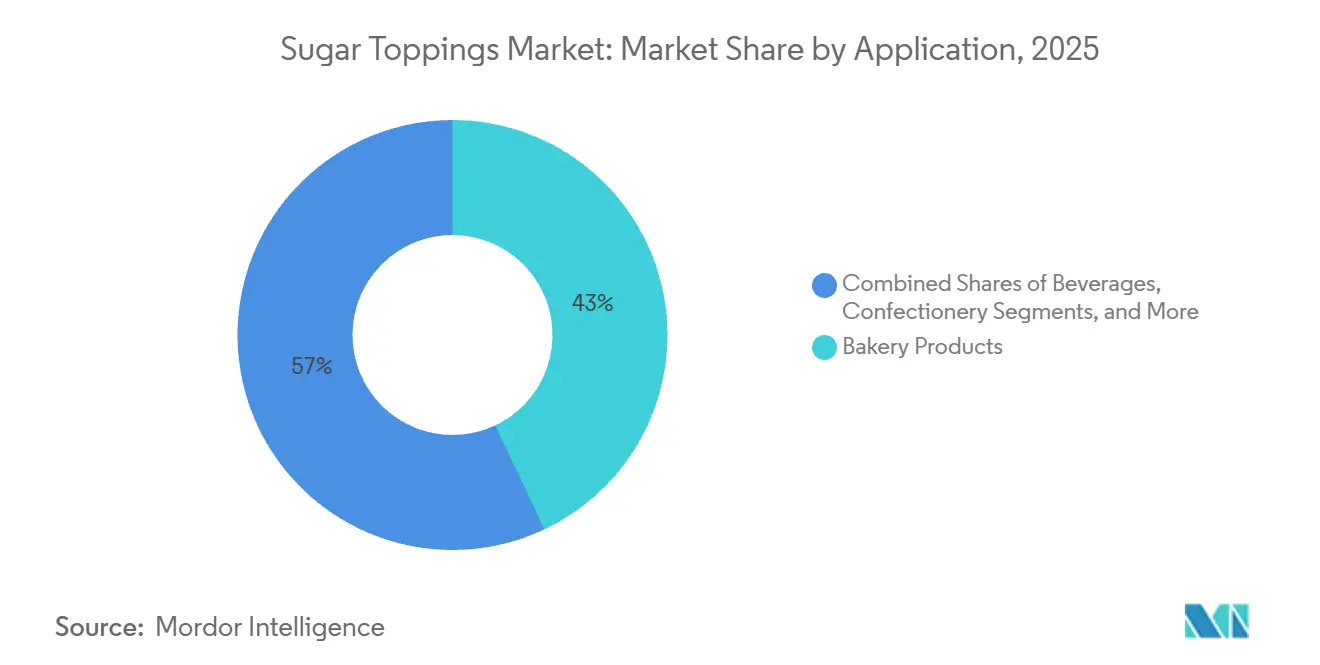
- By application, bakery products accounted for 42.97% share of the dessert toppings market in 2025; beverages exhibit the highest projected CAGR at 8.11% over 2026-2031.
- By geography, North America led with 34.56% of 2025 revenue, whereas Asia-Pacific is poised for the fastest 7.43% CAGR through 2031.
Note: Market size and forecast figures in this report are generated using Mordor Intelligence’s proprietary estimation framework, updated with the latest available data and insights as of January 2026.
Global Sugar Toppings Market Trends and Insights
Drivers Impact Analysis*
| Drivers | (~) % Impact on CAGR Forecasts | Geographic Releavance | Impact Timeline |
|---|---|---|---|
| Growing demand for premium, customized desserts | +1.2% | Global, strongest in North America and Europe | Medium term (2–4 years) |
| Expansion of café and dessert chain culture | +1.0% | Global, APAC core with spill-over to MEA | Short term (≤2 years) |
| Growth of home baking and DIY dessert preparation | +0.6% | North America, Europe | Short term (≤2 years) |
| Growing consumption of frozen desserts | +0.8% | North America, Europe, emerging APAC | Medium term (2–4 years) |
| Demand for customized food experiences | +0.7% | Global, urban centers in all regions | Medium term (2–4 years) |
| Rising demand for seasonal and limited-edition products | +0.5% | North America, Europe | Short term (≤2 years) |
| Source: Mordor Intelligence | |||
Growing Demand for Premium, Customized Desserts
Consumers are increasingly drawn to artisan finishes and exotic flavor profiles, driving a shift toward premiumization in sugar topping portfolios. In 2023, U.S. household spending on cakes and cupcakes rose by 26.4% year-on-year to USD 67, while candy expenditures increased by 31.2% to USD 164. These numbers highlight a growing willingness to spend on indulgent products despite inflation[1]Source: U.S. Bureau of Labor Statistics, “Spending on candy, cookies, and cakes in 2023,” bls.gov . This trend benefits high-margin specialty products like Monin's Yuzu Pineapple Syrup, introduced in March 2025 and sourced from the company’s 74-acre biodynamic orchard in Portugal. Decorative toppings are also gaining traction, such as McCormick's Bridgerton-themed Finishing Sugars, launched in January 2026. According to Datassential, 86% of consumers expressed strong interest in yuzu-pineapple beverages, and 80% are eager for limited-time seasonal offerings, reinforcing the appeal of premium-tier products. Customization is also expanding to textures. Whipnotic’s flavored swirled whipped cream, featuring patented nozzle technology, offers keto-friendly options with just 15 calories and 1 gram of sugar per serving, catering to health-conscious consumers seeking indulgence. Bakeries and dessert cafés are leveraging these premium toppings to stand out in competitive markets. This approach not only enhances their pricing power per unit but also helps offset declining volumes in mass-market segments.
Expansion of Café and Dessert Chain Culture
Starbucks reported a 4% growth in global comparable sales and a 5.5% increase in revenues, reaching USD 9.915 billion in the first quarter of fiscal 2026. These results reflect the growing demand for café toppings, particularly syrups and cold foam. The company plans to open 600 to 650 new stores in fiscal 2026, with each store requiring a steady supply of flavored syrups, whipped toppings, and drizzles for its signature beverages. Cold foam, projected by Datassential to grow 171% on menus over four years, has become a key area for flavor innovation. In July 2025, Rich Products launched "On Top Chocolate Soft Whip," a cold foam product free from high-fructose corn syrup and artificial colors, with a frozen shelf life of 365 days. Starbucks also reported a 7% increase in comparable sales in China, while local café chains in India, Indonesia, and Thailand are rapidly adopting Western-style topping menus. This expansion in the Asia-Pacific region creates more opportunities for syrup and topping suppliers but also increases competition, as regional players offer localized flavors at lower prices.
Growth of Home Baking and DIY Dessert Preparation
The market is benefiting from evolving home baking trends, particularly as consumers continue to engage in seasonal and occasion-based baking activities despite the growing availability of convenient, ready-made bakery products. Demand for decorative and easy-to-use toppings such as fondants, icings, sprinkles, and cake decorations remains strong, supported by rising interest in customized cakes, festive desserts, and visually appealing baked goods. Manufacturers are capitalizing on this trend through limited-edition seasonal offerings, premium decoration solutions, and innovative topping formats tailored for home bakers. In addition, increasing consumer preference for convenient, portion-controlled, and naturally formulated baking ingredients is encouraging suppliers to expand healthier and less-processed sugar topping offerings, further supporting market growth globally.
Growing Consumption of Frozen Desserts
In 2025, U.S. ice cream production reached 1.23 billion gallons, sustaining steady demand for toppings. According to USDA data, per-capita consumption was 20.3 pounds in 2021. An IDFA survey revealed hot fudge (31%), whipped cream (27%), caramel sauce (21%), and chocolate sauce (18%) as the most popular toppings, accounting for over 97% of topping occasions. While traditional ice cream sales fell by 1%, ice milk and frozen dairy desserts grew 29% to USD 652 million, driven by protein-rich and low-calorie options that rely on toppings for flavor. Premiumization trends, where consumers pay more for high-quality or functional desserts, have boosted demand for artisan syrups and clean-label whipped toppings. Seasonal flavors like Ben & Jerry's Pumpkin Cheesecake ice cream, featuring a graham cracker swirl, show how topping-integrated products capture holiday spending. Restaurants with experiential dessert bars also drive topping sales, as customers customize sundaes with multiple toppings, increasing per-transaction volumes.
Restraint Impact Analysis*
| Restraints | (~) % Impact on CAGR Forecasts | Geographic Relevance | Impact Timeline |
|---|---|---|---|
| Rising health concerns over high sugar consumption | -0.9% | Global, most acute in North America and Europe | Long term (≥4 years) |
| Stringent food labeling and sugar reduction regulations | -0.7% | Europe, North America, emerging in APAC | Medium term (2–4 years) |
| Volatility in raw material prices | -0.5% | Global | Short term (≤2 years) |
| Competition from non-sugar toppings | -0.4% | North America, Europe | Medium term (2–4 years) |
| Source: Mordor Intelligence | |||
Rising Health Concerns Over High Sugar Consumption
The WHO recommends limiting free sugars to under 10% of daily energy intake, ideally below 5% (about 25 grams or 6 teaspoons). This puts pressure on sugar toppings, especially in developed markets where dental caries affect many of the 2.5 billion people with oral diseases[2]Source: World Health Organization, “Guideline: Sugars intake for adults and children,” who.int. The WHO also discourages non-sugar sweeteners for weight control, narrowing reformulation options and challenging manufacturers to balance taste, texture, and health claims. For example, reducing sugar in whipped cream toppings from 10% to 9% while maintaining texture and shelf stability requires precise ingredient adjustments. In Northern Ireland, taste panels preferred reformulated versions 92% of the time when texture and aroma were preserved. Post-COVID, 66% of U.K. consumers sought reduced-sugar products, but 56% of home bakers enjoy making homemade food, and 47% value superior taste, showing health concerns compete with indulgence. Manufacturers now offer premium full-sugar toppings for special occasions and reduced-sugar options for daily use, though the latter often have lower margins due to higher ingredient costs.
Stringent Food Labeling and Sugar Reduction Regulations
EU Regulation 1169/2011 and Directive 2008/5/EC mandate detailed nutritional labeling, including total sugars and added sugars, which increases transparency but also highlights the sugar density of toppings—Monin's Yuzu Pineapple Syrup, for example, contains 23 grams of added sugars per 30-milliliter serving, representing 46% of the daily value[3]Source: EUR-Lex, “Regulation (EU) No 1169/2011,” eur-lex.europa.eu . The EU's 2025/2058 regulation on sweeteners imposes stricter limits on non-sugar alternatives, complicating reformulation efforts and raising R&D costs. A Czech Republic notification in May 2025 further tightened sweetener use in specific categories, signaling a patchwork of national rules that fragment the European market. In the U.S., the FDA's updated Nutrition Facts label requires prominent disclosure of added sugars, which has led some manufacturers to reformulate or reposition products. J.M. Smucker implemented list price increases for its toppings and syrups in the fourth quarter of fiscal 2025, partly to offset the costs of reformulation and compliance. These regulatory pressures disproportionately affect small and mid-sized producers lacking the scale to absorb compliance costs, potentially consolidating the market as larger players acquire niche brands to gain reformulation expertise and portfolio breadth.
*Our forecasts treat driver/restraint impacts as directional, not additive. The impact forecasts reflect baseline growth, mix effects, and variable interactions.
Segment Analysis
By Type: Syrups Anchor Volume, Whipped Toppings Lead Innovation
Whipped and foam toppings are projected to grow at a 7.12% CAGR from 2026 to 2031, driven by the increasing use of cold foam in coffee chains and demand for dairy-alternative options. Rich Products' On Top Chocolate Soft Whip, launched in July 2025, reflects this trend with its clean-label formulation, year-long frozen shelf life, and focus on HORECA operators. Datassential predicts a 171% rise in cold foam menu items over four years, led by chains like Starbucks that use foam for flavor and visual appeal. Milram’s lactose-free whipped cream, with 9% added sugar and 32% fat, addresses dietary needs while maintaining professional quality. Whipnotic’s flavored whipped cream, featuring patented nozzle technology and keto-friendly options with 15 calories and 1 gram of sugar per serving, highlights how innovation attracts new consumers. The shift to plant-based options, such as Rich Products' On Top Oat Milk Soft Whip, further expands the market by catering to lactose-intolerant and vegan consumers.
Syrups accounted for 38.31% of the market in 2025, driven by popular chocolate, caramel, and fruit flavors in retail and foodservice. Monin’s Yuzu Pineapple Syrup, launched in March 2025, reflects premiumization, with 86% of consumers showing interest in yuzu-pineapple beverages. Monin’s Toasted Coconut Syrup, the 2026 Flavor of the Year, targets cocktails, coffee, and culinary uses with its clean-label appeal and 24 grams of added sugar per 30-milliliter serving. Conagra’s Mrs. Butterworth's x Dunkin' Glazed Donut Flavored Syrup, introduced in January 2024, showcases brand collaborations that boost visibility. Smucker’s price increases for toppings and syrups in Q4 fiscal 2025 highlight strong brand loyalty and pricing power in a competitive market. Fondants, icings, marshmallow and meringue toppings, and sprinkles cater to niche uses like cake decoration and holiday baking, with demand peaking seasonally but remaining modest year-round.


By Form: Liquid Dominates Dispensing, Semi-Solid Serves Decoration
In 2025, liquid forms held 57.91% of the market and are expected to grow at a 6.98% CAGR through 2031. Their popularity is driven by easy dispensing in high-volume HORECA settings and compatibility with automated beverage equipment. Starbucks’ fiscal 2026 first-quarter revenue of USD 9.915 billion, a 5.5% increase, reflects the rising demand for liquid toppings like flavored syrups and cold foam, which require pumpable consistency. Monin addresses this demand with syrups such as Yuzu Pineapple and Toasted Coconut, available in 1-liter and 750-milliliter formats for bar and café use. Room-temperature storage further reduces refrigeration costs. An IDFA survey ranks caramel sauce (21%) and chocolate sauce (18%) among the top four ice cream toppings, highlighting the importance of viscosity and pourability.
Dry toppings like sprinkles, nonpareils, and sugar crystals are essential in bakery and confectionery for their decorative appeal. McCormick’s relaunch of Finishing Sugars in Fall 2025 and a Bridgerton-themed variant in January 2026 show how seasonal and licensed products drive impulse purchases during holidays. Waitrose reported a 33% year-on-year rise in seasonal cake case sales for Christmas 2025, reflecting strong demand for decorative toppings. OREO’s Thanksgiving Dinner Cookie Tin, launched in October 2025, featured sugar-based toppings made from sugar, corn syrup, starches, and colorants, showcasing how dry formats enable novelty and customization. Semi-solid and paste formats like fondants, icings, and marshmallow toppings offer sculptability for decoration and a rich texture for direct consumption.
By Application: Bakery Anchors Volume, Beverages Drive Growth
From 2026 to 2031, the beverage sector, including coffee, specialty drinks, and cold foam, is expected to grow at an 8.11% CAGR, driven by innovations like flavored syrups and whipped toppings. Starbucks plans to open 600 to 650 new stores in fiscal 2026, boosting demand for syrups and cold foam, creating growth opportunities for suppliers. Datassential forecasts a 171% increase in cold foam's menu presence over four years, emphasizing its visual appeal and premium pricing potential. Monin's 2026 Flavor of the Year, Toasted Coconut Syrup, targets coffee, cold brew, and espresso martinis with a clean-label formula that aligns with 57% of diners prioritizing sustainability. Rich Products' On Top Chocolate Soft Whip, launched in July 2025, offers a 365-day frozen shelf life and no high-fructose corn syrup, meeting HORECA operators' needs for convenience and clean labels. Smaller topping volumes in beverages compared to bakery applications help operators manage costs while maintaining margins.
In 2025, bakery products consumed 42.97% of sugar toppings, led by cakes, pastries, and cookies that rely on icings, glazes, and sprinkles for decoration and flavor. U.S. household spending on cakes and cupcakes rose 26.4% year-on-year in 2023 to USD 67, showing strong demand despite health-conscious trends. In the U.K., chocolate cake baking occasions grew by 63% from 2022 to 2023, adding 11 million events. Waitrose reported a 21% rise in ready-rolled icing sales for Christmas 2025, reflecting demand for convenience and premium products. McCormick's Bridgerton Finishing Sugars, launched in January 2026, use entertainment licensing to attract home bakers. However, the bakery sector faces challenges as home baking declines. In 2025, sweet baking occasions in the U.K. dropped 25% year-on-year as consumers preferred ready-made goods. Ice cream, frozen desserts, dairy products like milkshakes and yogurt, confectionery, and HORECA make up the rest of the market. An IDFA survey identified hot fudge (31%) and whipped cream (27%) as the top toppings, accounting for over 58% of topping occasions.
Geography Analysis
In 2025, North America contributed 33.85% of global sugar toppings revenue, driven by high ice cream consumption (1.23 billion gallons produced) and strong retail channels featuring brands like Hershey's syrups and Smucker's fruit toppings. Hershey's fiscal 2025 net sales rose 4.4% to USD 11.693 billion, with its North America Confectionery segment achieving USD 2.478 billion in fourth-quarter sales, up 5.3%, due to strong pricing and brand equity. U.S. household spending on candy increased 31.2% year-on-year in 2023 to USD 164, while cookie spending grew 26.4% to USD 91, reflecting rising demand for complementary toppings. Starbucks reported 4% growth in North America comparable sales in early fiscal 2026 and plans to open 600–650 new stores, highlighting the region's importance. However, regulatory challenges are growing. The FDA's updated Nutrition Facts label, requiring added sugar disclosures, has increased R&D costs. Smucker's raised topping prices in late fiscal 2025 to address compliance and input cost inflation. Mexico and Canada contribute modestly, with Mexico benefiting from middle-class spending and Canada maintaining steady demand through its mature bakery and foodservice sectors.
Asia-Pacific is projected to grow at a 7.43% CAGR from 2026 to 2031, driven by rising middle-class spending in India and China, café expansion, and premium confectionery trends. India's confectionery market grew at a 10.3% CAGR from 2019 to 2023, with sugar confectionery reaching USD 1.45 billion in 2023 and expected to hit USD 1.9 billion by 2028, supported by urbanization and Western dessert trends. India's food retail market, valued at USD 869 billion in 2025, saw online grocery sales grow over 40% annually to USD 12 billion, creating opportunities for premium toppings. Starbucks reported 7% comparable sales growth in China in early fiscal 2026, while chains in Indonesia, Thailand, and Singapore are adopting flavored syrups and cold foam to attract customers. Japan's sugar confectionery market is recovering at a 5.8% CAGR from 2023 to 2027, reaching USD 4.77 billion, after a decline from 2018 to 2022. Rising sugar costs have led to price increases, offsetting volume declines, but growing health awareness poses challenges, with some Indian states considering sugar taxes. White sugar remains a key ingredient in new products, presenting both opportunities and risks. Australia, South Korea, and smaller Southeast Asian markets contribute incrementally, with Australia's mature retail sector driving demand for icings and sprinkles, and South Korea's café culture boosting syrup consumption.
Europe's sugar toppings market benefits from strong bakery traditions and strict quality standards but faces rising regulatory pressures. EU regulations mandate detailed nutritional labeling, while the 2025/2058 sweetener regulation limits non-sugar alternatives, increasing compliance costs. Barry Callebaut reported a 26.8% drop in European sugar prices in fiscal 2024/25, easing costs for syrup and fondant producers, though cocoa prices surged 160% in 2024, squeezing chocolate topping margins. Germany, the U.K., France, Italy, and Spain are key markets. Germany's bakery sector and the U.K.'s home baking resurgence drive demand, with Waitrose reporting a 22% rise in home baking sales during Christmas 2025. While sweet baking occasions in the U.K. fell 25% in 2025 after a 22% surge in 2023, chocolate cake occasions remained 63% above 2022 levels. The Netherlands, Poland, Belgium, and Sweden contribute steadily, with the Netherlands' foodservice sector and Poland's growing café culture supporting demand. South America and the Middle East & Africa remain smaller markets. Brazil's dessert culture and the UAE's luxury hospitality sector offer niche opportunities, though infrastructure gaps and price sensitivity limit broader growth.

Competitive Landscape
The sugar toppings market exhibits a moderately fragmented competitive landscape. This fragmentation allows both multinational giants and regional players to carve out their market share using distinct strategies. The diversity in requirements across the bakery, beverage, and foodservice sectors often prioritizes specialized formulations and distribution prowess over sheer economies of scale. Established brands like The Hershey Company, Barry Callebaut AG, and Puratos Group leverage efficient supply chains to compete. Meanwhile, newer entrants are making their mark with sustainable practices and innovative product developments, such as turning production waste into premium toppings.
Companies are setting themselves apart by embracing technology, especially in automated dispensing systems and connectivity features that enhance both operational efficiency and user experience. This emphasis on tech is underscored by patent filings for dispensing systems boasting Clean in Place capabilities and mobile device integration.
Opportunities abound in plant-based formulations, as highlighted by Ferrero's launch of Nutella Plant-Based, and in emerging markets where regional tastes drive demand for localized products. The market's fragmentation enables niche players to thrive with specialized offerings. At the same time, industry consolidation presents mid-sized companies with avenues for growth through acquisitions or partnerships, merging complementary capabilities and distribution channels.
Sugar Toppings Industry Leaders
The Hershey Company
Barry Callebaut AG
Conagra Brands, Inc.
Puratos Group
Tate & Lyle PLC
- *Disclaimer: Major Players sorted in no particular order

Recent Industry Developments
- April 2026: Bakels launched a new Transparent Fondant icing designed to create a see-through cake decoration effect, supporting rising demand for visually distinctive and premium customized cakes. The launch highlights growing innovation in specialty fondants focused on aesthetic appeal, creative bakery applications, and advanced cake decorating trends.
- June 2025: The Reddy family, in collaboration with Bain Capital, established Trillium Foods, a manufacturer specializing in dressings, sauces, mayonnaises, syrups, and beverage mixes for foodservice, retail, and food processing channels.
- June 2025: Food Service India Pvt. Ltd. (FSIPL) unveiled Marimbula's new beverage range, introducing three tantalizing seasonal syrups: Jallab, Aam Panna, and Kala Katta. These gourmet concoctions are designed to refresh, making them an ideal summer menu enhancement for hotels, restaurants, cafés, and cloud kitchens throughout India.


Global Sugar Toppings Market Report Scope
| Sprinkles and Nonpareils |
| Syrups (Chocolate, Caramel, Fruit, etc.) |
| Fondants and Icings |
| Whipped and Foam Toppings |
| Marshmallow and Meringue-based |
| Others |
| Dry |
| Liquid |
| Semi-solid/Paste |
| Bakery Products |
| Ice-cream and Frozen Desserts |
| Dairy (Milkshakes, Yogurt, etc.) |
| Beverages (Coffee, Specialty Drinks) |
| Confectionery |
| Foodservice/HORECA |
| North America | United States |
| Canada | |
| Mexico | |
| Rest of North America | |
| Europe | Germany |
| United Kingdom | |
| Italy | |
| France | |
| Spain | |
| Netherlands | |
| Poland | |
| Belgium | |
| Sweden | |
| Rest of Europe | |
| Asia-Pacific | China |
| India | |
| Japan | |
| Australia | |
| Indonesia | |
| South Korea | |
| Thailand | |
| Singapore | |
| Rest of Asia-Pacific | |
| South America | Brazil |
| Argentina | |
| Colombia | |
| Chile | |
| Peru | |
| Rest of South America | |
| Middle East and Africa | South Africa |
| Saudi Arabia | |
| United Arab Emirates | |
| Nigeria | |
| Egypt | |
| Morocco | |
| Turkey | |
| Rest of Middle East and Africa |
| By Type | Sprinkles and Nonpareils | |
| Syrups (Chocolate, Caramel, Fruit, etc.) | ||
| Fondants and Icings | ||
| Whipped and Foam Toppings | ||
| Marshmallow and Meringue-based | ||
| Others | ||
| By Form | Dry | |
| Liquid | ||
| Semi-solid/Paste | ||
| By Application | Bakery Products | |
| Ice-cream and Frozen Desserts | ||
| Dairy (Milkshakes, Yogurt, etc.) | ||
| Beverages (Coffee, Specialty Drinks) | ||
| Confectionery | ||
| Foodservice/HORECA | ||
| By Geography | North America | United States |
| Canada | ||
| Mexico | ||
| Rest of North America | ||
| Europe | Germany | |
| United Kingdom | ||
| Italy | ||
| France | ||
| Spain | ||
| Netherlands | ||
| Poland | ||
| Belgium | ||
| Sweden | ||
| Rest of Europe | ||
| Asia-Pacific | China | |
| India | ||
| Japan | ||
| Australia | ||
| Indonesia | ||
| South Korea | ||
| Thailand | ||
| Singapore | ||
| Rest of Asia-Pacific | ||
| South America | Brazil | |
| Argentina | ||
| Colombia | ||
| Chile | ||
| Peru | ||
| Rest of South America | ||
| Middle East and Africa | South Africa | |
| Saudi Arabia | ||
| United Arab Emirates | ||
| Nigeria | ||
| Egypt | ||
| Morocco | ||
| Turkey | ||
| Rest of Middle East and Africa | ||


Key Questions Answered in the Report
How large is the sugar toppings market in 2026?
The sugar toppings market size stands at USD 10.26 billion in 2026 and is projected to reach USD 13.84 billion by 2031.
What is the expected CAGR for sugar toppings to 2031?
The market is forecast to grow at a 6.12% CAGR from 2026 to 2031.
Which product segment is growing the fastest?
Whipped and foam toppings are set to expand at a 7.12% CAGR through 2031, fueled by cold-foam adoption in cafés.
Which region offers the highest growth outlook?
Asia-Pacific is forecast to post a 7.43% CAGR between 2026 and 2031 on the back of rising middle-class spending and café proliferation.
Page last updated on:


