
Europe CT Market Size and Share
Market Overview
| Study Period | 2020 - 2031 |
|---|---|
| Forecast Data Period | 2026 - 2031 |
| Historical Data Period | 2020 - 2024 |
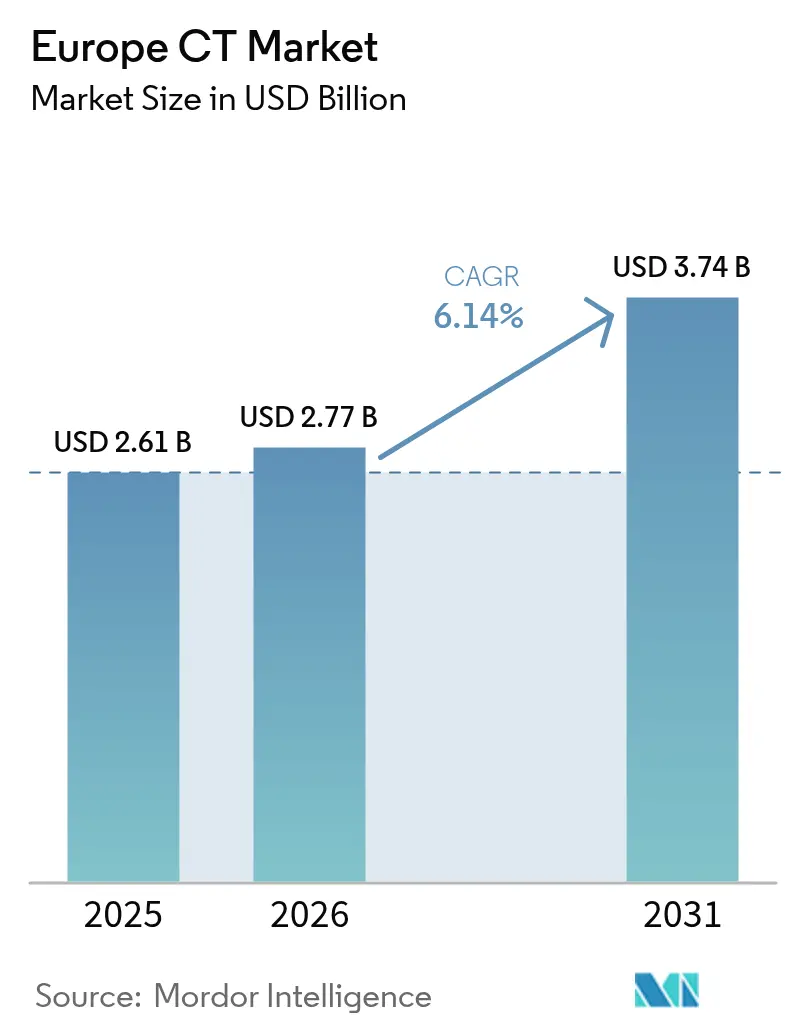
| Base Year Market Size (2025) | USD 2.614 Billion |
| Market Size (2026) | USD 2.77 Billion |
| Market Size (2031) | USD 3.74 Billion |
| Growth Rate (2026 - 2031) | 6.14 % |
Major Players *Disclaimer: Major Players sorted in no particular order Image © Mordor Intelligence. Reuse requires attribution under CC BY 4.0. | |
Europe CT Market Analysis by Mordor Intelligence
Europe CT market size in 2026 is estimated at USD 2.77 billion, growing from 2025 value of USD 2.614 billion with 2031 projections showing USD 3.74 billion, growing at 6.14% CAGR over 2026-2031. Strong upgrade cycles, photon-counting detector launches, and AI-driven workflow gains are redefining procurement criteria as hospitals prioritize lower radiation dose, faster throughput, and tighter regulatory compliance. Capital spending is supported by EU Recovery and Resilience Facility grants, while aging scanner fleets in several member states accelerate the shift from 16- and 64-slice systems to dual-energy and photon-counting platforms. Portable solutions are carving out a point-of-care niche in stroke and intensive care settings, and outpatient providers are scaling capacity to meet rising demand for same-day imaging. Intensifying vendor competition around software ecosystems, dose analytics, and service contracts is expected to keep total cost of ownership in focus throughout the forecast window.
Key Report Takeaways
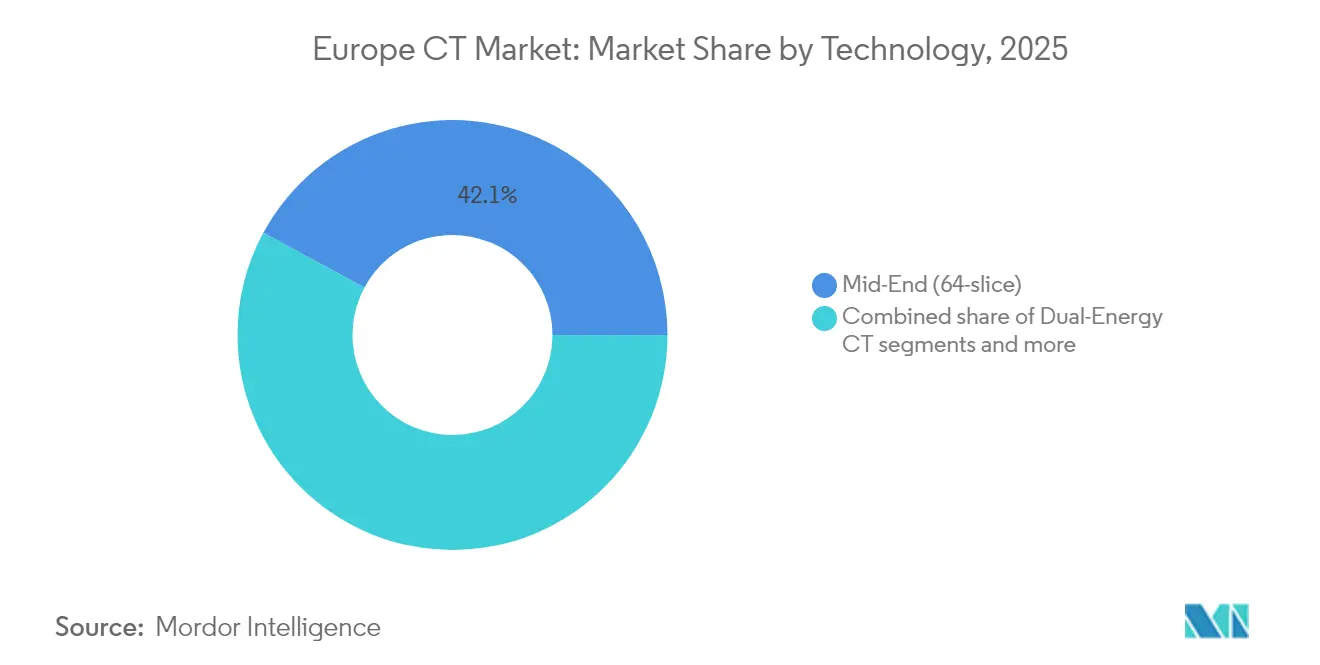
- By technology, mid-end 16-64-slice systems held 42.12% of the Europe CT market share in 2025, Dual-energy CT is projected to post the fastest 6.28% CAGR to 2031.
- By device architecture, stationary scanners retained 79.28% revenue in 2025, while portable CT is expanding at a 6.75% CAGR.
- By application, oncology contributed 29.45% revenue in 2025; cardiology leads growth with a 6.56% CAGR through 2031.
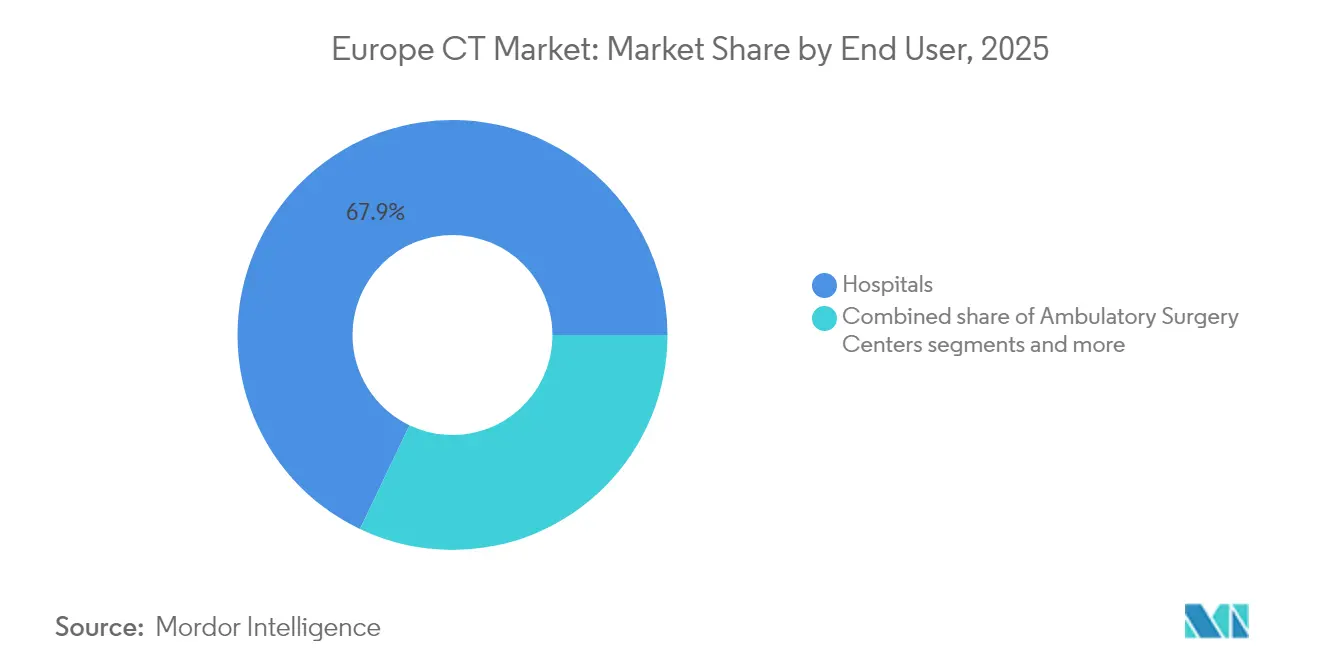
- By end user, hospitals controlled 67.92% revenue in 2025; ambulatory surgery centers are pacing at a 6.84% CAGR.
Note: Market size and forecast figures in this report are generated using Mordor Intelligence’s proprietary estimation framework, updated with the latest available data and insights as of 2026.
Europe CT Market Trends and Insights
Drivers Impact Analysis*
| Driver | (~) % Impact on CAGR Forecast | Geographic Relevance | Impact Timeline |
|---|---|---|---|
| Growing burden of chronic disease & cancer boosts demand for early, imaging-led diagnosis | +1.2% | EU-wide, strongest in Germany, France, Italy | Long term (≥ 4 years) |
| Rapid technology shifts (AI, photon-counting, spectral CT) enhance image quality & reduce dose | +1.8% | Western Europe core, expanding to Eastern Europe | Medium term (2-4 years) |
| Accelerating replacement cycle of legacy 16-/64-slice scanners across EU hospitals | +1.4% | UK, Germany, France with spillover to Nordics | Short term (≤ 2 years) |
| Stricter EU-wide dose regulations favour adoption of low-dose premium systems | +0.9% | EU-wide with national implementation variations | Medium term (2-4 years) |
| EU Recovery & Resilience Facility grants earmarked for digital radiology upgrades | +0.7% | Southern and Eastern Europe focus | Short term (≤ 2 years) |
| Net-zero hospital initiatives drive purchase of energy-efficient CT platforms | +0.3% | Nordic countries, Netherlands, Germany | Long term (≥ 4 years) |
| Source: Mordor Intelligence | |||
Growing Burden of Chronic Disease & Cancer Boosts Demand for Early, Imaging-Led Diagnosis
European populations are aging, and chronic disease prevalence is climbing, reinforcing CT as a frontline modality for oncology and cardiovascular assessment. Cancer screening programs in Germany, France, and Italy anchor consistent scan volumes, while AI tools now assist in 33.9% of CT workflows in Polish hospitals, shortening interpretation time and raising diagnostic sensitivity. The European Society of Radiology survey found CT as the leading AI modality at 38.8%, underscoring clinical reliance on advanced reconstruction and automated triage. Early detection policies are also enlarging lung cancer screening cohorts, further lifting utilization. Together, these trends position the Europe CT market for sustained demand over the next decade.
Rapid Technology Shifts (AI, Photon-Counting, Spectral CT) Enhance Image Quality & Reduce Dose
Photon-counting detectors represent the most consequential advancement since helical scanning, delivering sub-0.2 mm spatial resolution and intrinsic spectral data at 45% lower dose than conventional energy-integrating arrays. Siemens Healthineers invested EUR 80 million in Forchheim to secure vertical supply of the detector ASICs . Sectra’s PACS integration enables radiologists to manipulate photon-counting datasets without leaving their primary workstation. As dose limits tighten, premium systems offering automatic kV selection and photon-counting options are gaining preference, especially for pediatric and repeat imaging. AI-based noise-optimizing algorithms, now embedded in most Tier-1 offerings, further reduce dose and speed reconstruction, adding momentum to the Europe CT market.
Accelerating Replacement Cycle of Legacy 16-/64-Slice Scanners Across EU Hospitals
More than 27% of NHS trusts operate scanners older than 10 years, limiting access to iterative reconstruction, spectral imaging, and AI analytics. Croatia’s share of aged scanners exceeds 45%, and several Eastern European markets rely on systems lacking vendor support. Procurement portals recorded 57 CT tenders in the UK alone over the past 12 months, signaling budget allocation for fleet renewal. Replacement choices favor scalable platforms that can accept photon-counting upgrades and AI packages, ensuring future-proofing under rising compliance standards. Accelerated renewal cycles therefore inject steady capital expenditure into the Europe CT market.
Stricter EU-Wide Dose Regulations Favor Adoption of Low-Dose Premium Systems
Implementation of Diagnostic Reference Levels across member states drives hospitals to procure scanners with advanced exposure control, automated tube current modulation, and iterative reconstruction. The updated EU Medical Device Regulation compels vendors to provide clinical proof of dose efficiency, indirectly penalizing outdated models. Hospitals now mandate embedded dose monitoring dashboards and audit trails to satisfy regulators, tilting preferences toward premium tiers. Pediatric centers and high-repeat imaging clinics lead this transition, ensuring a stable premium segment within the Europe CT market.
Restraints Impact Analysis*
| Restraint | (~) % Impact on CAGR Forecast | Geographic Relevance | Impact Timeline |
|---|---|---|---|
| High capex & maintenance costs of >64-slice scanners | -0.8% | Eastern Europe, smaller healthcare systems EU-wide | Medium term (2-4 years) |
| Diagnosis-Related Group (DRG) tariff pressure squeezes CT scan profitability | -0.6% | Germany, France, Netherlands with DRG systems | Long term (≥ 4 years) |
| Shortage of CT-trained technologists limits utilisation of newly installed units | -0.7% | EU-wide, acute in UK, Germany, Nordic countries | Short term (≤ 2 years) |
| Supply-chain risk for X-ray tubes & detectors amid Russia-Ukraine conflict | -0.4% | Global supply chains affecting all EU markets | Medium term (2-4 years) |
| Source: Mordor Intelligence | |||
High Capex & Maintenance Costs of >64-Slice Scanners
Premium systems priced above EUR 1.4 million strain local budgets in smaller European markets. MDR certification alone costs vendors near EUR 100,000 per model, a seven-fold increase over the prior directive, costs that flow through to list prices. Annual service contracts add 8-12% of purchase value, creating a lifecycle burden many district hospitals find unsustainable. Currency volatility in Central and Eastern Europe further complicates budgeting. Consequently, buyers sometimes opt for refurbished 64-slice units, tempering the high-end revenue opportunity within the Europe CT market.
Diagnosis-Related Group Tariff Pressure Squeezes CT Scan Profitability
Under DRG schemes, German and French providers receive bundled payments that have not kept pace with staffing and energy cost inflation. Margin compression discourages capacity expansion and delays premium upgrades. Operators prioritize scanners with automated positioning, one-button protocols, and dose-tracking software to drive throughput efficiency, but uncompensated capital costs remain a hurdle. Persistent reimbursement headwinds therefore dampen the otherwise favorable outlook for the Europe CT industry.
*Our forecasts treat driver/restraint impacts as directional, not additive. The impact forecasts reflect baseline growth, mix effects, and variable interactions.
Segment Analysis
By Technology: Photon-Counting Accelerates Premium Transformation
Mid-end 16-64-slice systems retained 42.12% revenue in 2025, confirming their role as versatile workhorses across routine body imaging. The Europe CT market size for dual-energy platforms is projected to grow at 6.28% CAGR, propelled by oncology and cardiology protocols that benefit from material decomposition and mono-energetic reconstructions. Over the same horizon, photon-counting CT units will outpace all classes by value, as early adopters validate dose savings and diagnostic yield in calcified plaque and lung nodule characterization. Vendors offer upgradable tubes and detector packages that allow mid-tier customers to migrate gradually, blurring boundaries between traditional tiers.
High-end scanners above 64 slices remain indispensable in trauma centers and tertiary cardiology hubs, while cone-beam and low-slice devices occupy niche roles in dental and basic emergency settings. The vendor roadmap through 2030 focuses on integrating photon-counting detectors, AI-driven image chain optimization, and subscription-based reconstruction engines. These trends will reshape the competitive hierarchy over the forecast period, anchoring photon-counting as the gold standard for premium diagnostics in the Europe CT market.



By Device Architecture: Portable Platforms Meet Point-of-Care Needs
Stationary gantries accounted for 79.28% revenue in 2025, reflecting their entrenched role in high-volume imaging centers. Yet portable CT units are set to post a 6.75% CAGR as stroke ambulances, ICUs, and neonatal units embrace bedside scanning. The SOMATOM On.site system, featuring telescopic shielding and remote control, exemplifies vendor investment in this space. Clinical studies show that mobile CT reduces intra-hospital transfer times by 40% and lowers infection risk in ventilated patients, supporting the cost premium.
Scanners integrated in mobile stroke units enable immediate intracranial hemorrhage ruling-out, shaving crucial minutes from door-to-needle metrics and improving functional outcomes. Reimbursement is improving, with Germany’s G-DRG 3-stage tele-stroke codes adding financial viability. Despite smaller detector arrays and limited field-of-view, image reconstruction engines have advanced to deliver diagnostic quality suitable for acute decision making. As component costs fall and battery runtimes lengthen, portable scanners will secure a larger niche within the Europe CT market.
By Application: Oncology Dominates While Cardiology Surges
Oncology captured 29.45% revenue in 2025 and anchors steady demand through widely adopted lung, colorectal, and head-and-neck screening pathways. The Europe CT market size for oncology is forecast to stay above USD 1 billion by 2031 on the back of population screening expansion and therapy response monitoring. Cardiology scans will grow fastest at 6.56% CAGR as coronary CT angiography becomes preferred over invasive angiography for low-to-intermediate risk cohorts under ESC guidelines. Automated calcium scoring and fractional flow reserve software reduce reader variability, encouraging broader adoption.
Neurology maintains momentum through advanced stroke perfusion and brain perfusion protocols, especially after the 2024 ESO guidelines on extended thrombectomy windows. Musculoskeletal practice benefits from high-resolution bone windows and dual-energy edema detection, while vascular imaging leverages spectral reconstructions for plaque and endoleak assessment. Pulmonology segments leverage low-dose spiral protocols for lung cancer screening and ILD assessment. Together, diversified clinical use cases provide resilient volume across economic cycles in the Europe CT market.
By End User: Outpatient Shift Gains Steam
Hospitals remained the primary purchasers at 67.92% revenue in 2025 thanks to 24/7 emergency coverage and complex case mix. Ambulatory surgery centers will advance at a 6.84% CAGR as same-day joint replacements and spine procedures rely on intraoperative CT navigation. Diagnostic imaging centers capitalize on high-patient-throughput models, often partnering with AI vendors to cut reporting turnaround below 30 minutes.
Academic institutes act as lighthouse sites for photon-counting evaluation studies and secure research grants that accelerate adoption of premium technologies. Veterinary clinics, though niche, show double-digit growth in companion animal CT as pet insurance penetration widens. The heterogeneous customer base obliges vendors to differentiate service packages and financing structures, widening strategic options across the Europe CT market.
By Component: Software and Services Lift Lifetime Value
Hardware still represents over 70% of invoice value, yet software and services drive recurring revenue and customer lock-in. Dose analytics dashboards, automated positioning, and reconstruction subscriptions are increasingly sold as annual licenses. Canon’s SUREWorkFlow suite cuts chest CT exam time by 24%, illustrating measurable ROI for software add-ons.
Service contracts covering uptime guarantees, remote tube monitoring, and predictive part replacement now span five or more years, often bundled into operating leases. MDR post-market surveillance obligations force providers to rely on vendor support portals for continual safety updates, reinforcing the service revenue stream. Consequently, holistic lifecycle solutions rather than isolated hardware specs are shaping win ratios in competitive tenders across the Europe CT market.
Geography Analysis
Germany remains the bellwether, pairing robust statutory insurance funding with large-scale innovation programs and housing major vendor manufacturing bases. More than 2,500 CT units were active nationwide in 2025, and photon-counting pilots at university hospitals are expanding. France follows with strong public hospital modernization budgets; the AP-HP–Siemens partnership channels EUR 40 million into advanced imaging deployment. The UK leverages centralized NHS procurement, evident in 57 scanner tenders during the past year, though post-Brexit regulatory divergence introduces planning uncertainty.
Italy and Spain harness EU Recovery and Resilience grants to retire aging 16-slice fleets, fueling mid-end and dual-energy demand. Nordic states pursue low-dose and eco-efficient systems under net-zero hospital charters, making them early adopters of inverter drive gantries and recyclable detector housings. Benelux maintains steady refresh cycles, aided by DRG adjustments that reward efficiency gains.
Central and Eastern Europe present the highest growth ceiling: Poland targets a 20% scanner density uplift by 2030, and Hungary allocates HUF 60 billion for diagnostic upgrades. Croatia’s 45% share of scanners older than 10 years underscores replacement urgency. Russia remains hampered by sanctions limiting component availability, redirecting supplier focus to EU markets. Despite varied funding models, regulatory harmonization under MDR ensures comparable technical baselines across the Europe CT market.
Regulatory Landscape
CT systems in Europe are regulated as medical devices under Regulation (EU) 2017/745 (MDR), with CE marking typically requiring notified body conformity assessment and ongoing post-market surveillance, including UDI and traceability obligations. A key compliance inflection in 2026 was the mandatory use of the first EUDAMED modules (Actors, UDI/Devices, Notified Bodies/Certificates, and Market Surveillance) effective 28 May 2026, which increases operational requirements for device registration and documentation readiness across manufacturers, importers, and distributors.
In 2026, the European Commission also updated the supporting compliance framework through implementing and delegated acts that affect how technical documentation and conformity assessment are carried out. Commission Implementing Regulation (EU) 2026/977 (published May 2026) set uniform quality management and procedural requirements for notified body assessments, with application from 25 February 2027, while Commission Implementing Decision (EU) 2026/1231 (June 2026) updated the list of harmonised standards for MDR. This, in turn, shapes presumption-of-conformity pathways for electrically powered imaging equipment used in hospitals and outpatient centers.
Value Chain Analysis
The Europe CT value chain runs from specialized component supply (high-power rotating anode X-ray tubes, high-voltage generators, detector modules, gantry mechanics, and embedded compute for reconstruction) through system integration and final assembly, then to direct sales, installation, and long-term service. Final-stage assembly footprints are concentrated around major OEM hubs in Europe, including Siemens Healthineers sites in Germany (Erlangen/Forchheim), Philips operations in the Netherlands (Best), and GE HealthCare activity in France (Buc). Critical subassemblies and advanced detector technologies often depend on global supplier ecosystems.
Downstream, OEM-direct distribution dominates CT capital equipment placements, while independent distributors are more active in accessories, contrast-adjacent logistics, and refurbished systems. MDR-driven quality and documentation requirements have also become a practical bottleneck in supplier qualification and change control. The regulation includes early-notification expectations for anticipated interruptions or discontinuations of supply that could create serious risk, pushing manufacturers and economic operators to strengthen traceability, UDI data handling, and EUDAMED-linked registration processes. These dynamics increase the role of service organizations, including uptime guarantees, tube monitoring, and software updates, as a core part of delivered value and total cost of ownership for European providers.
Competitive Landscape
The Europe CT market features moderate concentration, with the top five vendors controlling more than half of the revenue. Siemens Healthineers leads through photon-counting first-mover status and multi-site enterprise service pacts. GE HealthCare accelerates its photon-counting roadmap after acquiring Prismatic Sensors, while Philips differentiates via AI-powered cardiac workflows embedded in the CT 5300. Canon emphasizes workflow automation and dose efficiency in its Aquilion series, and United Imaging captures share with aggressively priced high-end systems in France and Greece.
Regulatory hurdles under MDR elevate entry barriers: certification costs near EUR 100,000 per model and timelines stretch up to 24 months, prompting SMEs to rationalize portfolios. Larger incumbents absorb the burden through centralized quality systems and dedicated regulatory teams. Partnerships between modality vendors and PACS or AI specialists—like Siemens with Sectra—create integrated ecosystems that lock customers into vendor-neutral archives and spectral visualization suites.
Supply chain localization has become strategic; Siemens’ EUR 80 million detector factory in Germany and Canon’s expansion in the Netherlands safeguard component continuity. Portable CT represents a white-space battleground where startups offer compact designs, but incumbent brands leverage service reach to win ICU and stroke ambulance tenders. Overall, the market’s structure supports steady innovation cycles and service-led differentiation throughout the forecast period.
Europe CT Industry Leaders
GE Healthcare
Koninklijke Philips NV
Siemens AG
Canon Medical Systems
Hitachi Medical Systems
- *Disclaimer: Major Players sorted in no particular order


Market Opportunities and Future Outlook
Upgrade and replacement programs across Europe create whitespace for systems that reduce dose and raise throughput while meeting MDR-era documentation and traceability expectations. In the UK, procurement activity (57 CT tenders recorded over the past 12 months in the RD context) supports opportunities for vendors to bundle fleet renewal with enterprise service contracts and workflow software. This is especially relevant where providers are retiring scanners older than 10 years and need modern iterative reconstruction, spectral capabilities, and dose monitoring dashboards.
Technology-led differentiation is also shifting buying criteria beyond slice count, with more attention on spectral imaging and photon-counting ecosystems, alongside mobility use cases. Recent vendor actions point to where opportunity is concentrating. Philips introduced its Rembra CT at ECR 2026 for acute, high-demand imaging environments, and Siemens Healthineers collaborated with WH Bence on a hybrid-powered mobile CT unit for community lung cancer screening in the UK. Together, these moves align portable and outreach models with screening expansion and access goals. On the supply side, localization initiatives and specialized production investments, including Siemens Healthineers planned Forchheim expansion tied to photon-counting detector technology, support opportunities around lead-time reduction, sustainability targets, and continuity of critical components. This is relevant as providers evaluate premium platforms with multi-year software and service roadmaps.
Recent Industry Developments
- July 2026: Siemens Healthineers collaborated with WH Bence to develop the UKs first hybrid-powered mobile CT unit based on the SOMATOM go.Up platform for community lung cancer screening. The configuration supports off-grid and lower-emission deployment, which helps scale outreach imaging where fixed-site capacity and transport constraints limit participation in screening pathways.
- April 2026: Philips received FDA 510(k) clearance for its Spectral CT Verida system, and the company positioned the platform around detector-based spectral imaging and AI-enabled workflow. Although the clearance is US-based, the launch strengthens the installed-base roadmap for spectral CT features that compete for European tenders focused on dose management, diagnostic confidence, and software-driven differentiation.
- March 2026: Philips introduced the Rembra CT system at ECR 2026 in Vienna for high-demand acute and radiology imaging environments. The launch highlights vendor emphasis on speed, patient access, and workflow optimization, supporting hospital and oncology-oriented users seeking shorter cycle times and tighter integration with advanced clinical pathways.


Research Methodology Framework and Report Scope
Market Definition and Coverage
This market covers revenues generated in Europe from computed tomography (CT) imaging solutions used in healthcare settings, including system sales and the linked software, hardware, and service value that supports clinical use.
Scope exclusions: We exclude non-medical CT used for industrial inspection and security screening, and we also exclude MRI, ultrasound, X-ray (non-CT), and nuclear imaging modalities.
Segmentation Overview
- By Technology (Slice & Mode)
- Low-End (<16-slice)
- Mid-End (16-64-slice)
- High-End (>64-slice)
- Dual-/Spectral Energy CT
- Cone-Beam CT (CBCT)
- Photon-Counting CT
- By Product Type
- Stationary CT Systems
- Mobile / Portable CT Systems
- By Application
- Oncology
- Cardiology
- Neurology
- Musculoskeletal
- Vascular
- Pulmonology
- ENT & Dental / Maxillofacial
- Trauma & Emergency
- By End User
- Hospitals
- Diagnostic Imaging Centers
- Ambulatory Surgery Centers
- Research & Academic Institutes
- Veterinary Clinics
- By Component
- Hardware (Scanners)
- Software
- Services
- By Geography
- Germany
- United Kingdom
- France
- Italy
- Spain
- Rest of Europe
Data Sources, Market Sizing, and Validation
Desk Research
Desk work started by building a clean fact base on imaging fleets, procedure trends, and country-level healthcare spend patterns, since these indicators help anchor how CT demand can realistically move over time. We referred to public sources such as Eurostat health statistics, OECD Health data, the World Health Organization, European Commission pages linked to the EU Medical Device Regulation, and national health ministry publications and procurement notices where available.
To keep the estimates grounded, we also reviewed device registration and safety updates from official regulators, peer-reviewed radiology journals for utilization and dose trends, and investor presentations and annual filings from major CT system suppliers. In parallel, our team used paid subscriptions for company financials and news intelligence, and a patent database to track technology direction (like photon counting and spectral CT) that can affect pricing and replacement timing. These examples are not exhaustive, and other public sources were used for data collection, validation, and research clarification.
Primary Interviews and Surveys
Primary work was used to turn the desk assumptions into model inputs, especially on replacement cycles, mix shifts by slice class, pricing movement, and service attach rates that are not consistently published. We spoke with respondents across Western, Northern, Southern, and Central Europe so regional procurement pace, tender behavior, and installation constraints could be checked before finalizing the model.
Distribution of primary research fieldwork respondents
| Company type | Respondent position |
|---|---|
| Top tier: 30% | CXOs: 12% |
| Mid tier: 53% | Functional/Unit leaders: 32% |
| Smaller Players: 17% | Managers: 56% |
Market-Sizing & Forecasting
Sizing was built using a top-down and bottom-up hybrid approach, where country demand pools were reconstructed first and then checked against supplier-side signals. On the top-down side, we combined indicators such as installed base and replacement timing, CT procedure growth by key clinical areas, public and private capital budgets for imaging, and the share shift toward higher end systems (including spectral and photon counting) that tends to lift average selling prices.
The totals were then corroborated with selective bottom-up approximations, including sampled system pricing by configuration, typical service contract attachment and renewal rates, and channel checks on tender volumes and delivery lead times, with gaps handled through clearly stated proxy assumptions by country group. For forecasting, we used scenario analysis because CT demand is sensitive to hospital investment cycles and regulatory timing, and we tuned scenarios using expert feedback on utilization recovery, staffing constraints, and technology driven replacement pull-through.
Data Validation & Update Cycle
Outputs were cross-checked against independent signals, including reported imaging capital spend direction, public tender announcements, and observed mix changes toward portable CT and higher slice platforms, and then variances were investigated before sign-off. When a number looked off, we re-opened the assumptions, revisited the country split, and re-contacted selected interviewees if the gap could not be explained by the desk evidence.
A multi-step internal review is followed so the logic and arithmetic are consistent across countries, segments, and years. Reports are refreshed annually, and interim updates are triggered when material events occur, such as major regulatory shifts, sudden pricing changes, or a noticeable swing in procurement activity. Before delivery, we do a final pass to ensure the latest public and market signals are reflected.
Mordor Intelligence's Europe Ct Market Market Sizing Compared With Other Published Estimates
Published CT market values for Europe do not always line up because the scope and counting rules differ, even when the titles look similar. Differences usually come from what is included beyond the scanner itself, the year used as the base, and how pricing and mix shift are treated during the forecast.
Some estimates focus only on CT devices and then scale the market using broad growth rates, and others roll up wider imaging spend categories that can pull in adjacent modalities or non-hospital demand. Mordor Intelligence treats CT as a component-based market (hardware, software, and services) and keeps the geography fixed to Europe with consistent country coverage, so totals are not inflated by non-CT imaging or non-medical CT activity.
Benchmark comparison
| Source | Market Size | Gaps in Research Methodology |
|---|---|---|
| Mordor Intelligence | USD 2.61 B (2025) | |
| Industry Publisher A | USD 6.04 B (2024) | This figure is presented as CT devices for Europe and appears to lean toward a broad device-led rollup, which can vary by how multi-slice, cone beam, and portable systems are counted and whether service and software are treated consistently year to year. |
| Regional Consultancy B | USD 1.72 B (2026) | This value is stated for a later year and is likely shaped by a narrower system-only framing and different base-year timing, which can understate the impact of service attachment and mix shift toward higher end platforms. |
Taken together, the spread is mainly explained by scope width and timing, not by a single right or wrong number. By keeping the same Europe country set, separating CT from adjacent imaging categories, and applying transparent inputs like replacement cycles, utilization trend, and mix-based pricing, the resulting estimate stays traceable to repeatable steps that can be rechecked as the market evolves.


Key Questions Answered in the Report
How big is the Europe CT Market?
The Europe CT Market size is expected to reach USD 2.77 billion in 2026 and grow at a CAGR of 6.14% to reach USD 3.74 billion by 2031.
What is the current Europe CT Market size?
In 2026, the Europe CT Market size is expected to reach USD 2.77 billion.
Who are the key players in Europe CT Market?
GE Healthcare, Koninklijke Philips NV, Siemens AG, Canon Medical Systems and Hitachi Medical Systems are the major companies operating in the Europe CT Market.
What years does this Europe CT Market cover, and what was the market size in 2025?
In 2025, the Europe CT Market size was estimated at USD 2.77 billion. The report covers the Europe CT Market historical market size for years: 2021, 2022, 2023 and 2024. The report also forecasts the Europe CT Market size for years: 2026, 2027, 2028, 2029, 2030 and 2031.
Page last updated on:





