Market Overview
| Study Period | 2020 - 2031 |
|---|---|
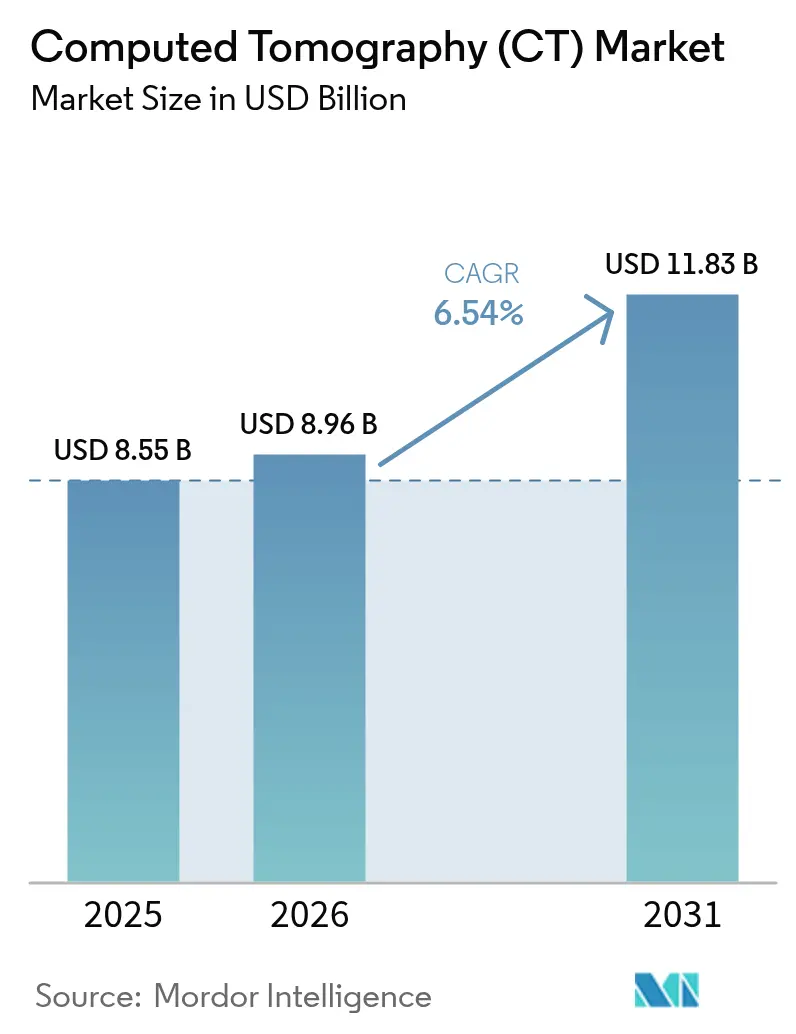
| Market Size (2026) | USD 8.96 Billion |
| Market Size (2031) | USD 11.83 Billion |
| Growth Rate (2026 - 2031) | 6.54% CAGR |
| Fastest Growing Market | Asia Pacific |
| Largest Market | North America |
| Market Concentration | Medium |
Major Players *Disclaimer: Major Players sorted in no particular order Image © Mordor Intelligence. Reuse requires attribution under CC BY 4.0. | |
Computed Tomography (CT) Market Analysis by Mordor Intelligence
The Computed Tomography Market size was valued at USD 8.55 billion in 2025 and is estimated to grow from USD 8.96 billion in 2026 to reach USD 11.83 billion by 2031, at a CAGR of 6.54% during the forecast period (2026-2031).
Photon-counting detectors, AI-enabled workflow automation, and service-driven financing models are shortening replacement cycles and widening global access. Vendors are commercializing scanners that deliver sub-millisievert protocols, and regulators have cleared more than 240 radiology AI algorithms since 2024, cutting median read times for chest CT by roughly one-fifth.[1] U.S. Food and Drug Administration, “Radiology AI Device Clearances,” FDA.gov Hospitals are shifting from capital expenditure to outcome-based leases, pushing services revenue ahead of hardware growth. High-slice and spectral systems are becoming standard in tertiary centers, while portable CT fills critical-care gaps. In parallel, mid-income countries are funding large procurement programs, creating fresh demand for high-slice platforms from local and multinational suppliers.
Key Report Takeaways
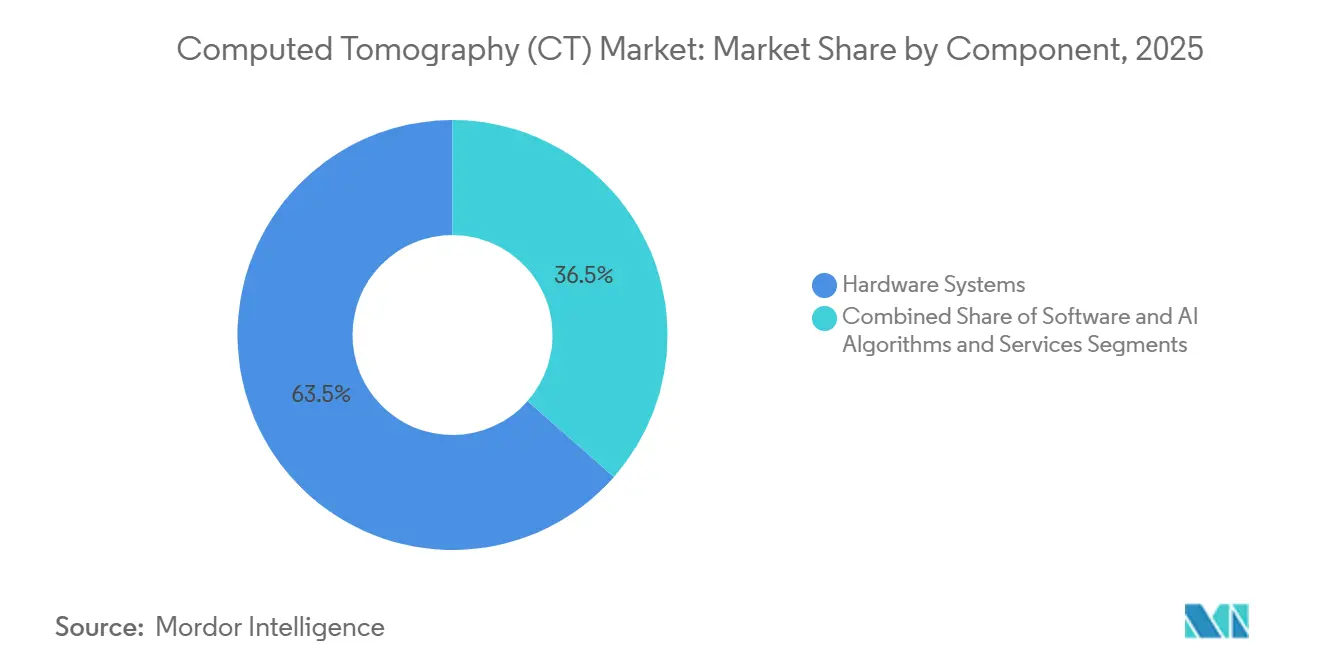
- By component, hardware led with 63.52% share in 2025, while services are forecast to expand at a 9.35% CAGR through 2031.
- By slice count, mid-slice scanners accounted for 44.11% of computed tomography market share in 2025, whereas high-slice systems are projected to advance at a 10.46% CAGR to 2031.
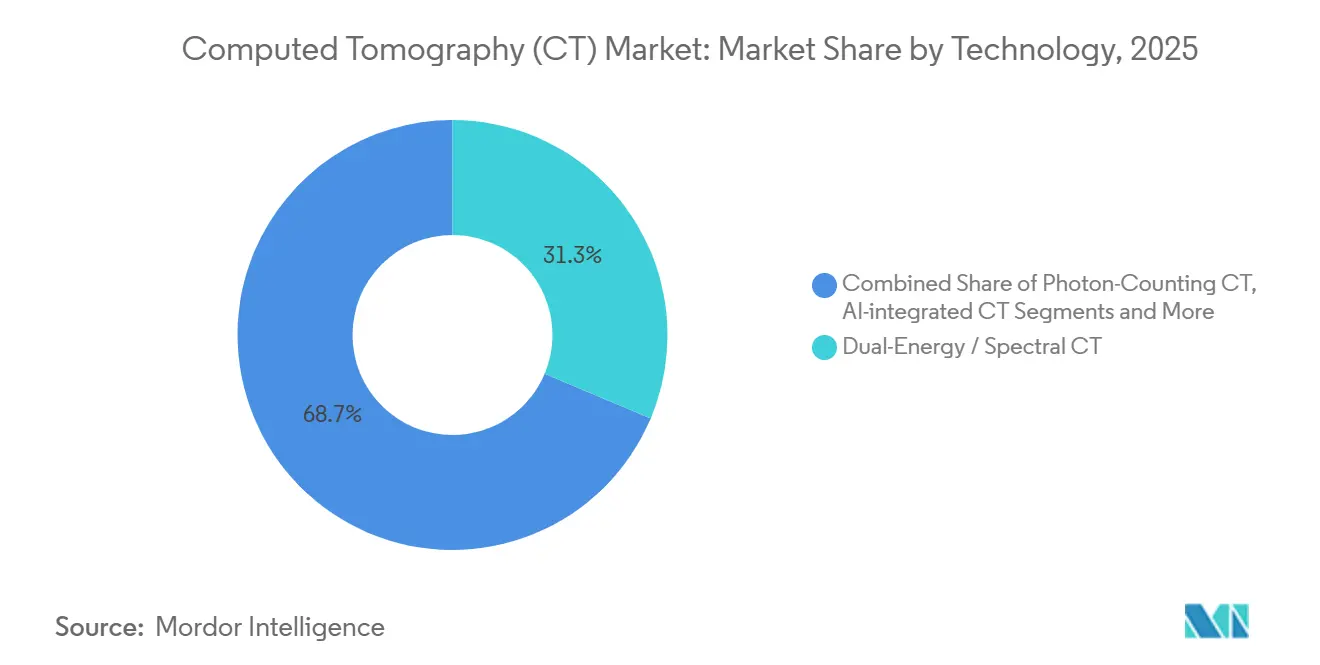
- By technology, dual-energy and spectral CT platforms held 31.34% of computed tomography market size in 2025, but photon-counting CT is expected to climb at a 10.32% CAGR through 2031.
- By modality, stationary units made up 81.54% of shipments in 2025, yet portable CT is the fastest-growing modality at a 10.93% CAGR.
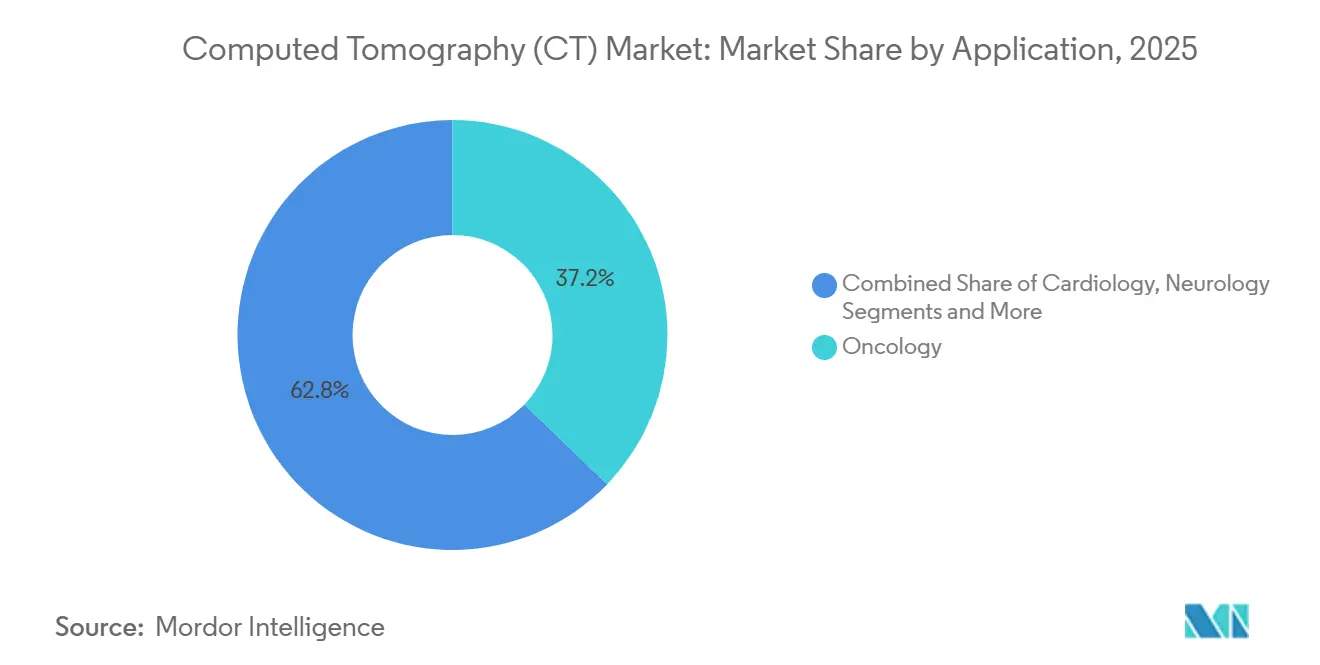
- By application, oncology contributed 37.22% share in 2025, whereas cardiology imaging is poised to register an 8.63% CAGR to 2031.
- By end user, hospitals installed 56.71% of scanners in 2025, while ambulatory surgical and specialty centers are projected to grow at an 8.82% CAGR over the forecast horizon.
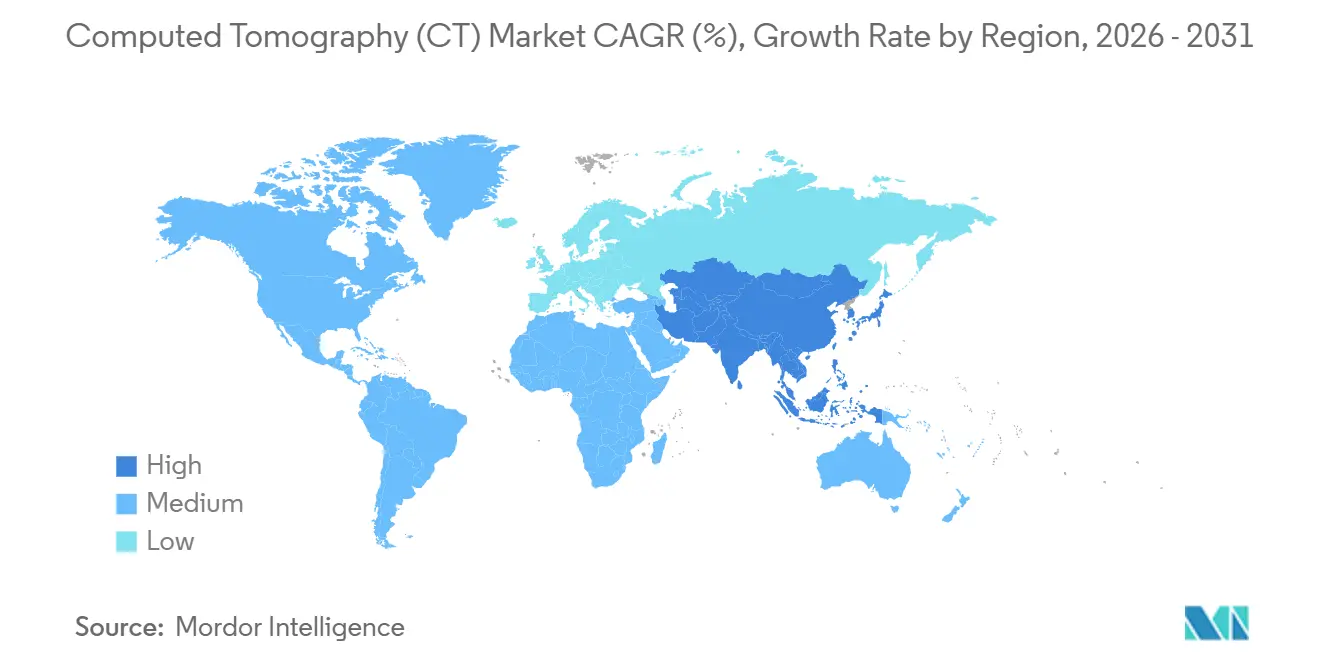
- By geography, North America retained 36.16% revenue share in 2025, while Asia-Pacific is forecast to expand at an 8.04% CAGR through 2031.
Note: Market size and forecast figures in this report are generated using Mordor Intelligence’s proprietary estimation framework, updated with the latest available data and insights as of 2026.
Global Computed Tomography (CT) Market Trends and Insights
Driver Impact Analysis*
| Driver | (~) % Impact on CAGR Forecast | Geographic Relevance | Impact Timeline |
|---|---|---|---|
| Technological Advances in Detector Design & Iterative Reconstruction | +1.2% | Global, early adoption in North America and Western Europe | Medium term (2-4 years) |
| Rising Global Burden of Oncology & Cardiovascular Diseases | +1.5% | Global, aging populations in North America, Europe, East Asia | Long term (≥ 4 years) |
| Expansion of High-Slice & Spectral CT in Emerging Economies | +1.1% | China, India, Middle East, Africa | Medium term (2-4 years) |
| AI-Enabled Workflow Automation | +0.9% | North America, EU, urban APAC | Short term (≤ 2 years) |
| Photon-Counting CT Launches | +0.8% | North America, Western Europe, APAC diffusion | Medium term (2-4 years) |
| Pay-Per-Scan & Leasing Models | +0.7% | Global, strongest in North America and Latin America | Short term (≤ 2 years) |
| Source: Mordor Intelligence | |||
Technological Advances in Detector Design & Iterative Reconstruction
Iterative reconstruction and new detector materials let clinicians achieve sub-millisievert studies while preserving diagnostic quality, cutting dose by up to 60%. Silicon photomultipliers boost photon-detection efficiency, and 0.25 mm elements now resolve coronary stents previously invisible on legacy systems.[2]U.S. Food and Drug Administration, “Radiology Devices: Iterative Reconstruction and Dose-Reduction Guidance,” U.S. Food and Drug Administration, fda.gov
Rising Global Burden of Oncology & Cardiovascular Diseases
Cancer and cardiovascular disease caused 31 million deaths in 2024, more than half of global mortality, driving sustained CT demand for screening, staging, and perfusion studies. In oncology, the National Comprehensive Cancer Network revised its lung-cancer screening guidelines in 2024 to recommend annual low-dose CT for adults aged 50 to 80 with a 20 pack-year smoking history, expanding the eligible U.S. population from 8 million to 14.5 million individuals
Expansion of High-Slice & Spectral CT in Emerging Economies
Government programs in China and India mandate installation of 64-slice or higher systems, while Saudi Arabia and Brazil channel infrastructure budgets toward dual-energy platforms.[3]National Health Commission of China, “14th Five-Year Plan for County-Level Hospital Diagnostic Imaging Upgrades,” National Health Commission of China, nhc.gov.cn India's Pradhan Mantri Ayushman Bharat Health Infrastructure Mission, launched in 2021 and expanded in 2024, earmarked USD 3.2 billion to establish 17,000 health and wellness centers equipped with diagnostic imaging, including CT, by 2027. These programs favor dual-energy CT.
AI-Enabled Workflow Automation
FDA-cleared triage and segmentation algorithms now flag critical findings within seconds and trim reading time 20%-30%, easing radiologist shortages in rural regions. AI algorithms that triage urgent findings—such as intracranial hemorrhage, pulmonary embolism, and aortic dissection—are compressing time-to-diagnosis and enabling radiologists to prioritize critical cases. Aidoc's FDA-cleared suite of seven CT algorithms, deployed in over 1,000 hospitals by mid-2025, flags abnormal scans within seconds and routes them to on-call radiologists via mobile alerts
Restraint Impact Analysis*
| Restraint | (~) % Impact on CAGR Forecast | Geographic Relevance | Impact Timeline |
|---|---|---|---|
| High Capital & Lifecycle Costs of Premium CT Systems | -0.8% | Global, acute in emerging markets | Long term (≥ 4 years) |
| Radiation-Dose Safety Concerns & Tightening Regulations | -0.5% | North America, EU, expanding to APAC | Medium term (2-4 years) |
| Competition From MRI & Ultrasound | -0.4% | North America, Western Europe | Long term (≥ 4 years) |
| Rare-Earth Supply Constraints | -0.3% | Global, impact on high-slice systems | Short term (≤ 2 years) |
| Source: Mordor Intelligence | |||
High Capital & Lifecycle Costs of Premium CT Systems
Photon-counting or dual-energy scanners list between USD 1.8 million and USD 3.5 million, and tube replacements can exceed USD 250,000, steering price-sensitive buyers toward mid-slice or refurbished units.
Radiation-Dose Safety Concerns & Tightening Regulations
Cumulative radiation exposure from medical imaging remains a public-health concern, particularly for pediatric and young-adult populations. EU MDR 2017/745 now obligates dose-tracking software, and the FDA is drafting mandatory thresholds, raising compliance costs and reducing discretionary scans
*Our forecasts treat driver/restraint impacts as directional, not additive. The impact forecasts reflect baseline growth, mix effects, and variable interactions.
Segment Analysis
By Component: Services Gain as Hardware Commoditizes
Hardware represented 63.52% of computed tomography market revenue in 2025, but services are set to outpace with a 9.35% CAGR, reflecting hospitals’ preference for uptime guarantees and software subscriptions. Maintenance contracts deliver 35%-45% gross margins, compared with 20%-25% on hardware. Predictive maintenance programs cut downtime by 30%, reinforcing the annuity stream.
Services now absorb rising demand for iterative reconstruction upgrades, cybersecurity patches, and regulatory audits. Combined, these factors underline why vendors treat services as the anchor of the computed tomography market.


By Slice Count: High-Slice Systems Lead Replacement Wave
Mid-slice platforms held 44.11% of computed tomography market share in 2025, but high-slice models will grow 10.46% annually as oncology and trauma protocols demand sub-millimeter resolution. High-slice scanners complete whole-body trauma scans in under 10 seconds, crucial for unstable patients.
Low-slice units are declining except in biopsy suites and dental practices, while cone-beam CT is carving out a niche in orthopedics thanks to compact footprints and lower cost. The computed tomography market size for high-slice platforms is projected to rise sharply once photon-counting becomes mainstream.
By Technology: Photon-Counting Disrupts Dual-Energy
Dual-energy and spectral scanners accounted for 31.34% of 2025 revenue, but photon-counting CT is projected to climb at a 10.32% CAGR to 2031, eroding legacy architectures. Photon-counting tallies individual photons, delivers intrinsic spectral data, and lowers iodine dose by 40%.
Iterative reconstruction is now table stakes, baked into nearly every new model, while AI-integrated control loops adjust tube current in real time. Hospitals weigh photon-counting benefits against reimbursement gaps, yet early adopters report sharper images at lower dose, accelerating fleet renewal. As spectral precision becomes routine, photon-counting platforms will reshape the computed tomography market share landscape.
By Modality: Portable CT Accelerates in Critical Care
Stationary systems dominated shipments with an 81.54% share in 2025, but portable CT is advancing at a 10.93% CAGR as intensive-care and emergency units demand bedside imaging. Portable scanners eliminate risky patient transfers and cut time-to-diagnosis for intracranial hemorrhage by nearly 50 minutes.
COVID-19 protocols validated the point-of-care model, prompting hospitals to retain mobile fleets for infection control and critical-care efficiency. Hybrid PET-CT and SPECT-CT remain niche yet indispensable in oncology and cardiology, respectively. While stationary units stay the workhorse for routine studies, portable growth will lift computed tomography market size across critical-care corridors.
By Application: Cardiology Closes Gap on Oncology
Oncology led with 37.22% of 2025 volume, yet cardiology imaging is set to expand at an 8.63% CAGR as coronary CT angiography replaces invasive catheterization for stable chest pain. Spectral protocols quantify myocardial perfusion, reducing the need for separate nuclear studies.
Stroke guidelines now call for CT angiography and perfusion imaging for suspected large-vessel occlusion, bolstering neuro applications. Musculoskeletal trauma relies on 3-D reconstructions for surgical planning, while vascular studies remain emergency staples. Cardiology’s rapid rise is narrowing the computed tomography market share gap with oncology
By End User: Ambulatory Centers Capture Growth
Hospitals installed 56.71% of scanners in 2025, but ambulatory surgical and specialty centers are forecast to grow at an 8.82% CAGR as procedures migrate to outpatient settings. Pay-per-scan contracts let these centers access high-slice technology without major capital outlays.
Diagnostic imaging centers leverage economies of scale and higher reimbursement for freestanding facilities, while hospital budgets face pressure from value-based care. In regions where freestanding imaging is restricted, hospitals retain dominance, yet outpatient momentum is unmistakable. Ambulatory expansion will underpin future computed tomography market size gains, especially in North America and Western Europe.
Geography Analysis
North America contributed 36.16% of computed tomography market revenue in 2025, supported by favorable reimbursement and the continent’s dense imaging network. The average installed scanner age reached 9.2 years in 2024, indicating pending replacement demand.
Asia-Pacific is the growth engine, expanding at an 8.04% CAGR as China’s health commission directs USD 12 billion toward 3,000 county-hospital installations and India’s Ayushman Bharat boosts diagnostic coverage. Local vendors United Imaging and Mindray undercut Western prices by up to 40%, accelerating penetration.
Europe shows moderate growth as MDR dose rules raise compliance costs. Germany earmarked EUR 1.2 billion for upgrades tied to dose-reduction targets, and the UK allocated GBP 400 million to cut imaging backlogs. Latin America and the Middle East showcase faster upticks from infrastructure drives in Saudi Arabia and Brazil, though currency risk tempers some procurements.

Competitive Landscape
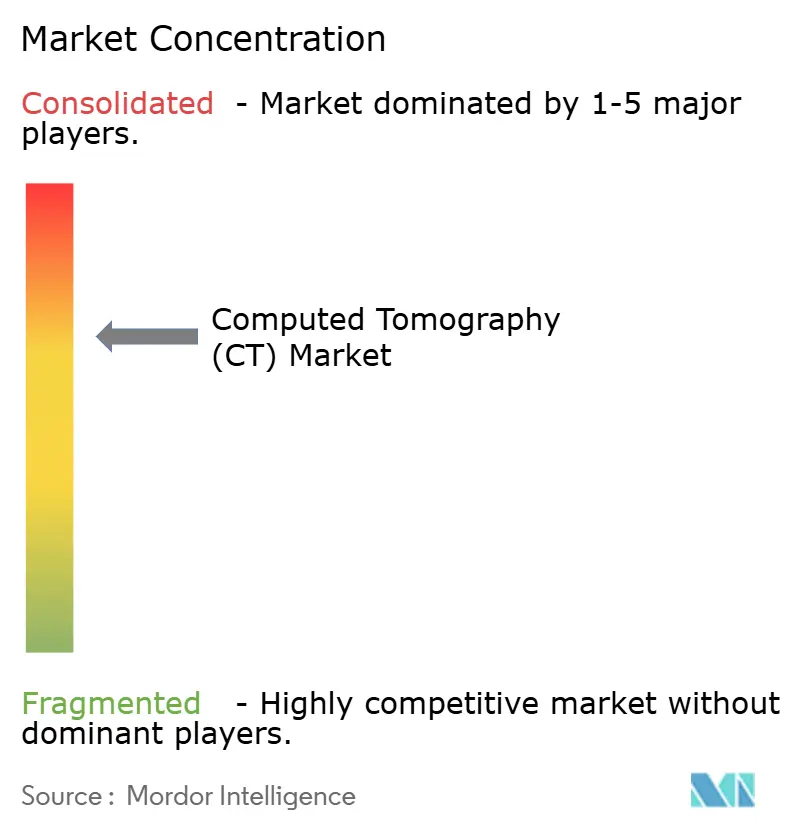
The computed tomography market remains moderately concentrated. Siemens leads photon-counting, GE excels in AI reconstruction, Philips bundles multiyear service contracts, and Canon targets cardiac imaging. Chinese firms United Imaging and Mindray grow in emerging markets through aggressive pricing and local service.
Portable CT is dominated by Samsung NeuroLogica and GE, while dental and orthopedic cone-beam niches attract CurveBeam AI and Planmed. Patent filings are brisk, with 1,240 CT-related grants in 2024, 42% belonging to Siemens, GE, and Philips. Regulatory barriers around FDA and CE clearances shield incumbents, but financing models and AI differentiation keep the field highly dynamic.
Computed Tomography (CT) Industry Leaders
Canon Medical Systems Corporation
GE Healthcare
Koninklijke Philips NV
Siemens Healthineers
United Health Imaging
- *Disclaimer: Major Players sorted in no particular order

Recent Industry Developments
- January 2026: Sri Ramachandra Institute installed a GE Revolution Apex Elite 512-slice scanner for low-dose, high-resolution imaging
- November 2025: Canon won FDA clearance for its Alphenix 4D CT with Aquilion ONE / INSIGHT, an Angio-CT hybrid suite
- August 2025: Neusoft’s NeuViz P10 photon-counting CT gained NMPA approval, the first wide-body system of its kind in China
- January 2025: Philips debuted the AI-enabled CT 5300 at AOCR 2025


Global Computed Tomography (CT) Market Report Scope
As per the scope of the report, computed tomography (CT) is an imaging process that customizes special X-ray equipment to generate a sequence of exhaustive images or scans of areas inside the body.
The Computed Tomography Market Report is segmented by Component, Slice Count, Technology, Modality, Application, End User, and Geography.
By Component, the market is segmented into Hardware Systems, Software & AI Algorithms, and Services. By Slice Count, the market is segmented into Low-slice, Mid-slice, High-slice, and Cone Beam CT. By Technology, the market is segmented into Dual-Energy/Spectral CT, Photon-Counting CT, Iterative Reconstruction CT, and AI-integrated CT. By Modality, the market is segmented into Stationary CT, Portable CT, and Hybrid PET-CT/SPECT-CT systems. By Application, the market is segmented into Oncology, Cardiology, Neurology, Musculoskeletal & Trauma, Vascular, and Others. By End User, the market is segmented into Hospitals, Diagnostic Imaging Centers, and Ambulatory Surgical & Specialty Centers. By Geography, the market is segmented into North America, Europe, Asia-Pacific, Middle East & Africa, and South America. The market report also covers the estimated market sizes and trends for 17 countries across major regions globally. Market Forecasts are Provided in Terms of Value (USD).
By Component
| Hardware Systems |
| Software & AI Algorithms |
| Services (Installation, Maintenance, Up-grades) |
By Slice Count
| Low-slice (Less than 16) CT |
| Mid-slice (16–64) CT |
| High-slice ( More than 64) CT |
| Cone Beam CT |
By Technology
| Dual-Energy / Spectral CT |
| Photon-Counting CT |
| Iterative Reconstruction CT |
| AI-integrated CT |
By Modality
| Stationary CT |
| Portable CT |
| Hybrid PET-CT / SPECT-CT |
By Application
| Oncology |
| Cardiology |
| Neurology |
| Musculoskeletal & Trauma |
| Vascular & Others |
By End User
| Hospitals |
| Diagnostic Imaging Centers |
| Ambulatory Surgical & Specialty Centers |
By Geography
| North America | United States |
| Canada | |
| Mexico | |
| Europe | Germany |
| France | |
| United Kingdom | |
| Italy | |
| Spain | |
| Rest of Europe | |
| Asia-Pacific | China |
| Japan | |
| India | |
| South Korea | |
| Australia | |
| Rest of Asia-Pacific | |
| Middle East & Africa | GCC |
| South Africa | |
| Rest of Middle East & Africa | |
| South America | Brazil |
| Argentina | |
| Rest of South America |
| By Component | Hardware Systems | |
| Software & AI Algorithms | ||
| Services (Installation, Maintenance, Up-grades) | ||
| By Slice Count | Low-slice (Less than 16) CT | |
| Mid-slice (16–64) CT | ||
| High-slice ( More than 64) CT | ||
| Cone Beam CT | ||
| By Technology | Dual-Energy / Spectral CT | |
| Photon-Counting CT | ||
| Iterative Reconstruction CT | ||
| AI-integrated CT | ||
| By Modality | Stationary CT | |
| Portable CT | ||
| Hybrid PET-CT / SPECT-CT | ||
| By Application | Oncology | |
| Cardiology | ||
| Neurology | ||
| Musculoskeletal & Trauma | ||
| Vascular & Others | ||
| By End User | Hospitals | |
| Diagnostic Imaging Centers | ||
| Ambulatory Surgical & Specialty Centers | ||
| By Geography | North America | United States |
| Canada | ||
| Mexico | ||
| Europe | Germany | |
| France | ||
| United Kingdom | ||
| Italy | ||
| Spain | ||
| Rest of Europe | ||
| Asia-Pacific | China | |
| Japan | ||
| India | ||
| South Korea | ||
| Australia | ||
| Rest of Asia-Pacific | ||
| Middle East & Africa | GCC | |
| South Africa | ||
| Rest of Middle East & Africa | ||
| South America | Brazil | |
| Argentina | ||
| Rest of South America | ||


Key Questions Answered in the Report
How large will the computed tomography market be by 2031?
It is projected to reach USD 12.59 billion in 2031, expanding at a 6.48% CAGR over 2026-2031.
Which component is growing fastest within the computed tomography space?
Services, including maintenance and software subscriptions, are forecast to climb at a 9.35% CAGR as hospitals favor outcome-based contracts.
Why is Asia-Pacific the quickest-growing region for computed tomography?
Government hospital build-outs in China and India, coupled with competitively priced high-slice systems from local vendors, drive an 8.04% CAGR.
What technology trend is accelerating scanner replacement cycles?
Photon-counting CT delivers multi-energy data at lower dose, prompting many hospitals to plan fleet upgrades before the usual 15-year cycle.
How are financing models changing CT adoption?
Pay-per-scan and leasing contracts spread costs over the scanner’s life, cutting first-year expenses by up to 80% and enabling access for smaller facilities.
Page last updated on:


