Market Overview
| Study Period | 2020 - 2031 |
|---|---|
| Forecast Data Period | 2026 - 2031 |
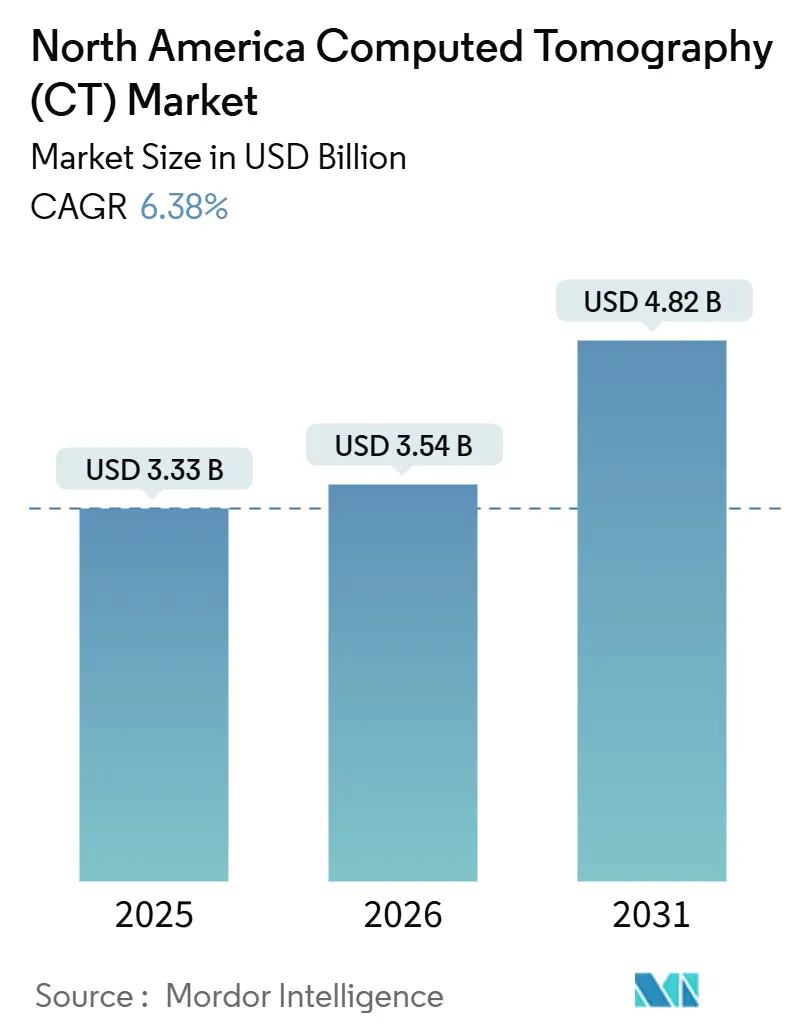
| Base Year Market Size (2025) | USD 3.33 Billion |
| Market Size (2026) | USD 3.54 Billion |
| Market Size (2031) | USD 4.82 Billion |
| Growth Rate (2026 - 2031) | 6.38% CAGR |
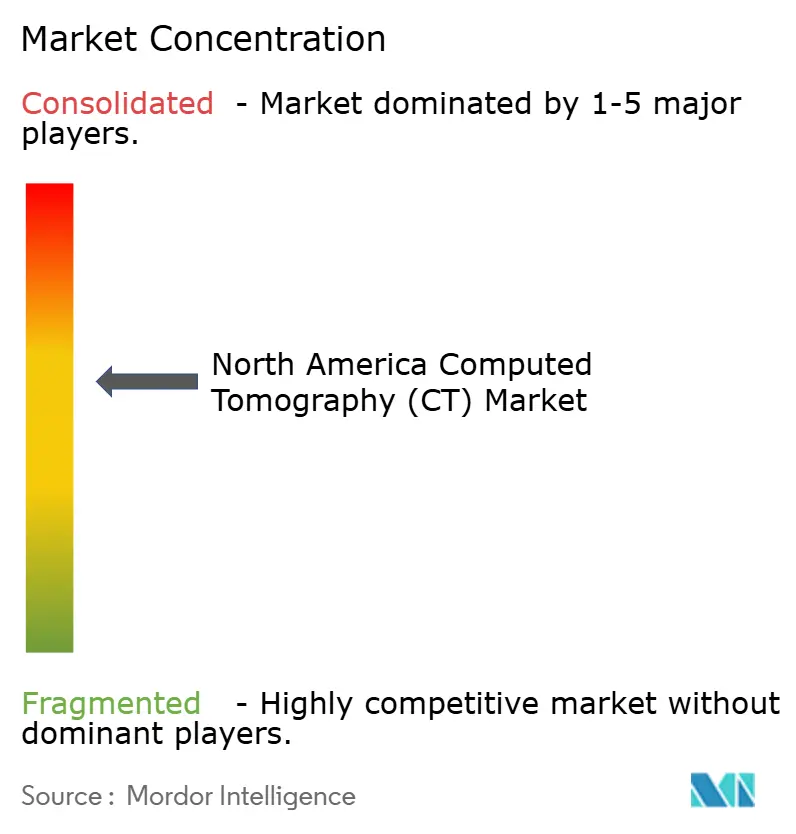
| Market Concentration | Medium |
Major Players *Disclaimer: Major Players sorted in no particular order Image © Mordor Intelligence. Reuse requires attribution under CC BY 4.0. | |
North America Computed Tomography (CT) Market Analysis by Mordor Intelligence
The North America Computed Tomography Market size is projected to be USD 3.33 billion in 2025, USD 3.54 billion in 2026, and reach USD 4.82 billion by 2031, growing at a CAGR of 6.38% from 2026 to 2031.
This trajectory reflects vigorous capital spending on imaging modernization, favorable reimbursement revisions, and rapid technology clearances that shorten adoption cycles. As of late 2025, the FDA has authorized over 1,350 AI-enabled devices, with radiology accounting for roughly 76%–77% of all total medical AI authorizations.[1]U.S. Food and Drug Administration, “510(k) Database,” fda.gov Medicare doubled coronary CT angiography payment from USD 175 to USD 357.13 in 2025, immediately elevating cardiac imaging volumes across U.S. facilities.[2]Centers for Medicare & Medicaid Services, “Physician Fee Schedule 2026,” cms.gov Parallel growth in portable architectures signals a shift toward point-of-care diagnostics, especially in emergency and intensive-care settings.
Key Report Takeaways
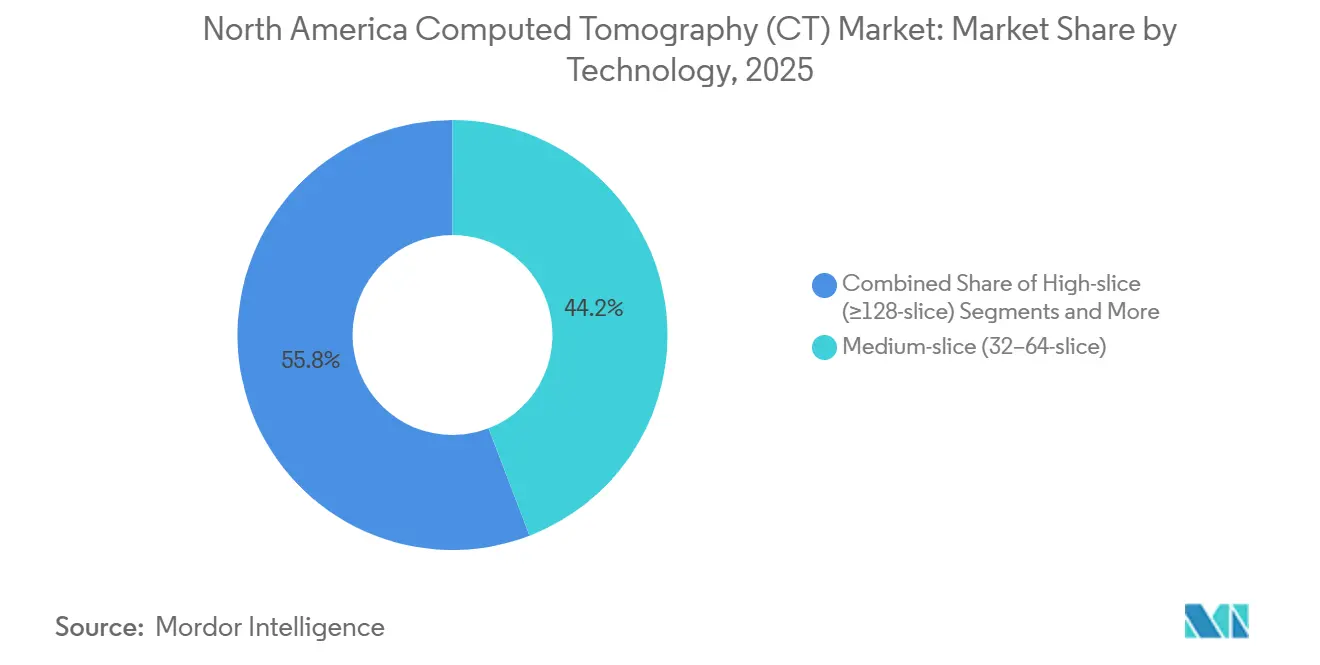
- By technology, medium-slice scanners commanded 44.16% of the North America computed tomography (CT) market share in 2025, while ≥128-slice configurations are advancing at a 6.94% CAGR through 2031.
- By product type, stationary scanners captured 85.79% of the North America computed tomography (CT) market size in 2025, and portable units are expanding at 7.09% from 2026 to 2031.
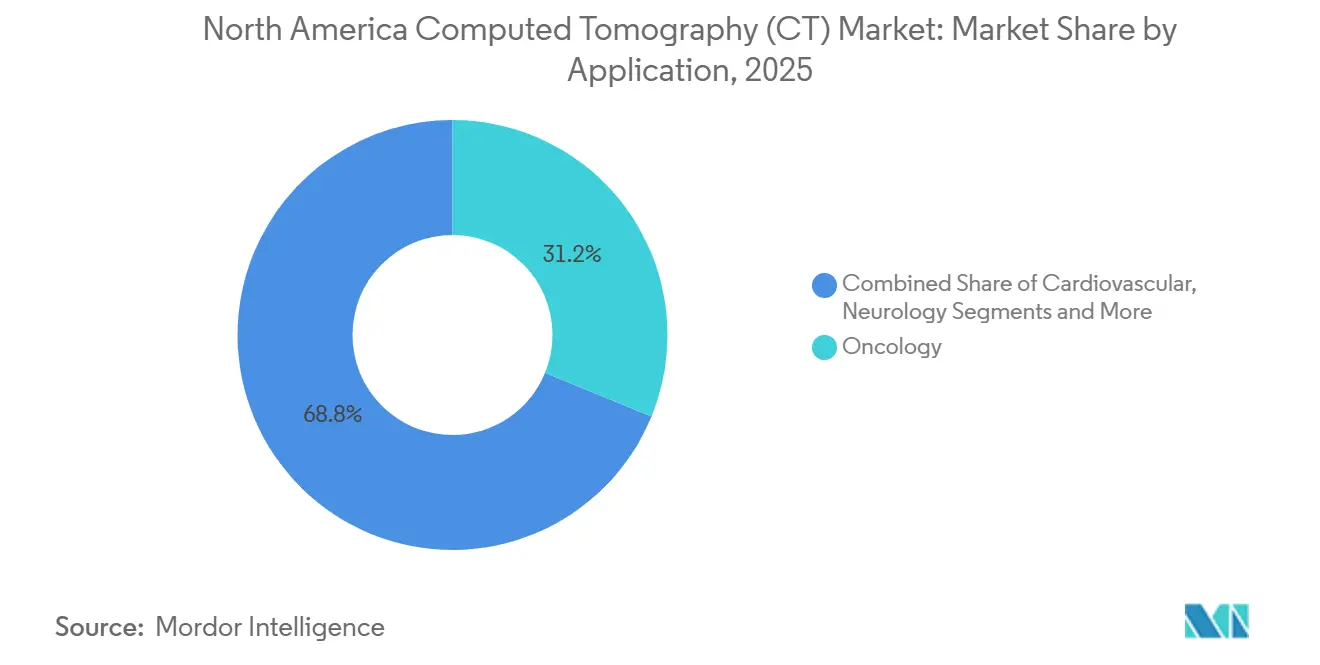
- By application, oncology accounted for 31.18% of 2025 procedure volume, and cardiovascular imaging is projected to post a 6.71% CAGR through 2031.
- By end user, ambulatory surgical centers are growing at a 7.34% CAGR, outpacing hospital adoption during 2026-2031.
- By geography, the United States accounted for 92.67% of regional revenue in 2025 and is forecast to grow at 7.85% through 2031.
Note: Market size and forecast figures in this report are generated using Mordor Intelligence’s proprietary estimation framework, updated with the latest available data and insights as of January 2026.
North America Computed Tomography (CT) Market Trends and Insights
Drivers Impact Analysis*
| DRIVER | (~) % IMPACT ON CAGR | GEOGRAPHIC RELEVANCE | IMPACT TIMELINE |
|---|---|---|---|
| Rising prevalence of chronic diseases | +1.8% | Highest impact in US Medicare population | Long term (≥ 4 years) |
| Advances in low-dose multi-slice CT technology | +1.5% | US & Canada leading adoption, Mexico following | Medium term (2–4 years) |
| Expanding geriatric imaging volumes | +1.2% | Concentrated in US & Canadian healthcare systems | Long term (≥ 4 years) |
| Favorable reimbursement & replacement cycles | +0.9% | US Medicare/Medicaid systems, limited Canadian impact | Short term (≤ 2 years) |
| Growth of outpatient/mobile CT centers | +0.7% | US ambulatory surgical centers, Canadian private clinics | Medium term (2–4 years) |
| AI-enabled workflow optimization | +0.4% | North America technology leaders, gradual Mexico adoption | Medium term (2–4 years) |
| Source: Mordor Intelligence | |||


Rising Prevalence of Chronic Diseases
With rising cancer rates and increasing cardiac risk factors, the demand for imaging services remains a critical component of healthcare budgets. Projections indicate a 3.2% increase in new cancer cases in the United States, reaching 2.1 million cases by 2026.[3]American College of Cardiology, “2024 Chest Pain Guideline,” acc.orgAdditionally, nearly half of United States adults are managing at least one chronic condition, driving the need for regular CT surveillance. Expanded eligibility for lung cancer screenings in 2021 is expected to add 6.4 million new candidates by 2025, although current uptake remains below 20%, presenting significant growth potential. Updated 2024 guidelines have positioned coronary CT angiography as the preferred method for evaluating stable chest pain, shifting referrals away from traditional catheterization. By 2030, adults aged 65 and older will account for 21% of the United States population.[4]U.S. Census Bureau, “2025 Population Estimates,” census.gov This age group, which utilizes CT scans at a rate 3.5 times higher than younger individuals, is expected to drive sustained growth in imaging volumes.
Advances in Low-Dose Multi-Slice CT Technology
Photon-counting detectors and deep-learning reconstruction cut dose while heightening contrast resolution, expanding CT’s utility in pediatric and screening workflows. Siemens’ NAEOTOM Alpha received Health Canada clearance in 2024, opening the door for competing photon-counting systems. Canon’s DLIR platform trimmed reconstruction steps by 40%, evidencing measurable workflow savings. FDA data show that 80% of AI devices cleared in 2024 targeted imaging, underscoring a regulatory environment that rewards dose-efficient innovation.
Expanding Geriatric Imaging Volumes
North America’s 65-plus population demonstrates CT utilization rates three to four times higher than those of younger cohorts, driven by complex diagnostic requirements. Outpatient visits among Medicare recipients grew 14% from 2005 to 2015 and continue to rise. Provincial authorities in Canada responded by allocating CAD 10 million (USD 7.4 million) to new scanners in British Columbia alone. These demographic realities lock in long-run baseline growth for the North America computed tomography market.
Favorable Reimbursement & Replacement Cycles
Medicare’s doubling of coronary CT angiography rates to USD 357.13 applies an immediate margin uplift for cardiac imaging providers. Concurrently, non-compliant equipment now incurs 15% reimbursement penalties under the NEMA XR-29 smart-dose rule, compressing replacement timelines. Combined, these policies accelerate capital refresh across U.S. hospitals, lifting order volumes throughout the forecast horizon.
Restraints Impact Analysis*
| RESTRAINT | (~) % IMPACT ON CAGR | GEOGRAPHIC RELEVANCE | IMPACT TIMELINE |
|---|---|---|---|
| High capital & service costs | -1.1% | Particularly affecting smaller facilities and rural areas | Medium term (2–4 years) |
| Radiation-dose safety concerns | -0.6% | US & Canada regulatory oversight, Mexico developing standards | Long term (≥ 4 years) |
| Detector-grade chip supply constraints | -0.4% | North America import dependencies, China export controls | Short term (≤ 2 years) |
| Shortage of certified CT technologists | -0.3% | US & Canada workforce challenges, Mexico training gaps | Long term (≥ 4 years) |
| Source: Mordor Intelligence | |||
High Capital & Service Costs
Premium photon-counting CT platforms can cost up to USD 5 million, a hurdle for low-volume centers. Annual service contracts range from 8% to 12% of the the purchase price, compounding budgetary strain. Leasing alleviates upfront outlays but often results in higher total lifecycle spend, reinforcing economic disparities between urban academic hospitals and rural providers.
Radiation-Dose Safety Concerns
Regulators and advocacy groups maintain strict oversight on radiation exposure, particularly for children. The FDA’s Mammography Quality Standards Act framework extends to CT dose monitoring, mandating rigorous compliance protocols. Campaigns such as Image Gently influence clinician ordering behavior, tempering utilization in dose-sensitive applications until next-generation detectors become mainstream.
*Our forecasts treat driver/restraint impacts as directional, not additive. The impact forecasts reflect baseline growth, mix effects, and variable interactions.
Segment Analysis
By Technology: Photon-Counting Drives Premium Tier
High-slice systems (≥128-slice) are projected to grow at a rate of 6.94% from 2026 to 2031, surpassing the overall North American computed tomography (CT) market. This growth is driven by cardiology and oncology teams seeking spectral data and sub-millimeter resolution, capabilities that medium-slice scanners cannot provide. In 2025, medium-slice platforms captured 44.16% of the North American CT market share, as community hospitals and outpatient imaging centers prioritized cost and routine abdomen-pelvis throughput. Low-slice models have found their niche in orthopedic extremity and veterinary applications, where their compact size and pricing under USD 500,000 compensate for their limited coverage.
Photon-counting adoption marks a pivotal shift. In 2025, Siemens dispatched 120 NAEOTOM Alpha units throughout North America. Notably, early adopters bypassed 256-slice upgrades, highlighting benefits like 60% savings on iodine contrast and the removal of beam-hardening artifacts. Vendors lacking photon-counting capabilities face potential exclusion from lucrative high-margin cardiac contracts, especially where ALARA dose metrics are paramount.


By Product Type: Portability Gains in Point-of-Care Settings
In 2025, stationary scanners constituted 85.79% of the North American CT market, capitalizing on a throughput of 20–30 patients per day and established reimbursement pathways. Meanwhile, portable and mobile units are on a growth trajectory, with a projected CAGR of 7.09% through 2031. This surge is driven by the formalization of bedside CT protocols in emergency rooms, ICUs, and rural clinics. For instance, Samsung NeuroLogica’s CereTom, weighing in at 385 pounds, is favored by neuro-critical-care units for its ability to perform non-contrast head CTs without relocating ventilated patients.
Contract radiology firms operate mobile fleets catering to rural hospitals without on-site CT capabilities. Additionally, FEMA has stockpiled portable systems for disaster response scenarios. The continued reimbursement parity under Medicaid waivers bolsters capital investments in states with widely dispersed populations.
By Application: Cardiovascular Imaging Accelerates on Guideline Tailwinds
In 2025, oncology procedures made up 31.18% of the volume, driven by mandates for lung-cancer screenings and the need for monitoring immunotherapy. Cardiovascular CT is poised for a 6.71% growth from 2026 to 2031, spurred by ACC guidelines elevating coronary CT to Class I status for stable chest pain, thus steering patients away from invasive angiography. Neurology stands as the second-largest application, bolstered by stroke protocols that necessitate head CTs within 20 minutes of a patient's arrival at the emergency department. Cone-beam CT is making inroads into musculoskeletal practices, offering extremity imaging at just one-tenth the dose of conventional methods. While demand for pulmonary CT has stabilized post-COVID, it continues to be supported by follow-ups for COPD.
As photon-counting detectors enhance plaque visualization and lessen contrast load, the North American CT market anticipates steady growth in cardiovascular applications. This advancement promises heightened diagnostic accuracy for at-risk yet asymptomatic populations.
By End User: Ambulatory Centers Capture Outpatient Shift
In 2025, hospitals accounted for 55.15% of the installed CT capacity, driven by trauma and tertiary-care needs that necessitate high-slice platforms. However, ambulatory surgical centers are witnessing a robust growth rate of 7.34% from 2026 to 2031. This surge is largely attributed to payer site-of-service edits, which direct elective scans to these more cost-effective venues. Diagnostic imaging centers, already handling a quarter of regional procedures, capitalize on extended operational hours and offer reimbursement rates that are 40–50% lower than those of hospital outpatient departments.
Orthopedic surgery centers are leveraging same-day CTs for pre-operative planning, leading to shorter hospital stays and heightened patient satisfaction. Even in their niche, veterinary clinics are rapidly adopting scanners, driven by a surge in pet-insurance uptake that facilitates advanced diagnostics.
Geography Analysis
Computed Tomography Market in North America
In 2025, the United States accounted for a dominant 92.67% of the region's CT revenue. Projections indicate a robust growth rate of 7.85% through 2031, driven by Medicare Advantage's enrollment surge to 33 million beneficiaries in 2025 and the expanded eligibility for lung-cancer screenings. States such as California, Texas, and Florida, with large senior populations and extensive outpatient imaging networks, contributed a notable 38% to United States installations.
Canada holds a modest 5% share of North America's CT market, with growth constrained by provincial budget cycles. However, pilot programs in Ontario and Quebec aim to centralize e-referrals, potentially reducing wait times from eight weeks to under two, thereby unlocking significant pent-up demand. Meanwhile, Mexico, with a share of less than 3%, is experiencing the fastest growth. Private hospital chains, such as Grupo Angeles, are investing in 64- and 128-slice systems to cater to medical tourists and a growing middle class. The federal health-infrastructure plan for 2025-2030 has allocated USD 1.2 billion for diagnostic equipment, creating tenders that appeal to mid-tier vendors willing to structure peso-denominated financing.
Competitive Landscape
In 2025, GE HealthCare, Siemens Healthineers, Canon Medical Systems, and Philips dominated the North American computed tomography (CT) market, collectively accounting for the majority of the market share. Meanwhile, Chinese firms such as United Imaging, Neusoft, and Shenzhen Anke are disrupting the market by reducing list prices by 30–40%, securing key placements in cost-sensitive community hospitals. In response, established players are countering with bundled offerings, including AI reconstruction, remote-monitoring dashboards, and extended service contracts, effectively binding clients to their proprietary ecosystems.
As an additional strategy, companies are focusing on photon-counting roadmaps. In 2025, Siemens secured 47 CT patents, with 60% concentrating on detector calibration and spectral algorithms. In contrast, GE HealthCare's patents emphasize AI-driven dose optimization and real-time quality control. The market is also witnessing strategic partnerships, such as Canon Medical's December 2025 collaboration with Microsoft Azure, which shifted reconstruction tasks to the cloud. This initiative reduced on-premises computing requirements by 60% and enabled smaller hospitals to access advanced algorithms without the need for expensive GPU clusters.
North America Computed Tomography (CT) Industry Leaders
Canon Medical Systems Corporation
GE Healthcare
Hitachi Healthcare Systems
Koninklijke Philips NV
Siemens Healthineers
- *Disclaimer: Major Players sorted in no particular order

Recent Industry Developments
- February 2026: 4DMedical secured USD 100 million in funding to scale its FDA-cleared CT:VQ software, which converts routine chest CTs into quantitative ventilation-perfusion maps.
- January 2026: Siemens Healthineers signed a five-year USD 280 million contract with HCA Healthcare to deploy 140 NAEOTOM Alpha photon-counting systems across the United States network.
- December 2025: Canon Medical launched cloud-based AI reconstruction on Microsoft Azure for Aquilion Lightning, reducing local computing needs by 60%, with commercial availability in the United States starting January 2026.
- November 2025: GE HealthCare submitted a 510(k) application for Photonova Spectra, its deep-silicon photon-counting CT with embedded AI algorithms.


North America Computed Tomography (CT) Market Report Scope
Computed tomography (CT) is an imaging process that customizes special X-ray equipment to generate a sequence of exhaustive images or scans of areas inside the body. Also called computerized axial tomography (CAT) scanning, it is primarily used for the diagnosis of cancer.
The North American computed tomography (CT) market is segmented by technology, product type, application, end-user, and geography. By technology, the market is segmented into low slice, medium slice, and high slice. By product type, the market is segmented into stationary CT scanners and portable/mobile CT scanners. By application, the market is segmented into oncology, neurology, cardiovascular, musculoskeletal, and other applications. By end-user, the market is segmented into hospitals, diagnostic centers, and other end users. By geography, the market is segmented into the United States, Canada, and Mexico. The report offers market size and forecasts in value (USD) for the above segments.
By Technology
| Low-slice (<16-slice) |
| Medium-slice (32-64-slice) |
| High-slice (>128-slice) |
By Product Type
| Stationary CT Scanners |
| Portable / Mobile CT Scanners |
By Application
| Oncology |
| Neurology |
| Cardiovascular |
| Musculoskeletal |
| Pulmonary / Thoracic |
| Trauma & Emergency |
| Gastrointestinal |
By End User
| Hospitals |
| Diagnostic Imaging Centers |
| Ambulatory Surgical Centers |
| Specialty & Veterinary Clinics |
| Research & Academic Institutes |
Geography
| United States |
| Canada |
| Mexico |
| By Technology | Low-slice (<16-slice) |
| Medium-slice (32-64-slice) | |
| High-slice (>128-slice) | |
| By Product Type | Stationary CT Scanners |
| Portable / Mobile CT Scanners | |
| By Application | Oncology |
| Neurology | |
| Cardiovascular | |
| Musculoskeletal | |
| Pulmonary / Thoracic | |
| Trauma & Emergency | |
| Gastrointestinal | |
| By End User | Hospitals |
| Diagnostic Imaging Centers | |
| Ambulatory Surgical Centers | |
| Specialty & Veterinary Clinics | |
| Research & Academic Institutes | |
| Geography | United States |
| Canada | |
| Mexico |


Key Questions Answered in the Report
How fast is the North America computed tomography (CT) market expected to grow through 2031?
It is projected to expand at a 6.38% CAGR, climbing from USD 3.54 billion in 2026 to USD 4.82 billion by 2031.
Which scanner technology is growing the quickest?
More than 128-slice photon-counting systems are leading, with a 6.94% CAGR driven by cardiac and spectral imaging demand.
Why are ambulatory surgical centers investing in CT scanners?
Payer site-of-service policies reimburse outpatient scans at lower rates, so centers adopt compact CT to capture elective volumes while hospitals focus on complex cases.
What factor most constrains upgrade cycles?
High capital outlays USD 1.5 to 2.5 million per unit and rising service fees limit smaller hospitals replacement budgets.
How will semiconductor shortages affect supply?
Detector chip bottlenecks can extend delivery times to as long as 18 months for high-slice and photon-counting models, delaying some planned installations.
Page last updated on:


