Enterprise Social Software Market Size and Share
Market Overview
| Study Period | 2020 - 2031 |
|---|---|
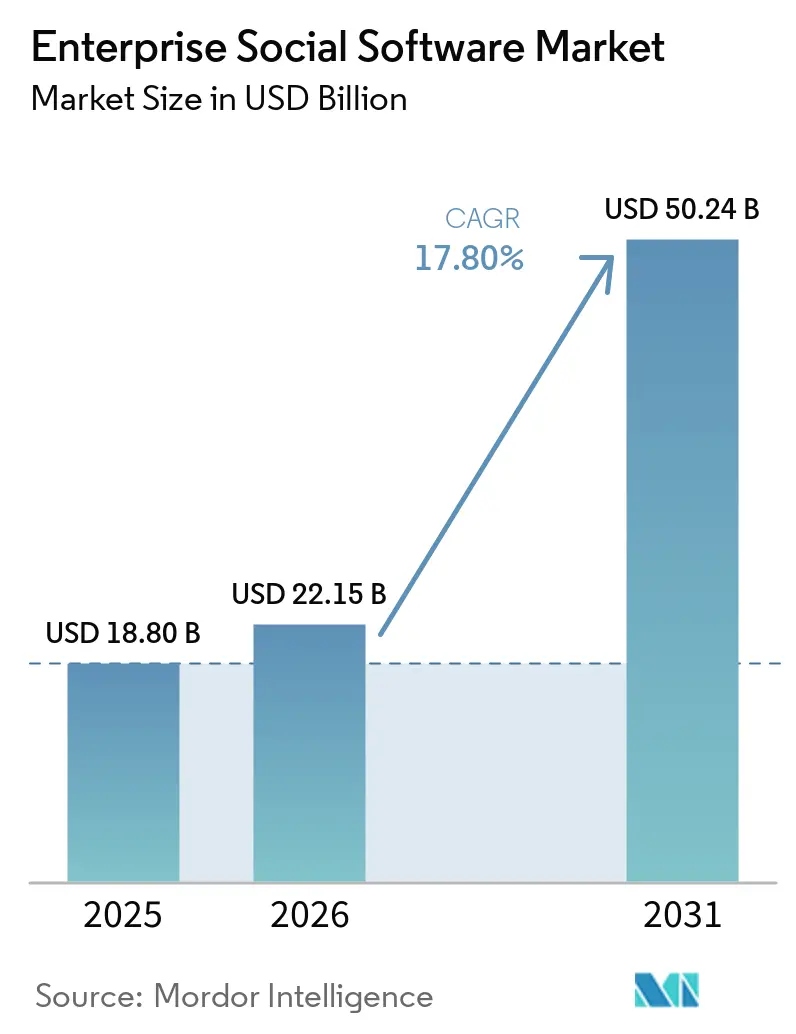
| Market Size (2026) | USD 22.15 Billion |
| Market Size (2031) | USD 50.24 Billion |
| Growth Rate (2026 - 2031) | 17.80% CAGR |
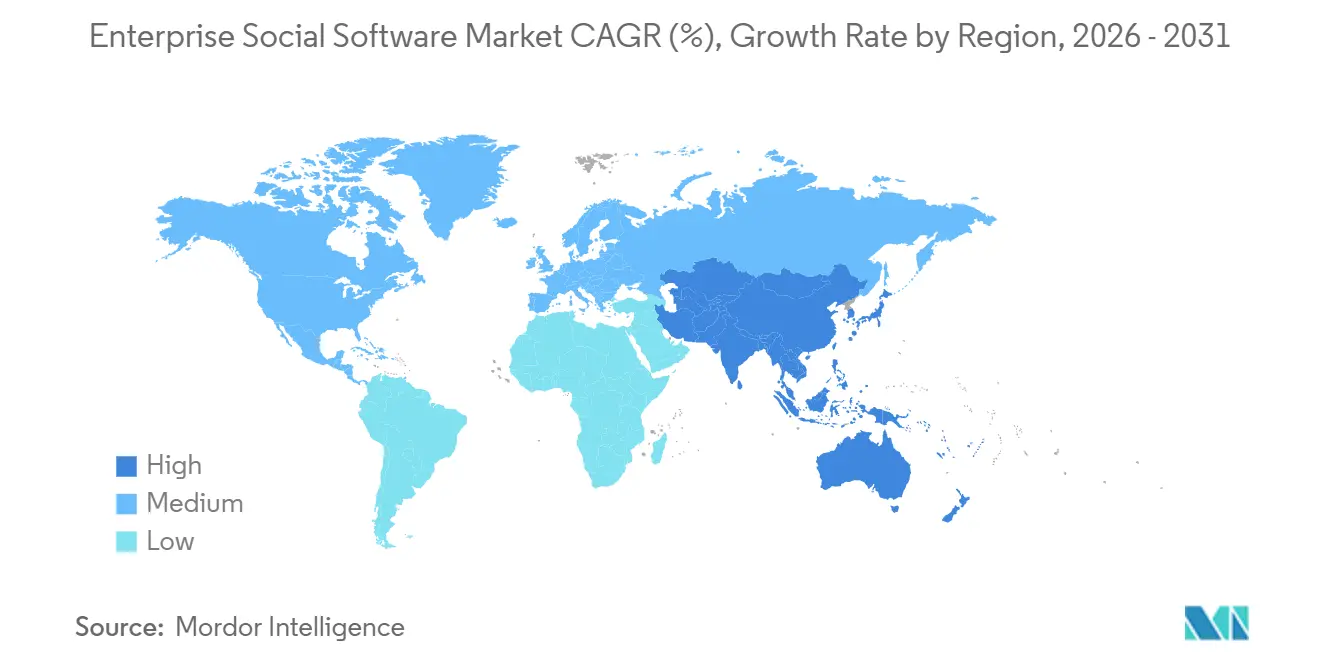
| Fastest Growing Market | Asia Pacific |
| Largest Market | North America |
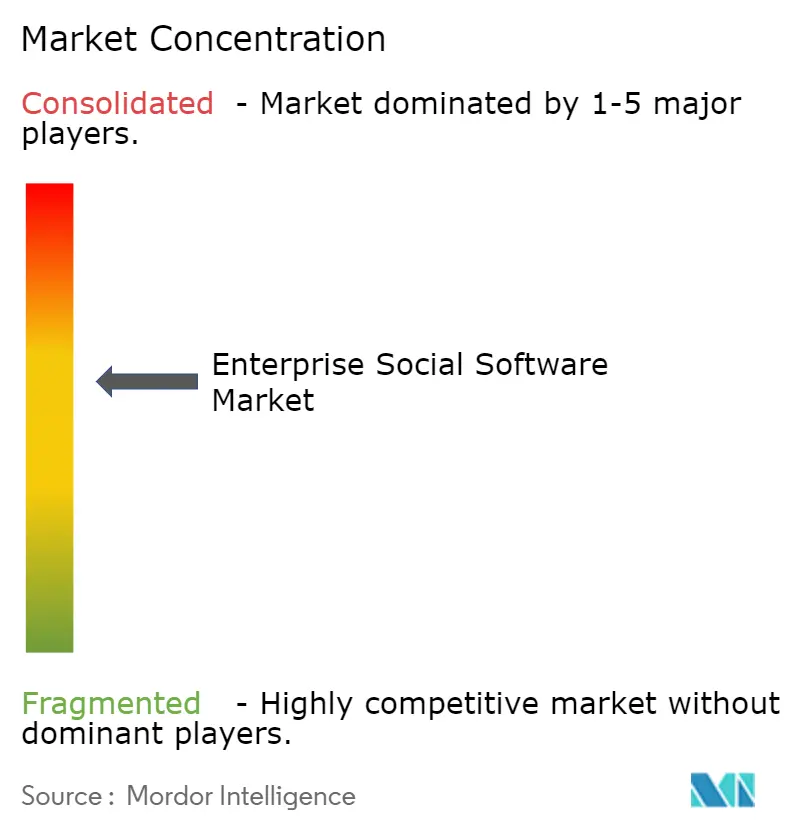
| Market Concentration | Medium |
Major Players *Disclaimer: Major Players sorted in no particular order Image © Mordor Intelligence. Reuse requires attribution under CC BY 4.0. | |
Enterprise Social Software Market Analysis by Mordor Intelligence
The enterprise social software market size is expected to be USD 18.8 billion in 2025, USD 22.15 billion in 2026, and reach USD 50.24 billion by 2031, growing at a CAGR of 17.8% from 2026 to 2031. Permanent hybrid work, rapid gains in generative-AI knowledge discovery, and consolidation around productivity-suite ecosystems are reshaping buying criteria. Enterprise IT teams now look for platforms that compress the 44 annual hours lost per employee to context switching by unifying chat, content, and workflow into an AI-curated environment.[1]Atlassian, “Rovo, AI-Powered Teamwork,” atlassian.com Mobile-first delivery is the new baseline because a majority of the global workforce operates away from desks, while data-sovereignty mandates are pushing vendors to launch regional cloud instances that satisfy cross-border compliance without fragmenting user experience. Competitive intensity is rising as hyperscalers bundle AI into base licenses, forcing standalone vendors to differentiate through vertical templates and compliance tooling.
Key Report Takeaways
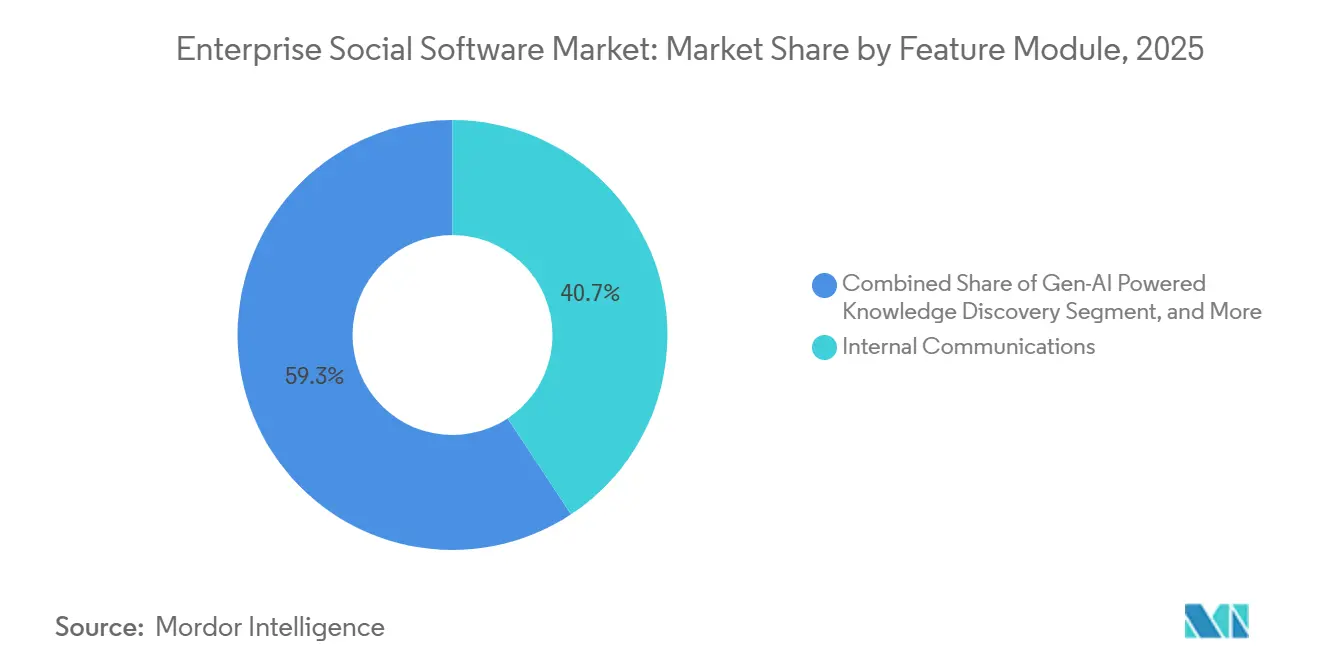
- By feature module, internal communications led with 40.70% revenue share of the enterprise social software market in 2025, while generative-AI knowledge discovery is projected to expand at a 21.20% CAGR through 2031.
- By organization size, large enterprises held 56.60% of the enterprise social software market share in 2025, whereas small and medium enterprises are advancing at an 18.60% CAGR to 2031.
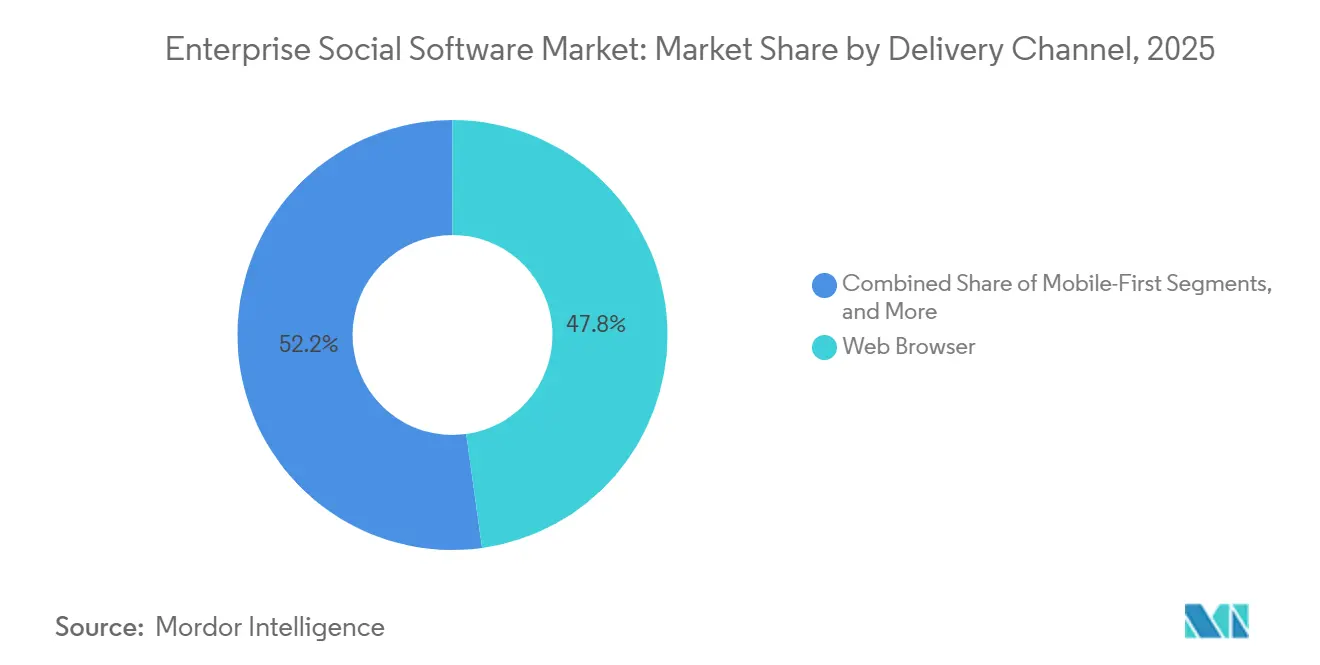
- By delivery channel, web browsers accounted for a 47.80% share of the enterprise social software market size in 2025, and mobile-first deployment is growing at a 19.60% CAGR over the forecast period.
- By geography, North America commanded 37.70% revenue share of the enterprise social software market in 2025, while Asia-Pacific is the fastest expanding region at an 18.70% CAGR through 2031.
- By industry vertical, IT and telecom represented 21.90% of the enterprise social software market in 2025 spending, yet healthcare is forecast to grow at a 19.20% CAGR to 2031.
Note: Market size and forecast figures in this report are generated using Mordor Intelligence’s proprietary estimation framework, updated with the latest available data and insights as of January 2026.
Global Enterprise Social Software Market Trends and Insights
Drivers Impact Analysis*
| Driver | (~) % Impact on CAGR Forecast | Geographic Relevance | Impact Timeline |
|---|---|---|---|
| Permanent Hybrid-Work Culture | +4.2% | Global, concentrated in North America and Europe | Medium term (2-4 years) |
| Rising SaaS Adoption for Lower TCO | +3.8% | Global, early North America, accelerating in Asia-Pacific | Long term (≥ 4 years) |
| Productivity-Suite Integrations | +3.5% | Global, led by Microsoft and Google ecosystems | Short term (≤ 2 years) |
| ESG-Linked Employee-Engagement Needs | +2.9% | Core in Europe and North America, emerging in Asia-Pacific | Medium term (2-4 years) |
| Gen-AI Powered Knowledge Discovery | +2.6% | North America and Asia-Pacific early adopters | Short term (≤ 2 years) |
| Verticalised Intranet Templates | +1.8% | Global, traction in BFSI, healthcare, manufacturing | Medium term (2-4 years) |
| Source: Mordor Intelligence | |||
Permanent Hybrid-Work Culture
Hybrid arrangements have become the default operating model, with three out of four enterprises retaining formal split-location policies. This permanence has exposed the limits of email and meeting-centric collaboration, prompting a 91% increase in asynchronous tool budgets between 2024 and 2025. Knowledge-intensive sectors such as IT and telecom accelerated adoption because incident response and code reviews demand persistent, searchable discussion threads. Microsoft’s 2026 decision to surface Viva Engage communities directly inside Teams highlights the vendor's recognition that context switching suppresses engagement.[2]Microsoft, “Viva Engage Feature Updates,” techcommunity.microsoft.com Organizations that fail to converge chat, content, and tasks into a single AI-powered hub risk locking 60% of employee time into “work about work,” which is why platform consolidation is expected to intensify through 2031.
Rising SaaS Adoption for Lower TCO
Cloud migration originally promised capital-expense relief, yet premium pricing for AI add-ons is inflating operating budgets. Salesforce and Microsoft now charge USD 30-USD 60 per user each month for generative functionality, pushing finance teams to reassess lifetime subscription costs. Vendors such as Zoho are winning cost-sensitive customers by embedding AI in base tiers, delivering predictable pricing that appeals to small businesses. Asia-Pacific enterprises, many of which never owned on-premises stacks, are leapfrogging directly to SaaS and favoring mobile-first suites that mirror consumer experiences. Even so, usage-based billing tied to token consumption is introducing forecast volatility that controllers must model into 2027 and 2028 budgets.
Productivity-Suite Integrations
Enterprises are standardizing on Microsoft 365, Google Workspace, and Salesforce clouds to eliminate middleware overhead. Atlassian’s April 2026 alignment with Google Cloud’s Gemini models illustrates the strategic need for even category leaders to ride hyperscaler AI infrastructure rather than sustain isolated stacks. Meta’s choice to sunset Workplace and migrate users to Workvivo by Zoom demonstrates the difficulty of competing without a native productivity bundle and certified compliance posture.[3]Meta Platforms, “Workplace Transition Timeline,” about.fb.com The integration agenda now extends to ERP and CRM platforms as SAP and Oracle embed social layers directly into transactional workflows, further marginalizing point solutions that cannot offer seamless identity, security, and search.
ESG-Linked Employee-Engagement Needs
Regulators and investors are elevating social metrics from HR nicety to board-level requirement. Workday’s acquisition of Achievers, followed by integrations with Activy, GoJoe, and Benevity, signals the pivot toward gathering auditable data on recognition, inclusion, and wellness.[4]Workday, “Workday Completes Acquisition of Achievers,” workday.com European and North American boards now expect quarterly dashboards on sentiment and voluntary turnover by demographic cohort, driving demand for pre-configured ESG templates that plug directly into sustainability accounting software. Vendors able to automate evidence gathering for SEC rulemaking and EU taxonomy reporting are commanding premium license fees because manual aggregation cannot scale to meet 2027 disclosure deadlines.
Restraints Impact Analysis*
| Restraint | (~) % Impact on CAGR Forecast | Geographic Relevance | Impact Timeline |
|---|---|---|---|
| Data-Sovereignty and Privacy Risks | -2.4% | Europe, China, emerging in India and Brazil | Short term (≤ 2 years) |
| Cultural Resistance to Open Sharing | -1.9% | Global, acute in hierarchical organizations in Asia-Pacific, MEA | Long term (≥ 4 years) |
| Collaboration-Tool Fatigue | -1.6% | Global, especially North America and Europe | Medium term (2-4 years) |
| LLM-Integration Lock-In Concerns | -1.3% | North America and Europe early adopters | Medium term (2-4 years) |
| Source: Mordor Intelligence | |||
Data-Sovereignty and Privacy Risks
GDPR and similar statutes mandate strict residency rules that complicate global roll-outs. A growing share of European enterprises invest in sovereign-cloud zones to avoid cross-border transfer triggers, which raises hosting costs and lengthens procurement cycles. Multinationals must segment user traffic by jurisdiction, adding architectural complexity that can slow adoption. Platform vendors address the issue with in-region data centres and granular encryption keys, yet some buyers still delay purchases until compliance evidence matures. These dynamics temper the growth curve of the enterprise social software market in privacy-sensitive sectors.
Cultural Resistance to Open Sharing
In hierarchical cultures, public posting can be perceived as bypassing managerial approval, dampening platform engagement. Japanese and South Korean enterprises report noticeably lower comment and reaction rates than North American peers, highlighting cultural friction intrinsic to transparent knowledge exchange. Government and defense organizations add classification barriers, while manufacturing shift workers often view social feeds as office-centric. Vendors are mitigating the challenge through role-based visibility and approval workflows, yet entrenched norms mean adoption hurdles will persist in traditional industries well into the next decade.
*Our forecasts treat driver/restraint impacts as directional, not additive. The impact forecasts reflect baseline growth, mix effects, and variable interactions.
Segment Analysis
By Feature Module: Generative AI Reorients Knowledge Flows
Generative AI in knowledge discovery is experiencing significant growth, with a compound annual growth rate (CAGR) of 21.20%. This growth rate surpasses that of the broader enterprise social software market, highlighting its increasing importance. By 2025, internal communications are projected to account for 40.70% of the enterprise social software market share. However, its dominance is expected to decline as organizations shift their budgets toward advanced modules. These modules focus on automatically surfacing expertise and summarizing extensive document repositories, addressing the growing need for efficiency in knowledge management. The shift reflects a broader trend of enterprises prioritizing tools that enhance productivity and streamline access to critical information.
Unstructured institutional memory currently leads to an average of 1.8 hours of daily search time per employee, creating inefficiencies. Enterprises are actively investing in solutions to transform this lost time into actionable insights, driving productivity. Recognition and wellness modules are gaining traction due to their alignment with environmental, social, and governance (ESG) priorities. Meanwhile, ideation hubs remain predominantly utilized in research and development (R&D)-intensive sectors. Additionally, project collaboration and file-sharing functionalities are increasingly integrated into productivity suites, compelling standalone vendors to differentiate themselves. These vendors are focusing on vertical-specific workflows or enhancing AI explainability to remain competitive in a rapidly evolving market landscape.


By Organization Size: SMEs Close the Functionality Gap
Large enterprises commanded 56.60% of the 2025 revenue pool, yet SMEs are advancing at an 18.60% CAGR, narrowing the usage divide. The enterprise social software market size for SME deployments is projected to accelerate as smaller firms bypass on-premises legacies and adopt cloud suites with mobile administration. This trend highlights the growing preference among SMEs for modern, flexible solutions that align with their operational agility. The shift is primarily driven by the need for cost-effective and scalable technologies that can adapt to the dynamic and evolving requirements of smaller businesses. Additionally, the increasing availability of cloud-based tools with enhanced features is further encouraging SMEs to transition away from traditional systems. This evolution is expected to significantly impact the competitive landscape of the enterprise social software market.
SMEs are increasingly drawn to predictable per-user fees and simplified onboarding processes, which reduce implementation complexities. These pricing models and streamlined processes enable smaller businesses to adopt enterprise social software without the burden of high upfront costs or technical challenges. Vendors like Zoho and MangoApps are addressing these specific needs by offering packaged industry templates tailored for SMEs, ensuring faster deployment and usability. Meanwhile, large organizations negotiate enterprise agreements that bundle AI, security, and analytics, leveraging hyperscaler ecosystems for their comprehensive offerings. This dual approach by vendors reflects the diverse needs of SMEs and large enterprises. Atlassian’s modular pricing strategy exemplifies this adaptability, allowing businesses to scale from small team deployments to global rollouts seamlessly, without requiring platform migration.
By Delivery Channel: Mobile-First Unlocks Frontline Engagement
Web browsers accounted for 47.80% of the enterprise social software market share in 2025. However, mobile-first channels are expected to grow at a 19.60% CAGR through 2031, driven by the increasing adoption of digital workplaces among industries such as retail, manufacturing, and healthcare. These sectors are leveraging mobile platforms to enhance communication and collaboration for shift workers. The enterprise social software market size for mobile deployments is anticipated to expand significantly, as smartphone-native interfaces often achieve adoption rates exceeding 70% within days of implementation. This rapid adoption highlights the growing preference for mobile solutions in dynamic work environments.
Vendors are focusing on features like offline caching, push notifications, and simplified user experiences to address the challenges of intermittent connectivity in environments such as shop floors and warehouses. While desktop clients remain essential for power users requiring multi-monitor setups, they are no longer the primary focus of product development. Instead, companies like Microsoft, Salesforce, and Atlassian are investing heavily in progressive web apps to ensure feature parity across devices. This shift underscores the industry's commitment to providing seamless functionality across both mobile and desktop platforms.
By Industry Vertical: Compliance Elevates Healthcare Demand
IT and telecom accounted for 21.90% of spending in 2025, driven by their early adoption of cloud-based solutions. These sectors have leveraged enterprise social software to enhance collaboration, streamline workflows, and improve operational efficiency. Meanwhile, healthcare is projected to grow at a 19.20% CAGR, making it the fastest-growing vertical. The demand for HIPAA-compliant messaging and secure knowledge exchange is fueling this growth, as healthcare providers aim to improve clinical outcomes. Vendors are responding by incorporating features such as audit trails and protected-data redaction into their offerings, further expanding the market size within the healthcare sector.
Other industries are also adopting enterprise social software to address specific needs. BFSI buyers prioritize ISO 27001 and SOC 2-compliant workflows to ensure data security and regulatory compliance. The retail sector focuses on frontline training and employee engagement, while manufacturing utilizes social software for safety protocols and continuous improvement initiatives. Government adoption remains slower due to lengthy procurement cycles. However, cloud-first policies in countries like the United States, the United Kingdom, and Australia are accelerating the adoption of certified platforms, gradually increasing the sector's contribution to the market.
Geography Analysis
North America held 37.70% of 2025 revenue and remains the reference market for AI-infused collaboration. U.S. enterprises are leading global pilots of knowledge-synthesis agents, which are designed to enhance productivity and streamline workflows. Vendor consolidation has intensified following Meta's exit from Workplace, highlighting the growing importance of integrated productivity clouds. Additionally, regulatory pressures to disclose employee-engagement metrics under ESG frameworks are driving platform renewals. The region's strong technological infrastructure and early adoption of advanced solutions further solidify its position as a critical hub for innovation and adoption in the enterprise social software market.
Asia-Pacific is the fastest-growing region, with an 18.70% CAGR, as digital workplace maturity reached 66.35% in 2025. Key markets such as India, Japan, and Australia are anchoring investments in enterprise social software, while China's localization rules are fostering separate domestic deployments, favoring Tencent and Alibaba infrastructure. SMEs across the region are rapidly adopting cloud suites, significantly contributing to user-count growth, even though the average revenue per user remains lower compared to North American benchmarks. The region's growth is further supported by increasing digital transformation initiatives, government policies promoting cloud adoption, and the rising demand for scalable and cost-effective solutions among smaller businesses.
Europe faces slower uptake due to GDPR complexities and macroeconomic uncertainties, yet it remains a strategic market for enterprise social software. Data-sovereignty capabilities proven in Europe are becoming baseline expectations in other regions, making it a testing ground for compliance-driven innovations. Germany, the United Kingdom, and France are focusing on ESG-linked engagement metrics, which are influencing platform development and adoption. Meanwhile, South America and the Middle East and Africa present mobile-led greenfield opportunities. However, these regions face challenges such as currency volatility, limited infrastructure, and slower digital transformation, which could temper growth despite their potential for market expansion.

Competitive Landscape
The market is moderately fragmented. Microsoft, Google, Salesforce, and Atlassian leverage ecosystem lock-in by integrating social, content, and AI features into their productivity suites, ensuring customer retention. Niche players such as LumApps, Simpplr, Staffbase, and Happeo secure verticalized deals by offering industry-specific templates and user-friendly interfaces tailored for frontline workers. Atlassian’s April 2026 Gemini integration highlights the necessity for even market leaders to align with hyperscalers for language model capabilities, rather than developing standalone AI stacks. This trend underscores the growing importance of partnerships in maintaining competitive advantages. The market’s fragmentation allows smaller players to carve out niches while larger firms focus on comprehensive ecosystem strategies.
Meta’s decision to retire Workplace by June 2026 reinforces the importance of compliance-first and AI-native designs for achieving success in the enterprise social software market. This move highlights the growing demand for platforms that prioritize audit trails, role-based access, and data residency, particularly in sectors like healthcare, manufacturing, and government. These industries value compliance and security over generic feature depth, creating opportunities for vendors that can meet these specific needs. Additionally, vendors capable of demonstrating tangible benefits, such as reduced search times and faster onboarding processes, are more likely to secure budgets in a cost-conscious 2026 planning environment. The shift toward compliance-driven innovation is reshaping the competitive landscape.
Generative AI has emerged as the new competitive frontier, with platforms racing to deliver features such as auto-drafting content, surfacing expertise, and recommending next actions. Vendors that fail to provide measurable productivity improvements risk being relegated to discretionary HR spending categories, limiting their market relevance. Conversely, platforms that can demonstrate a clear return on investment (ROI) through analytics tied to core business key performance indicators (KPIs) are likely to dominate the market. This focus on hard ROI is driving innovation and adoption, as enterprises increasingly prioritize solutions that directly impact their operational efficiency. The ability to link AI capabilities to business outcomes will define market leaders in the coming years.
Enterprise Social Software Industry Leaders
Microsoft Corporation
Salesforce, Inc.
Google LLC
Meta Platforms, Inc.
Atlassian Corporation
- *Disclaimer: Major Players sorted in no particular order

Recent Industry Developments
- April 2026: Atlassian partnered with Google Cloud to embed Gemini language models into Rovo and Confluence, giving customers a choice of AI provider while retaining a unified workspace.
- April 2026: Microsoft enhanced Viva Engage with featured conversations, sensitivity labels, and mobile management to enforce data-loss prevention directly inside collaboration workflows.
- April 2026: Kraft Heinz rolled out Walt Smart Radio, a mobile communication app for factory employees, replacing email and bulletin boards with real-time alerts.
- February 2026: Atlassian introduced Rovo at Work, adding AI agents that automate knowledge synthesis and task routing in Confluence and Jira.


Global Enterprise Social Software Market Report Scope
The Enterprise Social Software Market refers to platforms and tools that enable communication, collaboration, and knowledge sharing within organizations through social networking features. These solutions include functionalities such as messaging, discussion forums, content sharing, employee communities, and activity feeds to enhance workplace engagement and productivity. They are widely used to support internal collaboration, remote work, and cross-functional teamwork across enterprises.
The Enterprise Social Software Market is Segmented by Feature Module (Internal Communications, Knowledge Management, Employee Recognition, Ideation Hubs, Others), Organization Size (SMEs, Large Enterprises), Delivery Channel (Mobile-First, Web, Desktop), Industry Vertical (BFSI, Healthcare, IT and Telecom, Retail, Government, Manufacturing, Others), and Geography. Market Forecasts are Provided in Value (USD).
| Internal Communications |
| Knowledge Management |
| Employee Recognition and Wellness |
| Ideation Innovation Hubs |
| Others Feature Module |
| Small and Medium Enterprises SMEs |
| Large Enterprises |
| Mobile First |
| Web Browser |
| Desktop Client |
| BFSI |
| Healthcare |
| IT and Telecom |
| Retail and eCommerce |
| Government and Public Sector |
| Manufacturing |
| Other Industry Verticals |
| North America | United States | |
| Canada | ||
| Mexico | ||
| Europe | Germany | |
| United Kingdom | ||
| France | ||
| Italy | ||
| Spain | ||
| Rest of Europe | ||
| Asia Pacific | China | |
| Japan | ||
| India | ||
| South Korea | ||
| Australia | ||
| Rest of Asia Pacific | ||
| South America | Brazil | |
| Argentina | ||
| Rest of South America | ||
| Middle East and Africa | Middle East | Saudi Arabia |
| United Arab Emirates | ||
| Rest of Middle East | ||
| Africa | South Africa | |
| Egypt | ||
| Rest of Africa | ||
| By Feature Module | Internal Communications | ||
| Knowledge Management | |||
| Employee Recognition and Wellness | |||
| Ideation Innovation Hubs | |||
| Others Feature Module | |||
| By Organization Size | Small and Medium Enterprises SMEs | ||
| Large Enterprises | |||
| By Delivery Channel | Mobile First | ||
| Web Browser | |||
| Desktop Client | |||
| By Industry Vertical | BFSI | ||
| Healthcare | |||
| IT and Telecom | |||
| Retail and eCommerce | |||
| Government and Public Sector | |||
| Manufacturing | |||
| Other Industry Verticals | |||
| By Geography | North America | United States | |
| Canada | |||
| Mexico | |||
| Europe | Germany | ||
| United Kingdom | |||
| France | |||
| Italy | |||
| Spain | |||
| Rest of Europe | |||
| Asia Pacific | China | ||
| Japan | |||
| India | |||
| South Korea | |||
| Australia | |||
| Rest of Asia Pacific | |||
| South America | Brazil | ||
| Argentina | |||
| Rest of South America | |||
| Middle East and Africa | Middle East | Saudi Arabia | |
| United Arab Emirates | |||
| Rest of Middle East | |||
| Africa | South Africa | ||
| Egypt | |||
| Rest of Africa | |||


Key Questions Answered in the Report
How large will the enterprise social software market be by 2031?
The market will reach USD 50.24 billion by 2031, rising from USD 56.85 billion in 2026.
How fast is the enterprise social software market projected to grow?
The enterprise social software market size is forecast to expand from USD 22.15 billion in 2026 to USD 50.24 billion by 2031, registering a 17.8% CAGR (MORDOR INTELLIGENCE).
Which region will add the most incremental revenue through 2031?
Asia-Pacific is set to grow at an 18.70% CAGR, the highest globally, driven by cloud-native deployments in India, Japan, and Australia (MORDOR INTELLIGENCE).
Why are small and medium enterprises adopting these platforms rapidly?
SMEs value predictable SaaS pricing and reduced context switching, leading to an 18.60% CAGR that outpaces large-enterprise growth (MORDOR INTELLIGENCE).
What is driving healthcare organizations to invest in enterprise social software?
HIPAA-compliant collaboration that improves clinical knowledge sharing is pushing healthcare spending to a 19.20% CAGR, the fastest among verticals (MORDOR INTELLIGENCE).
How are data-sovereignty regulations affecting vendor strategy?
Requirements like GDPR and China's localization rules are forcing providers to launch regional cloud instances, increasing deployment complexity and cost (MORDOR INTELLIGENCE).
Which feature module is gaining traction the quickest?
Generative-AI knowledge discovery leads all feature modules with a projected 21.20% CAGR through 2031, as firms shift budgets toward tools that surface institutional knowledge (MORDOR INTELLIGENCE).
Page last updated on:


