Enterprise Architecture Tools Market Size and Share
Market Overview
| Study Period | 2019 - 2030 |
|---|---|
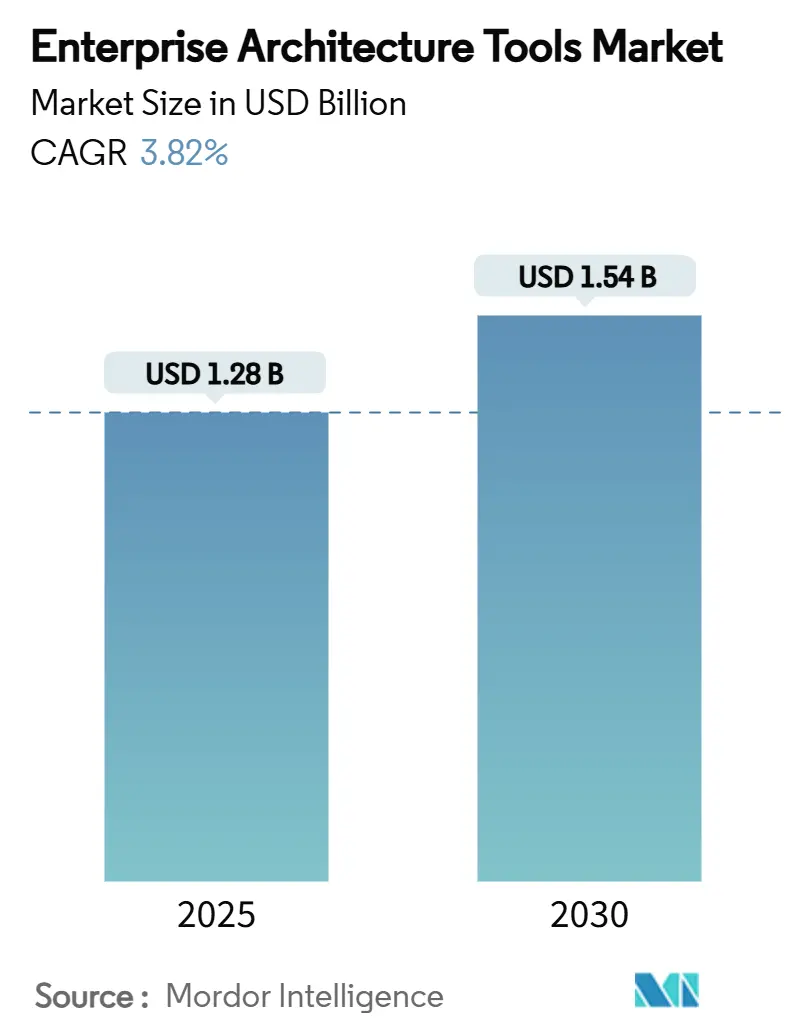
| Market Size (2025) | USD 1.28 Billion |
| Market Size (2030) | USD 1.54 Billion |
| Growth Rate (2025 - 2030) | 3.82% CAGR |
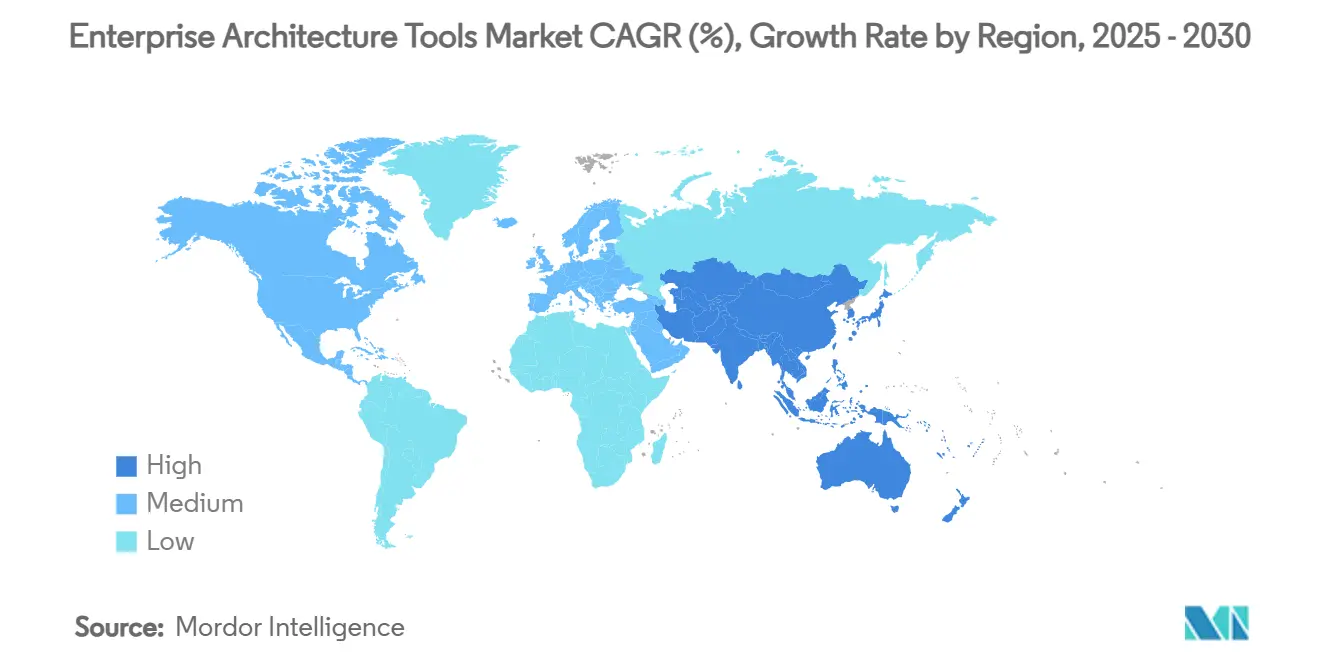
| Fastest Growing Market | Asia Pacific |
| Largest Market | North America |
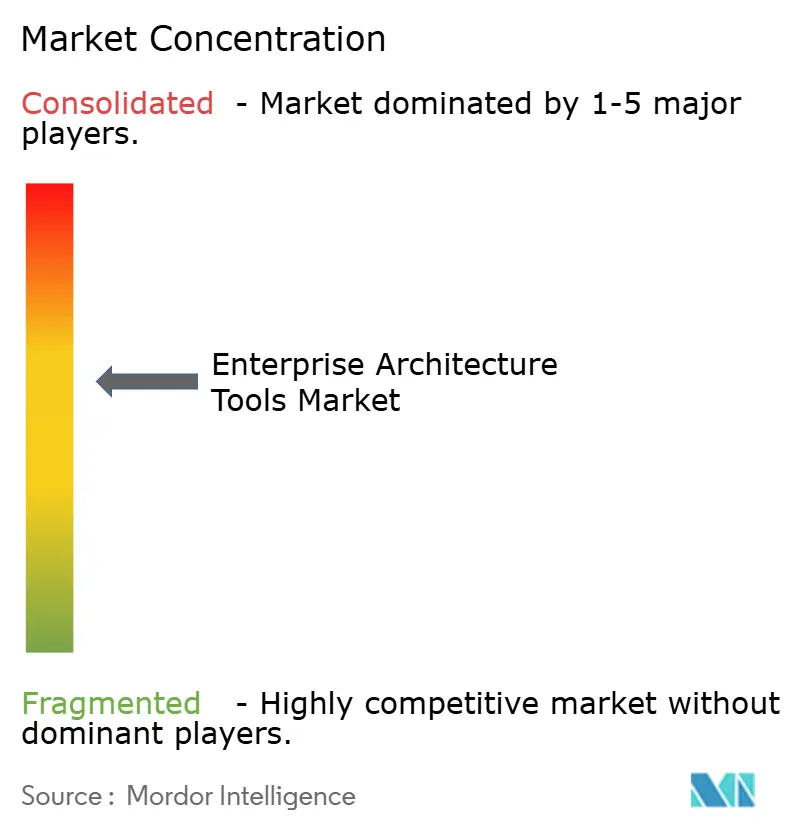
| Market Concentration | Medium |
Major Players *Disclaimer: Major Players sorted in no particular order Image © Mordor Intelligence. Reuse requires attribution under CC BY 4.0. | |
Enterprise Architecture Tools Market Analysis by Mordor Intelligence
The enterprise architecture tools market size stands at USD 1.28 billion in 2025 and is forecast to reach USD 1.54 billion by 2030 at a 3.82% CAGR. Demand remains steady because CIOs view architecture visibility as a prerequisite for hybrid-cloud governance, AI adoption, and regulatory compliance. Consolidation among software vendors, expanding service portfolios, and rising cloud budgets allow suppliers to deepen wallet share instead of chasing rapid volume growth. Hybrid deployment, services-led implementation, and Asia-Pacific expansion supply the largest incremental revenue pools, whereas on-premise tools, perpetual licenses, and single-vendor stacks record only marginal gains. Mergers such as Bizzdesign–MEGA–Alfabet and IBM’s purchase of Software AG’s integration assets signal a pivot toward platform breadth and embedded AI assistants that remedy skills shortages, tame IT sprawl, and prove financial returns.[1]MEGA International, “MEGA's merger with two industry leaders,” mega.com
Key Report Takeaways
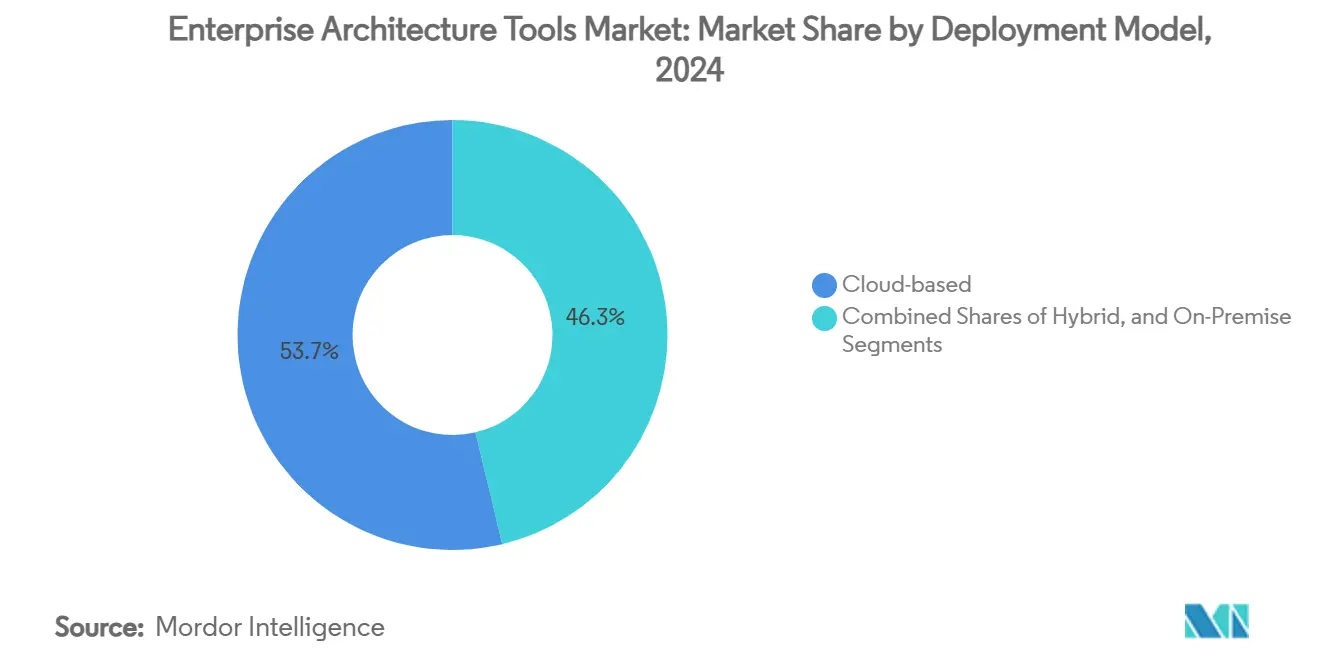
- By deployment model, cloud-based platforms led with 53.71% revenue share in 2024; hybrid deployment is advancing at a 6.23% CAGR to 2030.
- By component, software platforms accounted for 61.05% of the enterprise architecture tools market size in 2024, while services are set to expand at 8.23% CAGR through 2030.
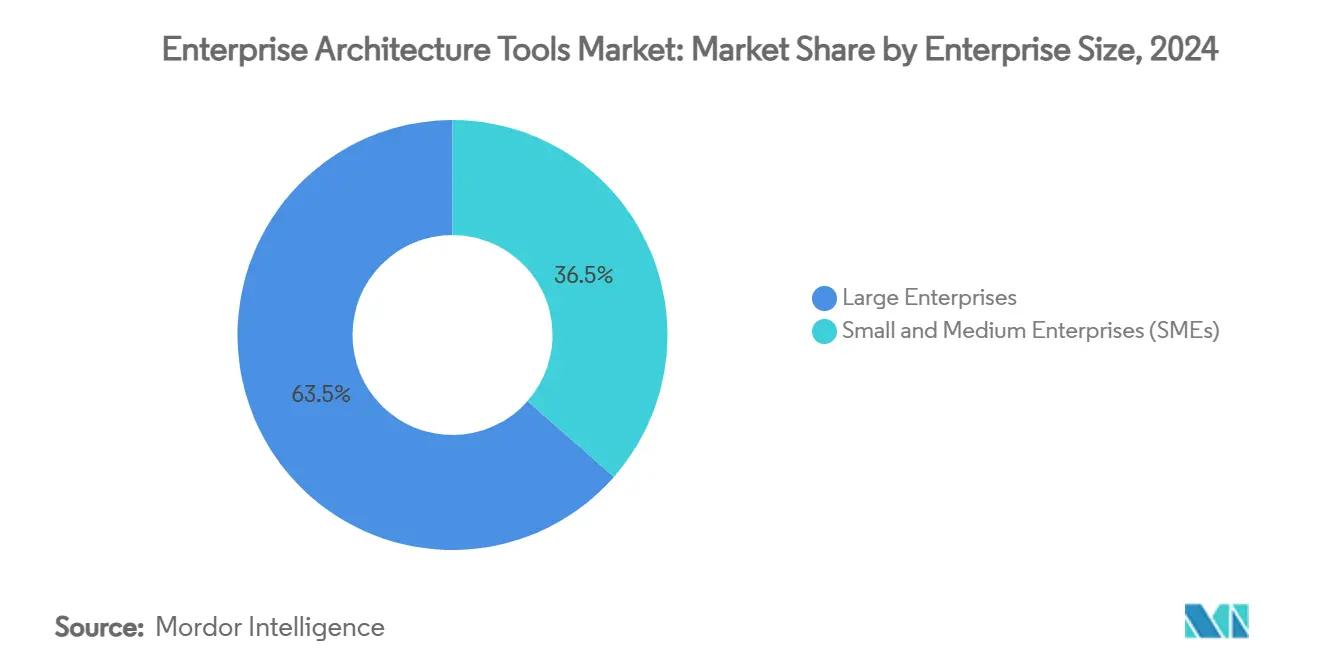
- By enterprise size, large enterprises held 63.52% share of the enterprise architecture tools market size in 2024 and small and medium enterprises are projected to grow at 9.48% CAGR to 2030.
- By end-user industry, IT and telecom captured 28.69% of the enterprise architecture tools market share in 2024; healthcare represents the fastest-growing industry at a 7.02% CAGR through 2030.
- By geography, North America dominated with 36.84% revenue share in 2024, whereas Asia-Pacific is forecast to progress at a 6.87% CAGR to 2030.
Global Enterprise Architecture Tools Market Trends and Insights
Drivers Impact Analysis*
| Driver | (~) % Impact on CAGR Forecast | Geographic Relevance | Impact Timeline |
|---|---|---|---|
| Escalating digital-transformation budgets | +1.2% | Global, with North America & Europe leading | Medium term (2-4 years) |
| Growing complexity of hybrid and multi-cloud IT estates | +0.9% | Global, concentrated in North America & APAC | Long term (≥ 4 years) |
| Heightened regulatory-compliance and risk-management requirements | +0.7% | Europe & North America, expanding to APAC | Medium term (2-4 years) |
| Composable-business blueprints accelerating modular SaaS adoption | +0.5% | Global, early adoption in North America | Long term (≥ 4 years) |
| AI-driven EA assistants countering enterprise-architect talent gaps | +0.4% | North America & Europe, emerging in APAC | Short term (≤ 2 years) |
| Value-stream-management integration for continuous product delivery | +0.3% | North America & Europe, selective APAC markets | Medium term (2-4 years) |
| Source: Mordor Intelligence | |||
Escalating Digital-Transformation Budgets
Global IT spending topping USD 4.5 trillion elevates architecture governance from compliance formality to investment-optimization engine. Average corporate IT budgets of USD 33 million are now benchmarked against measurable value streams, and architecture platforms supply the evidence. Healthcare CIOs that tie roadmaps to enterprise architecture report faster project approvals and lower rework. Demonstrated savings at manufacturers such as STIHL reinforce the case for board-level funding, converting one-time tool purchases into multi-year modernization programs.[2]Ardoq, “STIHL's IT Team Prove the ROI of Adopting Enterprise Architecture,” ardoq.com
Growing Complexity of Hybrid and Multi-Cloud IT Estates
Eighty-four percent of enterprises already juggle at least two hyperscalers, and 57% orchestrate workloads across containers and on-premise clusters. Siloed observability, fragmented identity control, and latent cost leaks prompt enterprises to license architecture platforms that inventory applications, map dependencies, and surface rationalization targets. Hybrid complexity thus sustains long-run demand for configuration baselines, lineage diagrams, and policy engines that outpace manual spreadsheets.
Heightened Regulatory-Compliance and Risk-Management Requirements
GDPR, sectoral privacy laws, and the forthcoming EU AI Act oblige boards to catalog data flows, model risk, and document controls. Architecture repositories expedite proof-of-compliance by linking business capabilities to underlying tech assets. Banks and insurers deploy metadata-rich blueprints to withstand audit cycles; utilities overlay sustainability metrics such as carbon intensity on application portfolios, keeping tools relevant whenever statutes tighten.
Composable-Business Blueprints Accelerating Modular SaaS Adoption
CXOs swap monolith suites for API-driven micro-products that plug into evolving value chains. Architecture platforms act as orchestration console, broker data lineage, and choreograph sandbox exploration. Digital Twins of Organization fuse operational telemetry with repository metadata, allowing scenario simulations before code is touched. This agility premium cements licensing renewals and lifts attach rates for integration services.[3]Orbus Software, “5 Key Trends Shaping the Future of Enterprise Architecture and Transformation in 2025,” orbussoftware.com
Restraints Impact Analysis*
| Restraint | (~) % Impact on CAGR Forecast | Geographic Relevance | Impact Timeline |
|---|---|---|---|
| High upfront licensing and set-up costs | -0.8% | Global, particularly impacting SMEs | Short term (≤ 2 years) |
| Shortage of in-house EA skillsets | -0.6% | Global, acute in emerging markets | Medium term (2-4 years) |
| Cultural resistance to transparent architecture repositories | -0.4% | Global, pronounced in traditional industries | Medium term (2-4 years) |
| Data-privacy risks from Gen-AI–enabled EA tooling | -0.3% | Europe & North America, expanding globally | Short term (≤ 2 years) |
| Source: Mordor Intelligence | |||
High Upfront Licensing and Set-Up Costs
Three-year subscription bundles, consulting, and training can total multiples of initial software fees, discouraging mid-market entrants. Vendors adopting consumption-based pricing or low-code onboarding lessen friction, but inflation-driven list increases of up to 24% still dampen near-term uptake for cost-conscious buyers.
Shortage of In-House EA Skillsets
Framework mastery and business fluency remain scarce. Public sector projects stall without certified leads, and multi-cloud migrations exceed staff capacity. Service providers fill the breach yet extend payback periods. Automated pattern libraries and citizen-user canvases partially offset the deficit.
*Our forecasts treat driver/restraint impacts as directional, not additive. The impact forecasts reflect baseline growth, mix effects, and variable interactions.
Segment Analysis
By Deployment Model: Hybrid Architectures Drive Infrastructure Evolution
Hybrid configurations are expanding faster than any other deployment model at a 6.23% CAGR as enterprises calibrate cloud elasticity against on-premise compliance thresholds. Cloud platforms retain leadership with 53.71% revenue share, though hybrid architectures capture incremental spend whenever new workloads straddle sovereign data zones and edge devices. Within the enterprise architecture tools market size, hybrid scenarios already account for sizeable assessment projects; repository connectors, policy engines, and dependency maps enable CFOs to quantify latency trade-offs and location-based cost savings.
Hybrid growth endures because boards demand optionality. Architecture inventories that couple container orchestration with mainframe lineage allow phased modernization without wholesale replacement. As regulatory regimes articulate cloud exit mandates, the hybrid narrative secures perpetual licensing, further reinforcing addressable revenue streams for the enterprise architecture tools market.


By Component: Services Segment Accelerates Through Specialized Expertise Demand
Software platforms commanded 61.05% revenue in 2024, yet services will climb at 8.23% CAGR as enterprises seek architects, trainers, and integration squads to operationalize toolsets. Services revenues expand faster than platform fees because multicloud migration, AI governance, and compliance mapping exceed internal capacity. Consulting engagements increasingly bundle value-stream frameworks, thereby deepening attach rates and extending renewal horizons.
Implementation partners also embed platform-agnostic accelerators that fast-track repository population. This outcomes framing helps justify ongoing managed-service contracts, underpinning predictable annuities inside the enterprise architecture tools market.
By Enterprise Size: SME Adoption Accelerates Despite Implementation Barriers
Large enterprises currently account for 63.52% of spending, yet SMEs show a 9.48% CAGR thanks to SaaS subscriptions, pay-as-you-go analytics, and template libraries that slash time-to-value. Light-weight metamodels combined with wizard-driven onboarding allow finance directors at midsize firms to pilot governance practices without hiring certified architects.
Cost-sensitive buyers still balk at premium pricing, but platform vendors now tier SKUs and embed community-based training to ease adoption. As frameworks scale with business growth, SME licenses often expand into enterprise configurations, nurturing lifetime value for vendors within the enterprise architecture tools market.
By End-User Industry: Healthcare Digital Transformation Drives Sector Growth
IT and telecom led with 28.69% share, yet healthcare is forecast to grow fastest at 7.02% CAGR as hospitals integrate legacy clinical apps with cloud-first digital health modules. Framework-driven blueprints help mitigate patient safety risks when modernizing EHR backbones, and compliance dashboards substantiate HIPAA and GDPR audits.
Manufacturing, BFSI, and government maintain steady uptake as supply-chain resilience, ESG mandates, and open banking APIs all demand enterprise-wide dependency mapping. Scenario modeling for decarbonization, capital planning, and digital-tax compliance keeps the enterprise architecture tools market embedded across regulated verticals.
Geography Analysis
North America generated 36.84% of 2024 revenue, buoyed by some of the world’s largest IT budgets and a mature partner ecosystem that embeds architecture into digital-business charters. Vendors position AI copilots and FinOps integrations as new value levers for Fortune 1000 renewals.
Europe maintains solid share on the strength of GDPR, operational resilience directives, and green-deal reporting that necessitate granular system-of-record transparency. Public-sector digital sovereignty funding further enlarges the enterprise architecture tools market size across EU member states.
Asia-Pacific records the fastest trajectory at 6.87% CAGR through 2030 as 70% of regional enterprises accelerate generative-AI rollout and seek governance guardrails. Rising cloud datacenter footprints in India and Southeast Asia shorten latency, making SaaS-based repositories viable even for security-sensitive industries.
Latin America and Middle East & Africa remain early-stage but show expanding pilot activity tied to telco 5G monetization, banking modernization, and state-owned utility reforms. Cross-border system integrators cultivate these regions with packaged playbooks that transfer lessons from mature markets into localized compliance contexts.

Competitive Landscape
Market concentration is moderate with a cluster of five to seven vendors exceeding USD 50 million each while a long tail supplies niche frameworks. The Bizzdesign–MEGA–Alfabet merger created a EUR 110 million (USD 120 million) platform spanning process modeling, capability mapping, and portfolio analytics, broadening cross-sell potential. IBM spent EUR 2.13 billion (USD 2.34 billion) on Software AG’s integration unit to embed low-code connectivity and data pipeline automation directly into its architecture stack, fortifying hybrid-cloud differentiation.
LeanIX’s AI classification bolsters the architecture role in responsible-AI programs, while its SaaS subscription aligns cost with consumption to entice mid-market accounts. Avolution secured private-equity backing to scale global channel coverage, promising accelerated roadmap releases and verticalized templates. Emerging players such as Ardoq emphasize citizen-designer canvases and real-time collaboration, lowering experiential barriers for business stakeholders.
Strategically, incumbents seek end-to-end transformation suites that blur boundaries among process mining, architecture, and DevOps telemetry. Midsize disruptors counter by prioritizing open APIs and domain-specific content packages for faster time-to-insight. Partnerships with cloud hyperscalers and process-intelligence vendors remain a core go-to-market lever because customers prefer integrated buying centers over stand-alone tools.
Enterprise Architecture Tools Industry Leaders
IBM Corporation
Software AG
MEGA International S.A.
Orbus Software Ltd.
Avolution Pty Ltd
- *Disclaimer: Major Players sorted in no particular order

Recent Industry Developments
- January 2025: Bizzdesign completed the acquisition of Alfabet, forming a unified architecture and portfolio-governance platform. The deal gives Bizzdesign a deeper SaaS footprint and cross-sell path into Alfabet’s installed base while rationalizing overlapping R&D.
- January 2025: Celonis and Ardoq introduced a combined transformation solution that fuses process-mining telemetry with real-time architecture metadata, enabling CIOs to model cause-and-effect relationships and prioritize funding.
- December 2024: Avolution received a strategic growth investment from Whiteoak. New capital targets accelerated AI module development and geographic expansion into Asia-Pacific mid-market segments.
- October 2024: MEGA International’s merger with Bizzdesign and another peer realized operational synergies in R&D and support, while offering customers uninterrupted updates across consolidated platforms.


Global Enterprise Architecture Tools Market Report Scope
| On-premise |
| Cloud-based |
| Hybrid |
| Software Platform | |
| Services | Consulting |
| Training and Support | |
| Integration and Implementation |
| Small and Medium Enterprises (SMEs) |
| Large Enterprises |
| IT and Telecom |
| BFSI |
| Manufacturing |
| Retail and E-commerce |
| Healthcare |
| Government |
| Energy and Utilities |
| Other End-user Industries |
| North America | United States | |
| Canada | ||
| Mexico | ||
| Europe | United Kingdom | |
| Germany | ||
| France | ||
| Italy | ||
| Spain | ||
| Russia | ||
| Rest of Europe | ||
| Asia-Pacific | China | |
| Japan | ||
| South Korea | ||
| India | ||
| Australia | ||
| Singapore | ||
| Rest of Asia-Pacific | ||
| South America | Brazil | |
| Argentina | ||
| Chile | ||
| Rest of South America | ||
| Middle East and Africa | Middle East | Israel |
| Turkey | ||
| Saudi Arabia | ||
| United Arab Emirates | ||
| Qatar | ||
| Rest of Middle East | ||
| Africa | South Africa | |
| Nigeria | ||
| Kenya | ||
| Rest of Africa | ||
| By Deployment Model | On-premise | ||
| Cloud-based | |||
| Hybrid | |||
| By Component | Software Platform | ||
| Services | Consulting | ||
| Training and Support | |||
| Integration and Implementation | |||
| By Enterprise Size | Small and Medium Enterprises (SMEs) | ||
| Large Enterprises | |||
| By End-user Industry | IT and Telecom | ||
| BFSI | |||
| Manufacturing | |||
| Retail and E-commerce | |||
| Healthcare | |||
| Government | |||
| Energy and Utilities | |||
| Other End-user Industries | |||
| By Geography | North America | United States | |
| Canada | |||
| Mexico | |||
| Europe | United Kingdom | ||
| Germany | |||
| France | |||
| Italy | |||
| Spain | |||
| Russia | |||
| Rest of Europe | |||
| Asia-Pacific | China | ||
| Japan | |||
| South Korea | |||
| India | |||
| Australia | |||
| Singapore | |||
| Rest of Asia-Pacific | |||
| South America | Brazil | ||
| Argentina | |||
| Chile | |||
| Rest of South America | |||
| Middle East and Africa | Middle East | Israel | |
| Turkey | |||
| Saudi Arabia | |||
| United Arab Emirates | |||
| Qatar | |||
| Rest of Middle East | |||
| Africa | South Africa | ||
| Nigeria | |||
| Kenya | |||
| Rest of Africa | |||


Key Questions Answered in the Report
Which deployment model is expanding fastest in the enterprise architecture tools market?
Hybrid deployment is growing at a 6.23% CAGR because enterprises balance cloud scalability with on-premise data-sovereignty and latency needs.
Why are services outpacing software platform revenue growth?
Organizations require consulting, training, and integration expertise to operationalize repositories, driving the services segment at 8.23% CAGR.
What drives healthcare adoption of enterprise architecture tooling?
Regulatory mandates and digital health integration push healthcare spending, making it the fastest-growing end-user industry at 7.02% CAGR.
How are AI assistants influencing enterprise architecture governance?
Vendors embed generative AI copilots that automate diagramming and risk scoring, reducing skills-related bottlenecks and accelerating time-to-value.
Which region offers the strongest growth opportunity through 2030?
Asia-Pacific leads with a 6.87% CAGR as regional firms ramp up generative-AI deployment and require governance frameworks.
What strategic rationale underpins recent M&A activity in the sector?
Acquirers seek broader transformation suites and embedded integration layers to deliver end-to-end hybrid-cloud governance and cross-sell opportunities.
Page last updated on:


