Productivity Apps Market Size and Share
Market Overview
| Study Period | 2019 - 2030 |
|---|---|
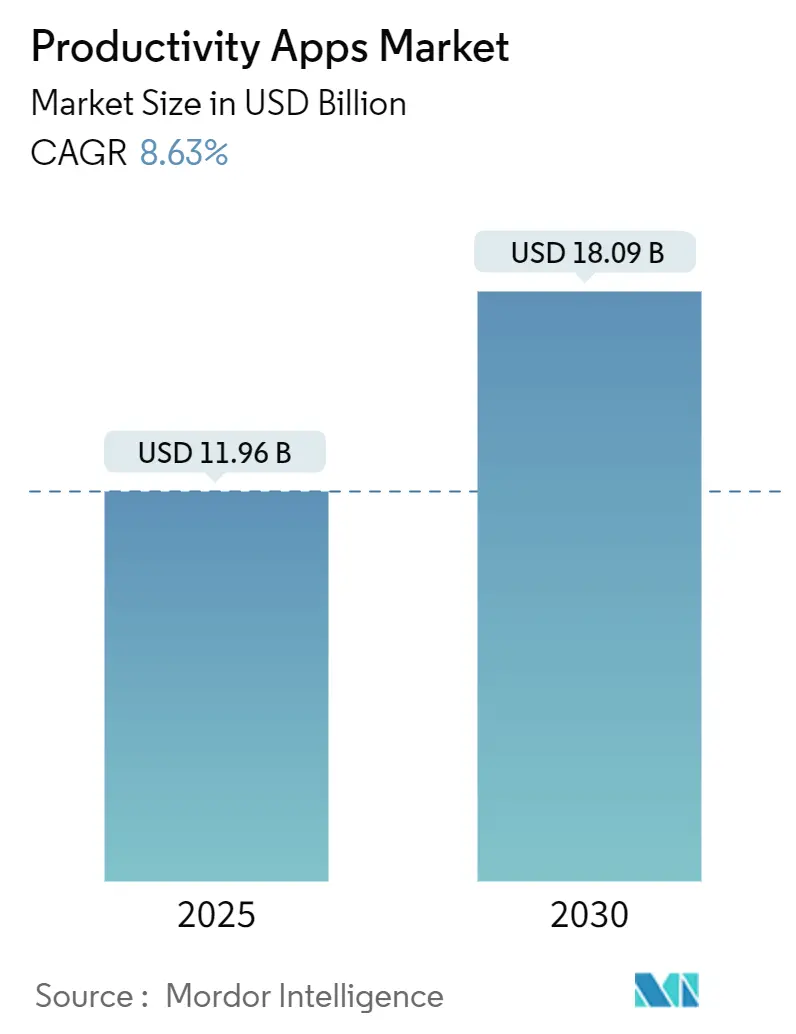
| Market Size (2025) | USD 11.96 Billion |
| Market Size (2030) | USD 18.09 Billion |
| Growth Rate (2025 - 2030) | 8.63% CAGR |
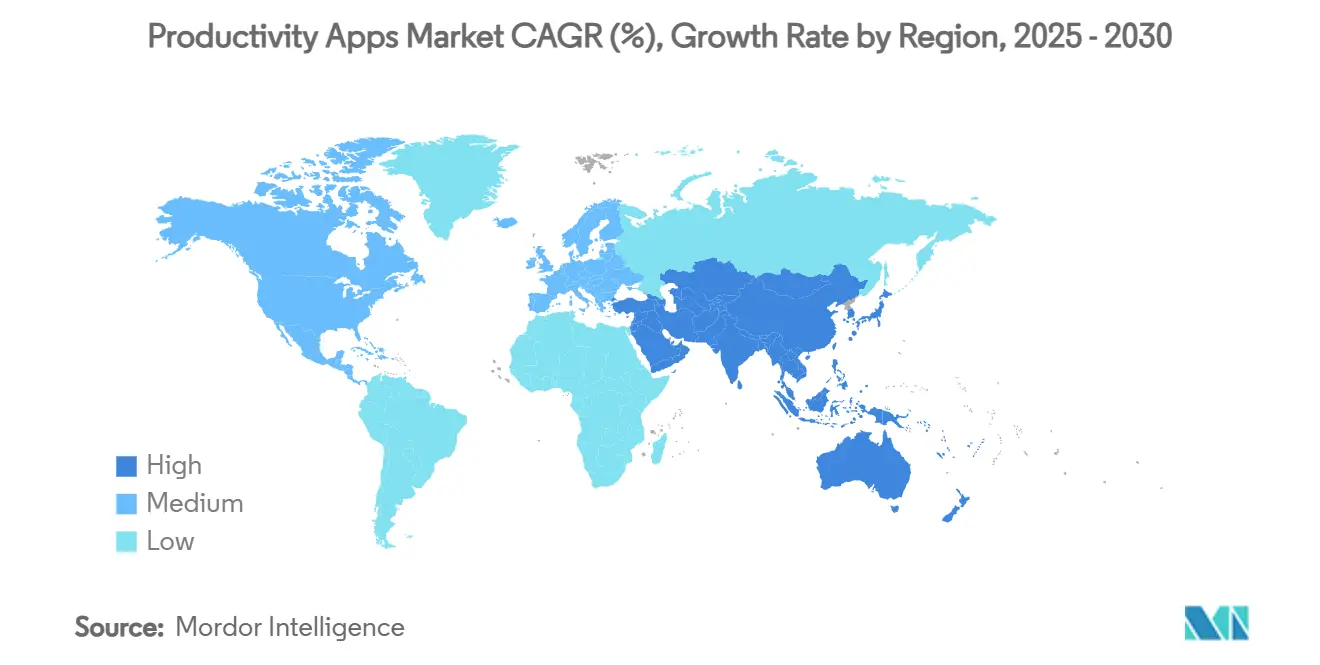
| Fastest Growing Market | Asia Pacific |
| Largest Market | North America |
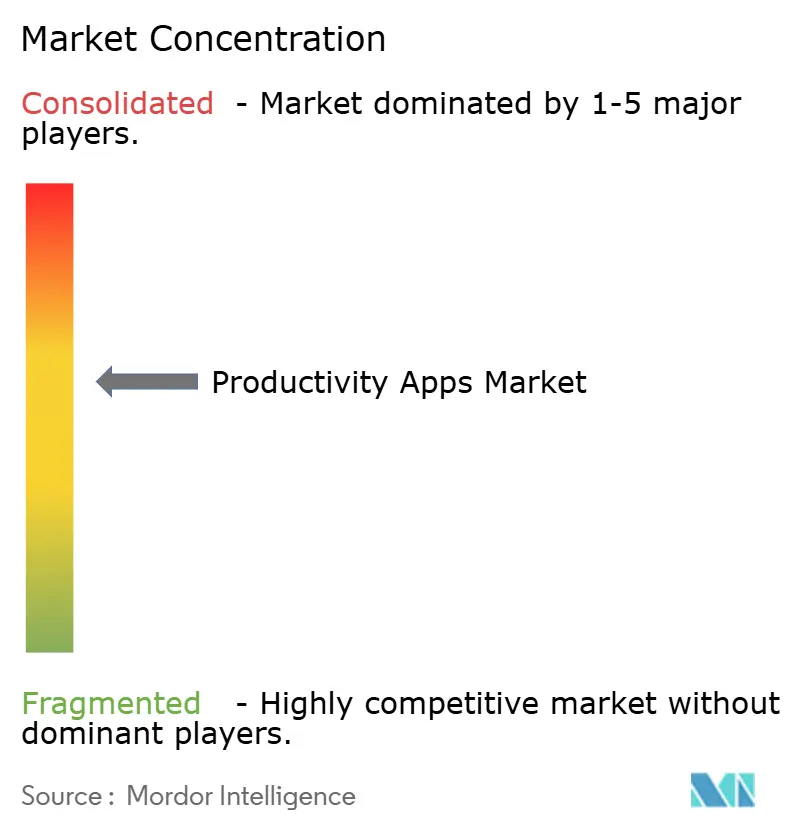
| Market Concentration | Medium |
Major Players *Disclaimer: Major Players sorted in no particular order Image © Mordor Intelligence. Reuse requires attribution under CC BY 4.0. | |
Productivity Apps Market Analysis by Mordor Intelligence
The productivity apps market size stands at USD 11.96 billion in 2025 and is forecast to reach USD 18.09 billion by 2030, translating into an 8.63% CAGR during 2025-2030. Demand expands as hybrid work reaches critical mass, with 30% of meetings now spanning more than one time zone, which forces enterprises to prioritise cross-platform collaboration. Vendors are successfully linking investment in productivity technology to measurable returns; for example, Eaton cut documentation time by 83% after adding AI-enabled authoring to its global knowledge base. Adoption momentum further benefits from the steady consumerisation of business software, continued cloud migration and rapid bundling of automation with traditional task management. Competitive intensity remains high as incumbents and start-ups race to differentiate on AI accuracy, workflow breadth and ecosystem extensibility. In parallel, structural headwinds such as digital burnout and rising security incidents tied to AI features temper the near-term growth curve.
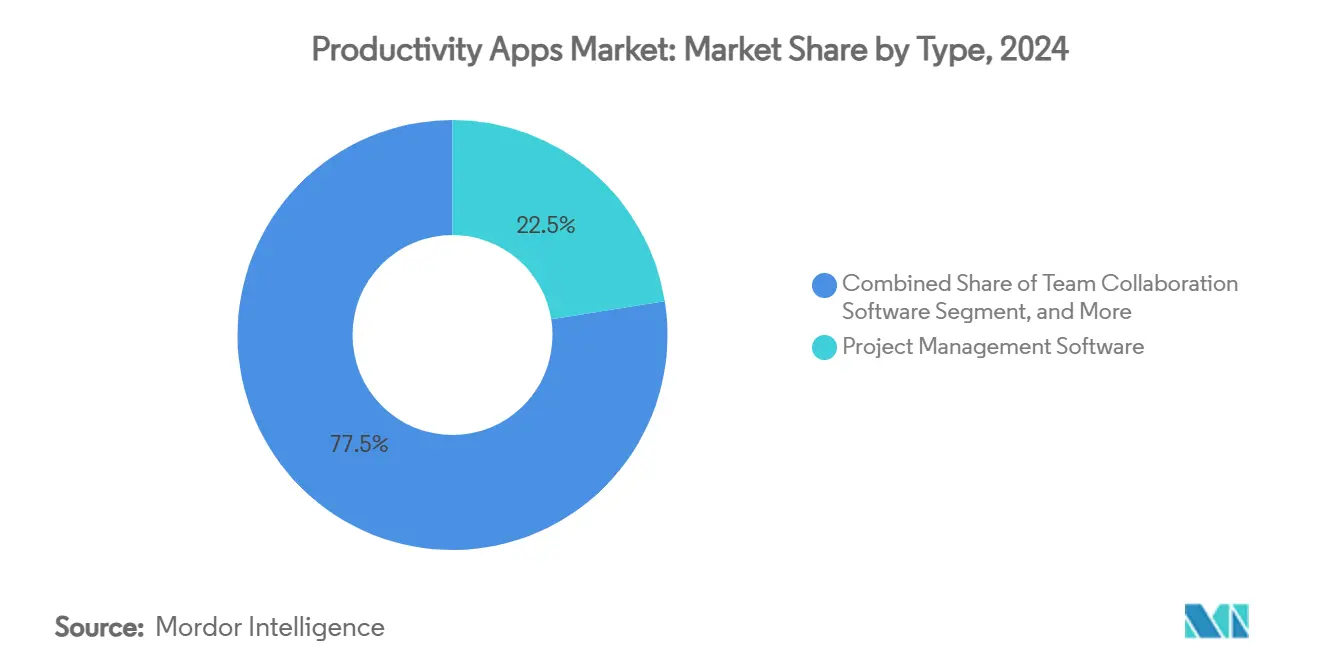
- By product type, project management software led with 22.5% of productivity apps market share in 2024, while automation & integration platforms are projected to expand at a 9.2% CAGR through 2030.
- By platform, web/desktop deployments accounted for 66.5% share of the productivity apps market size in 2024, whereas mobile deployments represent the fastest trajectory at 10.0% CAGR through 2030.
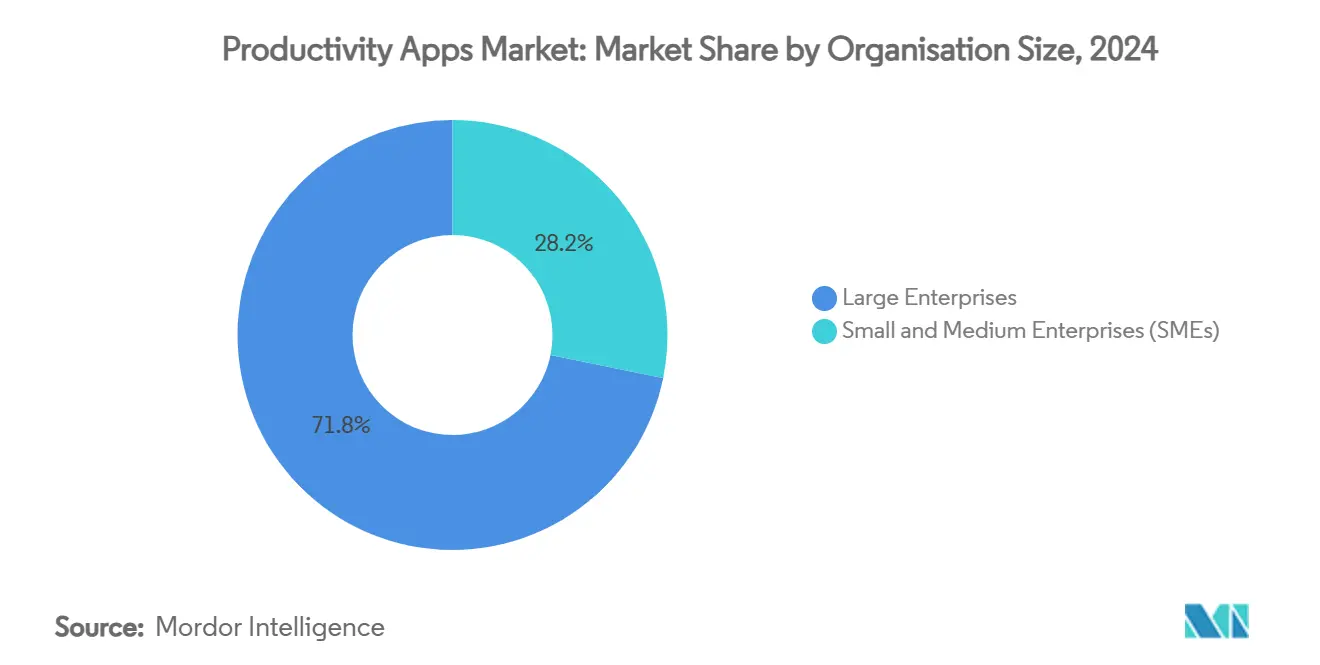
- By organisation size, large enterprises captured 71.8% of productivity apps market value in 2024, yet small and medium enterprises are set to climb at a 10.5% CAGR to 2030.
- By end-user industry, IT & telecom held 18.4% share of the productivity apps market size in 2024 and manufacturing is advancing at an 8.8% CAGR through 2030.
- By geography, North America retained leadership with 38.1% share of the productivity apps market in 2024, while Asia-Pacific shows the highest CAGR at 9.6% during 2025-2030.
Global Productivity Apps Market Trends and Insights
Drivers Impact Analysis*
| Driver | (~) % Impact on CAGR Forecast | Geographic Relevance | Impact Timeline |
|---|---|---|---|
| Remote and hybrid work models | +1.8% | Global | Medium term (2-4 years) |
| Cloud computing & SaaS delivery | +1.5% | Global | Long term (≥ 4 years) |
| AI & automation for workflow efficiency | +2.1% | North America & Europe | Short term (≤ 2 years) |
| Cross-platform collaboration suites | +1.2% | Global | Medium term (2-4 years) |
| No-code/low-code marketplaces | +1.4% | North America & Europe | Medium term (2-4 years) |
| Digital wellbeing apps | +0.7% | Developed markets | Long term (≥ 4 years) |
| Source: Mordor Intelligence | |||
Rising Remote and Hybrid Work Models
Cross-border online work volumes have climbed 30% since the pandemic, signalling a long-term step-change in collaboration needs. Executives increasingly accept that distributed work is permanent even while office mandates persist, which sustains procurement of secure cloud suites that bridge physical and virtual workspaces. Technology roadmaps now include asynchronous messaging, shared canvases and workflow engines that remove time-zone friction. Demand is particularly pronounced across India and other emerging talent hubs that rely on global freelancing to remain competitive. Enterprises therefore continue to rebuild digital workplaces around integration-first architectures that can orchestrate conversations, files and analytics.
Integration of AI and Automation for Workflow Efficiency
More than 20% of workplace applications are expected to embed AI-driven personalisation by 2028, putting predictive task automation at the heart of software selection. Enterprise spending on ChatGPT licences ballooned 600% year-on-year, confirming that mainstream buyers now test generative AI beyond pilots.[1]Emburse, “2024 Tech Spend Index Highlights Growing Investment in SaaS and AI,” emburse.com Manufacturers illustrate the payoff, where early rollout pain gives way to a productivity J-curve that later accelerates throughput and uptime. Yahoo Japan’s decision to mandate generative AI for all 11,000 employees underscores how large organisations convert pilot learnings into full-scale operating models. Policy researchers also observe positive labour-productivity effects provided firms invest simultaneously in upskilling and secure data pipelines.
No-code/Low-code Extensibility Marketplaces
Three-quarters of enterprises already use at least four no-code tools, highlighting a structural re-allocation of development tasks from IT to domain experts. Market value could swell toward USD 251 billion by 2030 as citizen developers close skills gaps and speed time-to-value. Leading consultancies note that low-code platforms supplied 75% of new enterprise apps in 2021 and the momentum has only accelerated, especially when AI suggests components that users drag into workflows. Corporate IT teams now depend on no-code interfaces for 63% of daily operations, indicating these tools have become core rather than peripheral. The resulting agility shortens innovation cycles, allowing firms to iterate business processes in weeks rather than quarters.
Proliferation of Cloud Computing and SaaS Delivery
SaaS expenditure grew 7.7% in Q2 2024 even as finance teams scrutinised subscription overlap. Cloud-native architecture enables instantaneous updates and global availability yet raises data-residency and vendor lock-in concerns. Microsoft’s Copilot rollout demonstrates both the demand and complexity of cloud AI, with nearly 70% of Fortune 500 firms adopting the assistant within its first year. API-first design is increasingly standard to weave disparate platforms into cohesive digital workspaces, but inconsistent rate limits and schema versions still restrict interoperability across providers. Overall, SaaS delivery lowers entry barriers for small teams while supporting the scale demands of multinational deployments.
Restraints Impact Analysis*
| Restraint | (~) % Impact on CAGR Forecast | Geographic Relevance | Impact Timeline |
|---|---|---|---|
| Data security & privacy in cloud apps | -1.3% | Global | Short term (≤ 2 years) |
| Subscription fatigue among SMEs | -0.9% | Global | Medium term (2-4 years) |
| API rate limits & interoperability gaps | -0.6% | Global | Medium term (2-4 years) |
| Digital burnout & reduced end-user adoption | -0.8% | Developed markets | Long term (≥ 4 years) |
| Source: Mordor Intelligence | |||
Data Security and Privacy Concerns in Cloud Apps
The share of security incidents linked to AI tools jumped to 40% in 2025 from 27% in 2023, underscoring how fast innovation outpaces governance.[2]Knostic, “Microsoft Copilot Data Security & Governance Guide,” knostic.ai Firms must layer zero-trust principles and content-filtering over every productivity workflow because sensitive data now travels through text generation, summarisation and searchable transcript modules. For regulated industries, contractual addenda such as HIPAA Business Associate Agreements become mandatory before AI features can go live. Over-permissioned access and hallucinated content heighten risk, forcing additional review cycles that slow roll-outs. Consequently, buyers increasingly favour vendors that publish transparent security roadmaps and third-party audit attestations.
Digital Burnout Reducing End-User Adoption
Cognitive overload from continuous notifications and virtual multitasking erodes the very efficiency software promises. Quantitative studies show that high information load correlates with stress, burnout and poorer mental-health outcomes. Gig-economy workers exhibit heightened creativity when absorbed in technology, yet once digital saturation thresholds are crossed, creative performance drops and burnout rises. Remote environments intensify the challenge by blurring work-life boundaries, leading organisations to deploy structured “digital-detox” policies and analytics that cap after-hours collaboration. If unaddressed, fatigue diminishes utilisation rates and can delay broader platform upgrades, especially where labour regulations emphasise psychosocial safety.
*Our forecasts treat driver/restraint impacts as directional, not additive. The impact forecasts reflect baseline growth, mix effects, and variable interactions.
Segment Analysis
By Type: Project Management Leads While Automation Accelerates
Project management maintained a 22.5% productivity apps market share in 2024, reflecting its entrenched role in orchestrating complex, cross-functional initiatives. Demand remains buoyant as enterprises scale agile practices and require Gantt, Kanban and risk-tracking features that feed executive dashboards. Nonetheless, automation & integration platforms are setting the growth pace with a 9.2% CAGR to 2030 as organisations pivot from manual task capture to event-driven workflow orchestration. The shift is visible in rising API call volumes and adoption of trigger-based rules that hand off repetitive actions to bots, freeing managers for higher-order planning. Collaboration suites that blend chat, whiteboarding and project timelines also gain traction, eroding the legacy divide between work execution and communication. Note-taking tools evolve toward AI-powered knowledge bases that summarise meeting outcomes and surface reusable snippets, lowering search friction. Digital whiteboards such as Miro — now serving 200,000 customers — exemplify how visual canvases fill the creativity gap left by virtual meetings. Focus-management apps continue to emerge, driven by wellbeing initiatives and policy pressure to mitigate digital overload. Collectively, these dynamics reinforce a dual-track market in which structured project governance coexists with lightweight automation layers that adapt workflows in real time.


By Platform: Mobile Momentum Challenges Desktop Dominance
Web/desktop deployments still capture 66.5% of productivity apps market value in 2024 because enterprises historically standardised on browser-centric suites that integrate with corporate identity stacks. Yet mobile installations are accelerating at 10.0% CAGR through 2030, buoyed by the fact that employees pick up their phones roughly 150 times per day. Mobility has shifted from mere convenience to necessity as frontline staff and managers alike expect parity of features across devices. Low-code rapid-mobile development fills talent shortages by letting domain specialists assemble micro-apps without Objective-C or Kotlin expertise. Browser extensions and progressive web apps further blur boundaries, letting knowledge workers resume sessions across laptop, tablet and smartphone without losing context. Despite growth, mobile faces challenges such as battery drain from continuous video calls and the need for containerised data models that meet enterprise security standards on personal devices. Vendors that provide adaptive layouts, offline editing and biometric sign-on are best positioned to capture the upswing. Meanwhile, cross-platform SDKs ensure that a single codebase can target multiple form factors, shortening release cycles and reducing fragmentation.
By Organisation Size: SME Acceleration Narrows the Gap
Large enterprises accounted for 71.8% of spending in 2024 as complex workflows, global compliance and deep customisation needs justify multi-year productivity roadmaps. These organisations often deploy 200-plus distinct SaaS products, making integration engines and licence governance essential. However, small and medium enterprises are forecast to grow at 10.5% CAGR, carving out a rising share of the overall pool. Cloud subscription tiers and embedded best-practice templates reduce onboarding friction, allowing SMEs to benefit from capabilities once reserved for Fortune-scale IT stacks. Studies show that SMEs integrating IoT-enabled inventory modules into their productivity suites achieve 25-35% improvements in stock accuracy alongside 20-30% cuts in carrying costs, usually realising positive ROI inside 18 months. Challenges remain: SMEs hold heightened sensitivity to subscription overlap and often lack specialist admins, pushing vendors to bundle support and usage analytics into entry-level plans. Public-sector programmes in Europe also direct grants toward SME digitisation, signalling policy-level support for sustained uptake.
By End-User Industry: Manufacturing Emerges as Fastest Climber
IT and telecom retained leadership with an 18.4% productivity apps market share in 2024, mirroring the sector’s high volume of globally distributed engineering work that benefits early from collaboration stacks. Manufacturing, however, posts the highest growth at 8.8% CAGR through 2030 as Industry 4.0 blurs factory and office software. Plant managers increasingly layer visual whiteboards, issue-tracking and AI analytics onto operational dashboards, synchronising maintenance crews and supply-chain partners. BFSI teams rely on structured approval chains that match the stringent audit trails required by regulators. Healthcare adopts clinical-grade communication hubs to co-ordinate care pathways and research protocols. Education remains a core vertical, with universities embedding LMS modules directly into workspace apps to enable blended learning. Retail and e-commerce deploy productivity functions across merchandising and customer-care teams, particularly during seasonal volume spikes. Government agencies embrace secure, audit-ready collaborative suites to meet transparency mandates, though procurement cycles remain lengthy. Across industries, the common denominator is tighter alignment between front-line execution and back-office analytics, often mediated by AI assistants that surface actionable insights.
Geography Analysis
North America preserved 38.1% of global spending in 2024 because of mature cloud infrastructure, continuous innovation funding and high per-capita licence counts. United States multinationals lead adoption of AI copilots and low-code automation, using them to rationalise sprawling application portfolios. Canada follows through federal programmes that subsidise SME digitisation, while Mexico benefits from near-shoring trends that require cross-border project orchestration. Growth moderates slightly as large enterprises approach saturation in core communication modules and turn their focus to integration quality and security posture. Regulatory scrutiny of AI content generation also drives cautious rollout of generative features, particularly in healthcare and public-sector accounts.
Asia-Pacific registers the fastest expansion at 9.6% CAGR for 2025-2030, fuelled by demographic scale, rapid smartphone penetration and aggressive government digital agendas. India and Indonesia illustrate how cloud collaboration empowers exporters of IT services and back-office process outsourcing. Chinese manufacturers integrate productivity dashboards with MES and ERP to accelerate smart-factory goals, while Japan’s service companies formalise generative-AI playbooks like Yahoo Japan’s all-employee mandate. The result is a layered market where home-grown SaaS providers co-exist with global entrants, each tailoring offerings to local language, compliance and payment preferences. Investors inject capital into vertical-specialist start-ups, further broadening software choice for enterprise buyers.
Europe contributes a sizeable opportunity base yet realises a slower trajectory because only 15% of digital-transformation projects have fully implemented target capabilities. Enterprises expect a 38% productivity lift once rollouts mature but cite skills shortages and fragmented regulatory regimes as chief obstacles. The bloc nevertheless reports 100 million additional digital consumers since 2019, signalling downstream demand. Nordic and Benelux countries outperform on uptake of AI-driven automation, whereas Southern Europe lags due to smaller average company size and constrained IT budgets. Beyond the core regions, South America and the Middle East & Africa constitute emerging frontiers where improved fibre connectivity and cloud data-centre launches gradually lower adoption barriers, creating long-run tailwinds for vendors able to localise pricing and support.[3]Bas Bakker, “How AI Can Boost Productivity in Latin America,” imf.org

Competitive Landscape
Competition is moderate-to-high, with platform giants Microsoft, Google and Atlassian leveraging integrated suites to retain enterprise wallet share, while specialist vendors such as Asana, Monday.com, Notion and Context innovate on usability and AI depth. M&A shapes the field: Grammarly’s purchase of Coda unites writing assistance with flexible workspace documents, and Smartsheet’s USD 8.4 billion sale to private-equity owners injects fresh capital for enterprise work-management expansion. Atlassian extends its reach by buying Loom and embedding AI assistants that auto-summary video meetings directly into Jira and Confluence. Meanwhile, Canva and Miro push visual collaboration into adjacent whiteboarding niches, challenging traditional slideware.
Strategic differentiation hinges on three levers. First, proprietary AI models that improve summarisation accuracy, action-item extraction and language translation deliver tangible user value. Second, open APIs and marketplace ecosystems nurture third-party extensions that lock customers into network effects. Third, verticalised templates and compliance libraries shorten deployment cycles in regulated industries. New entrants exploit gaps such as digital-wellbeing analytics and low-code automation for non-technical staff, often delivered via freemium tiers to drive viral adoption. Incumbents respond by expanding license bundles and embedding copilots throughout the workflow to maintain daily active-user relevance.
Pricing complexity is rising as procurement teams battle subscription sprawl. Vendors emphasise total cost of ownership calculations that include automation savings to justify seat expansions. Security posture becomes a primary decision factor after the spike in AI-related incidents, propelling third-party audits and regional data-hosting options to the forefront of sales conversations. Overall market architecture is likely to consolidate around a handful of broad platforms co-existing with a long tail of micro-specialists focused on domain-specific needs.
Productivity Apps Industry Leaders
Microsoft Corporation
Google LLC
Atlassian Corporation PLC
Salesforce Inc. (Slack)
Citrix Systems Inc. (GoTo)
- *Disclaimer: Major Players sorted in no particular order

Recent Industry Developments
- July 2025: Context raised USD 11 million in seed funding to launch an AI-native office suite that automates knowledge work via generative agents.
- March 2025: Notion exceeded 100 million users and announced Notion Mail after positive beta feedback.
- January 2025: Atlassian reported USD 5 billion run-rate revenue and crossed 1 million monthly active AI users across its platform.
- January 2025: Smartsheet completed its USD 8.4 billion acquisition by Blackstone and Vista Equity Partners, paying shareholders USD 56.50 per share.


Global Productivity Apps Market Report Scope
| Project Management Software |
| Team Collaboration Software |
| Note-Taking and Documentation |
| Time Tracking and Scheduling |
| Focus and Distraction Management Tools |
| Automation and Integration Platforms |
| Digital Whiteboarding |
| Other Types |
| Web / Desktop |
| Mobile (iOS and Android) |
| Cross-platform / Browser Extensions |
| Large Enterprises |
| Small and Medium Enterprises (SMEs) |
| IT and Telecom |
| BFSI |
| Healthcare and Life Sciences |
| Education |
| Manufacturing |
| Retail and E-commerce |
| Media and Entertainment |
| Government and Public Sector |
| Other End-User Industries |
| North America | United States |
| Canada | |
| Mexico | |
| Europe | Germany |
| United Kingdom | |
| France | |
| Italy | |
| Spain | |
| Rest of Europe | |
| Asia-Pacific | China |
| Japan | |
| India | |
| South Korea | |
| Australia | |
| Rest of Asia-Pacific | |
| South America | Brazil |
| Argentina | |
| Rest of South America | |
| Middle East and Africa | Saudi Arabia |
| United Arab Emirates | |
| South Africa | |
| Egypt | |
| Rest of Middle East and Africa |
| By Type | Project Management Software | |
| Team Collaboration Software | ||
| Note-Taking and Documentation | ||
| Time Tracking and Scheduling | ||
| Focus and Distraction Management Tools | ||
| Automation and Integration Platforms | ||
| Digital Whiteboarding | ||
| Other Types | ||
| By Platform | Web / Desktop | |
| Mobile (iOS and Android) | ||
| Cross-platform / Browser Extensions | ||
| By Organization Size | Large Enterprises | |
| Small and Medium Enterprises (SMEs) | ||
| By End-User Industry | IT and Telecom | |
| BFSI | ||
| Healthcare and Life Sciences | ||
| Education | ||
| Manufacturing | ||
| Retail and E-commerce | ||
| Media and Entertainment | ||
| Government and Public Sector | ||
| Other End-User Industries | ||
| By Geography | North America | United States |
| Canada | ||
| Mexico | ||
| Europe | Germany | |
| United Kingdom | ||
| France | ||
| Italy | ||
| Spain | ||
| Rest of Europe | ||
| Asia-Pacific | China | |
| Japan | ||
| India | ||
| South Korea | ||
| Australia | ||
| Rest of Asia-Pacific | ||
| South America | Brazil | |
| Argentina | ||
| Rest of South America | ||
| Middle East and Africa | Saudi Arabia | |
| United Arab Emirates | ||
| South Africa | ||
| Egypt | ||
| Rest of Middle East and Africa | ||


Key Questions Answered in the Report
What is the current value of the productivity apps market?
The productivity apps market size is USD 11.96 billion in 2025.
How fast is the productivity apps market expected to grow?
The market is projected to post an 8.63% CAGR between 2025 and 2030.
Which product category holds the largest share today?
Project management software leads with a 22.5% market share in 2024.
Which geographic region is expanding the fastest?
Asia-Pacific shows the highest growth, with a 9.6% CAGR forecast through 2030.
What is the main risk slowing adoption?
Data-security and privacy concerns surrounding AI-enabled cloud apps currently pose the largest restraint, shaving an estimated 1.3 percentage points off the forecast CAGR.
Page last updated on:


