Enterprise Metadata Management Market Size and Share
Market Overview
| Study Period | 2020 - 2031 |
|---|---|
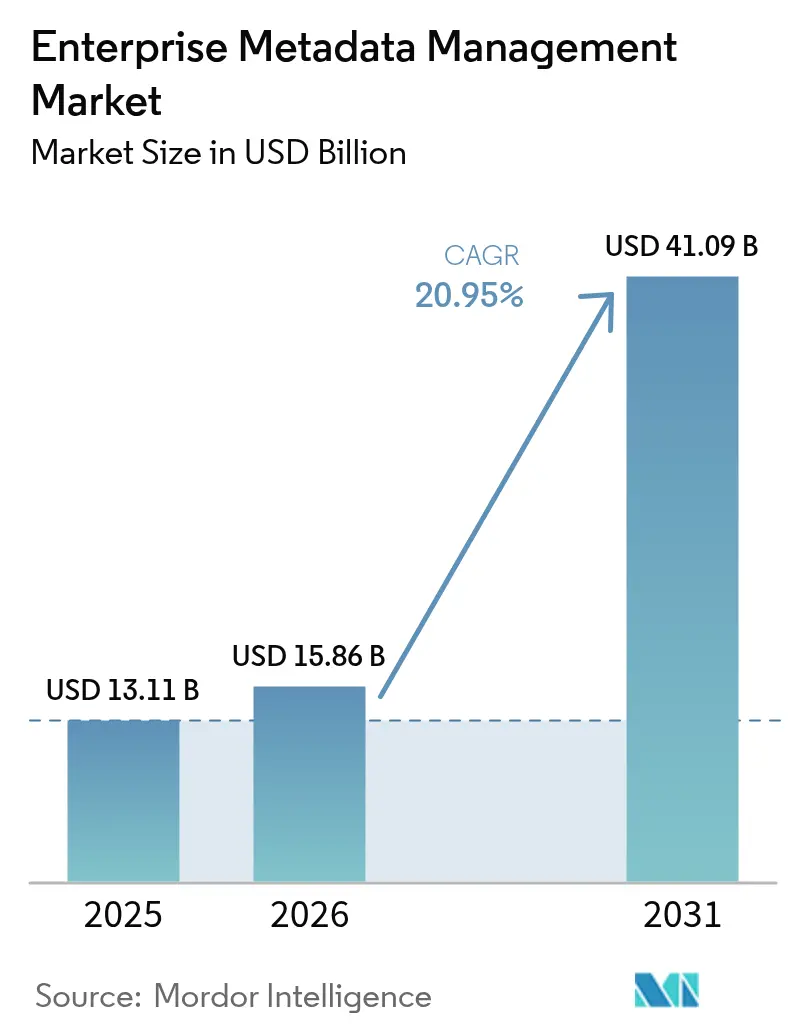
| Market Size (2026) | USD 15.86 Billion |
| Market Size (2031) | USD 41.09 Billion |
| Growth Rate (2026 - 2031) | 20.95% CAGR |
| Fastest Growing Market | Asia Pacific |
| Largest Market | North America |
| Market Concentration | Medium |
Major Players *Disclaimer: Major Players sorted in no particular order Image © Mordor Intelligence. Reuse requires attribution under CC BY 4.0. | |
Enterprise Metadata Management Market Analysis by Mordor Intelligence
Enterprise Metadata Management market size in 2026 is estimated at USD 15.86 billion, growing from 2025 value of USD 13.11 billion with 2031 projections showing USD 41.09 billion, growing at 20.95% CAGR over 2026-2031. Strong investment momentum stems from converging regulatory mandates, intensified cloud and hybrid migrations, and AI-driven demand for unified, actionable data. North America remains the largest regional contributor, supported by mature governance frameworks and high cloud uptake, while Asia-Pacific is on a steeper trajectory as new privacy statutes and rapid digitalization expand the addressable base. Solution licenses still deliver the bulk of revenue, yet service engagement is accelerating as enterprises seek integration and change-management expertise to scale metadata programs. Competitive activity is heating up: leading vendors continue to embed AI agents for automated lineage, and newer entrants focus on decentralized architectures that keep pace with data-mesh adoption.
Key Report Takeaways
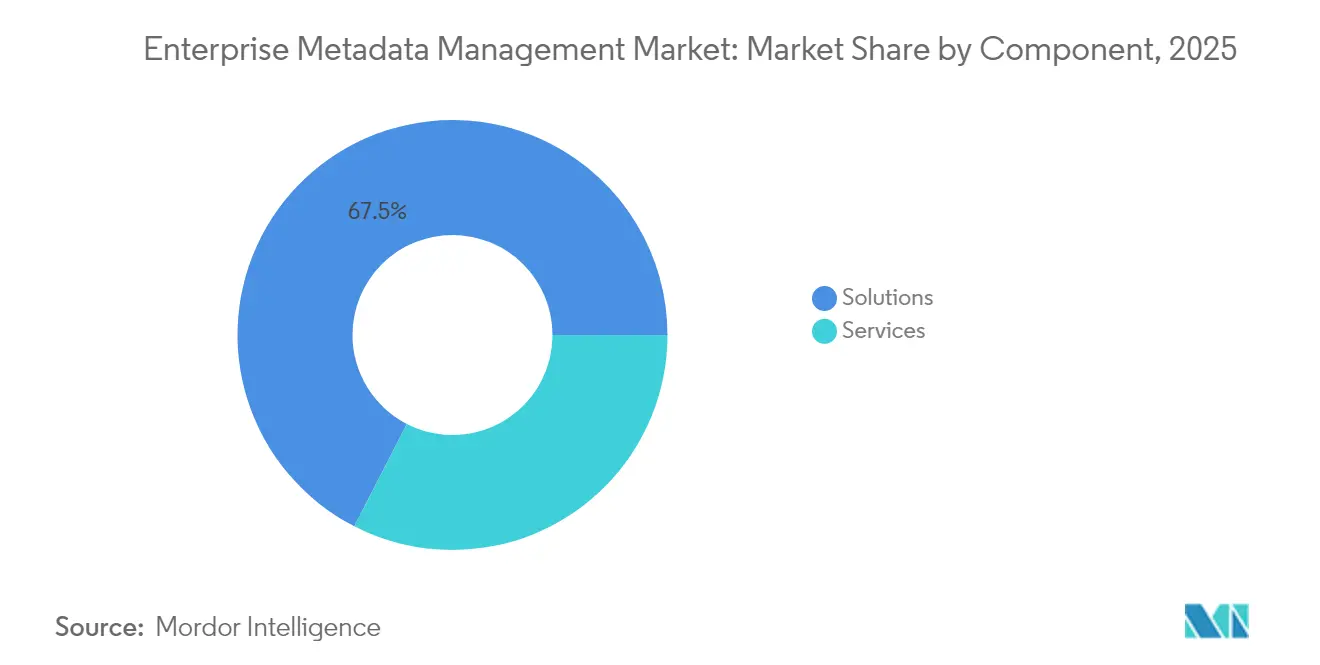
- By component, solutions captured 67.45% of revenue in 2025, while services are on course for a 23.52% CAGR through 2031.
- By deployment mode, cloud deployments held 58.10% of the enterprise metadata management market share in 2025; hybrid models are projected to grow at a 22.55% CAGR to 2031.
- By metadata type, business metadata led with a 50.65% share in 2025, whereas operational/process metadata is forecast to post a 23.05% CAGR through 2031.
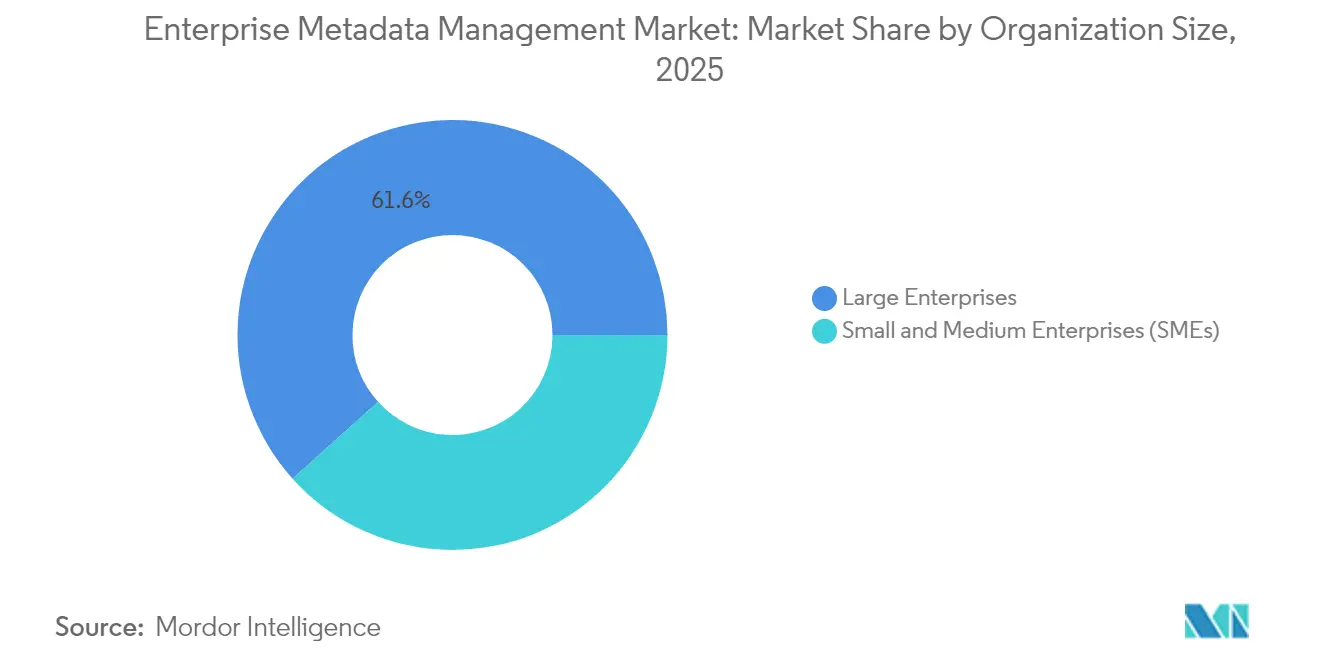
- By organization size, large enterprises accounted for 61.65% of the enterprise metadata management market size in 2025, yet SMEs are expected to advance at a 24.10% CAGR by 2031.
- By end-user industry, IT and telecom contributed 25.10% of revenue in 2025; retail and e-commerce are anticipated to expand at a 22.70% CAGR to 2031.
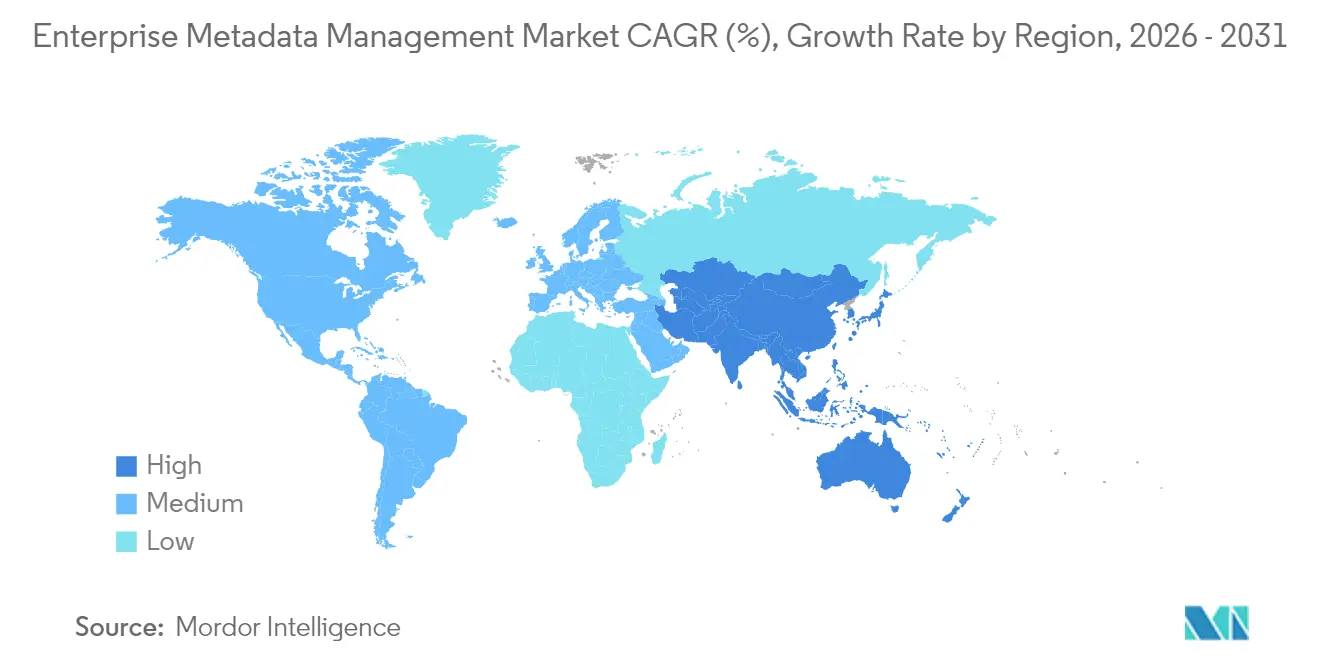
- By geography, North America led with 35.72% enterprise metadata management market share in 2025, while Asia-Pacific is set to record a 24.05% CAGR through 2031.
Note: Market size and forecast figures in this report are generated using Mordor Intelligence’s proprietary estimation framework, updated with the latest available data and insights as of 2026.
Global Enterprise Metadata Management Market Trends and Insights
Drivers Impact Analysis*
| Driver | (~) % Impact on CAGR Forecast | Geographic Relevance | Impact Timeline |
|---|---|---|---|
| Explosion of enterprise data volumes | +3.5% | Global | Medium term (2-4 years) |
| Regulatory compliance and data-governance mandates | +2.8% | North America, EU, APAC core | Short term (≤ 2 years) |
| Cloud and hybrid migration requires unified metadata | +2.6% | Global, APAC, Europe | Medium term (2-4 years) |
| Self-service analytics adoption spurs data-catalog demand | +2.1% | North America, Europe, APAC | Medium term (2-4 years) |
| Generative-AI-driven auto-classification unlocks ROI | +1.7% | Global | Long term (≥ 4 years) |
| Data-mesh architectures need federated metadata services | +1.2% | Europe, North America, APAC | Long term (≥ 4 years) |
| Source: Mordor Intelligence | |||
Explosion of enterprise data volumes
IoT rollouts, 5G connectivity, and omnichannel commerce are swelling corporate data troves, pushing metadata management to board agendas. AT&T used Snowflake to consolidate metadata across legacy and cloud assets, accelerating analytics while cutting infrastructure costs. [1]Snowflake, “AT&T Provides Faster Insights at Lower Costs with Snowflake,” snowflake.com Similar initiatives are multiplying in telecom and e-commerce, where high-velocity data flows demand automated lineage and cataloging to sustain agility and compliance.
Regulatory compliance and data-governance mandates
Fresh regulations are tightening oversight. Malaysia now obliges firms with more than 20,000 data subjects to nominate Data Protection Officers and notify breaches, a step that is enlarging the enterprise metadata management market. [2]ASEAN Briefing, “Malaysia Tightens Data Protection from June 2025,” aseanbriefing.com India’s Digital Personal Data Protection Act and China’s Interim AI Measures act likewise raise expectations for granular lineage and consent tracking. Singapore’s banking regulator mandates AI model risk governance, reinforcing the need for transparent metadata.
Cloud and hybrid migration requires unified metadata
Organizations migrate analytic workloads to hyperscale clouds yet keep sensitive datasets on-premises. TELUS migrated to Google Cloud, retiring obsolete data and optimizing 200+ pipelines, demonstrating the integration complexity enterprises face. Hybrid patterns prevail in regulated sectors that must balance residency rules with cloud scalability, pushing demand for federated metadata services.
Self-service analytics adoption spurs data-catalog demand
Line-of-business analysts now expect intuitive catalogs that supply context and trust signals. NTT DOCOMO adopted Alation to democratize data discovery, equipping non-technical users with governed access. In retail, a new patent for hyper-localized assortment optimization shows how rich metadata feeds agile merchandising models.
Restraints Impact Analysis*
| Restraint | (~) % Impact on CAGR Forecast | Geographic Relevance | Impact Timeline |
|---|---|---|---|
| High implementation cost and integration complexity | -2.5% | Global, especially SMEs | Short term (≤ 2 years) |
| ROI uncertainty and skills shortage | -2.1% | Global | Medium term (2-4 years) |
| Multi-cloud metadata silos limit lineage completeness | -1.6% | Multinational, regulated sectors | Medium term (2-4 years) |
| Data-sovereignty limits cross-border metadata hosting | -1.2% | APAC, Europe, MEA | Medium term (2-4 years) |
| Source: Mordor Intelligence | |||
High implementation cost and integration complexity
Legacy sprawl inflates deployment timelines and budgets. Citigroup’s fragmented data stack incurred USD 1.5 billion in fines, illustrating the risk of retrofitting modern metadata onto heritage systems. SMEs, with leaner resources, hesitate to invest without near-term returns, dampening uptake.
ROI uncertainty and skills shortage
Quantifying value is difficult when benefits span risk, efficiency, and decision quality. Scarce data stewards and engineers further slow progress. Firms counter by choosing SaaS catalogs that bootstrap automation; telecom operators used UltiHash tools to trim storage costs while improving observability. [3]UltiHash, “Intelligent Network Management in Telecoms,” ultihash.io
*Our forecasts treat driver/restraint impacts as directional, not additive. The impact forecasts reflect baseline growth, mix effects, and variable interactions.
Segment Analysis
By Component: Services Outpace as Integration Complexity Rises
Solutions produced 67.45% of revenue in 2025. The enterprise metadata management market expects services to grow at a 23.52% CAGR to 2031 as firms need consulting for hybrid integration, AI enablement, and regulatory readiness. Deutsche Telekom partnered with Capgemini for a TMForum-aligned model that shortened product-launch cycles, highlighting service value.
Enterprises also outsource managed metadata operations to navigate ever-changing privacy laws and cloud tooling, fueling annuity revenues for system integrators and MSPs. As cloud estates scale, outcome-based service contracts expand, reinforcing a healthy pipeline for advisory, implementation, and support.


By Deployment Mode: Hybrid Models Bridge Compliance and Agility
Cloud remains the default, holding 58.10% market share in 2025. However, hybrid configurations are projected to post a 22.55% CAGR because regulated entities must localize sensitive data while exploiting cloud analytics. Malaysia’s new privacy guidelines and Singapore’s sovereign cloud framework intensify this pattern.
Hybrid tooling unites on-prem and cloud catalogs into a single control plane. TELUS proved the model by maintaining critical data hubs on-site while orchestrating analytics in Google Cloud, safeguarding residency obligations without impeding AI development.
By Metadata Type: Operational Metadata Powers Supply-Chain Resilience
Business metadata occupies 50.65% of 2025 spend, yet operational/process metadata is forecast to climb at 23.05% CAGR. Manufacturers apply operational lineage to assure provenance and adapt supply networks to shocks. Alpha, a German firm, used a data mesh to gain real-time visibility, improving agility and performance.
Financial regulators also demand auditable process metadata that traces data movement across multi-cloud estates. The enterprise metadata management market size for operational/process metadata is set to expand from its current base as digital twin initiatives multiply in discrete and process industries.
By Organization Size: SMEs Leverage SaaS for Governance Parity
Large enterprises delivered 61.65% of revenue in 2025, but SMEs will advance faster at 24.10% CAGR. Lightweight SaaS catalogs such as Atlan or OpenMetadata allow smaller firms to embed governance without heavy capital outlays.
Regional SMEs in Asia-Pacific adopt these offerings to satisfy emerging privacy statutes and compete with larger incumbents on data quality. The enterprise metadata management market share held by SMEs is likely to widen as subscription pricing and no-code integrations lower entry barriers.
By End-user Industry: Telecom and Retail Lead Adoption, E-commerce Surges
IT and Telecom captured 25.10% of the 2025 demand, propelled by network optimization and stringent compliance. AT&T and Deutsche Telekom rely on rich metadata to fast-track product innovation and manage spectrum assets. Retail and e-commerce are the quickest movers, tracking a 22.70% CAGR as omnichannel merchants need metadata for hyper-localized assortment and dynamic pricing.
A patent granted in 2024 shows how retailers exploit metadata to calibrate store-level variety, lifting sales and satisfaction. Fraud detection and personalized promotions further stimulate adoption across digital commerce ecosystems.
Geography Analysis
North America commands 35.72% of revenue, underpinned by the CCPA, sector-specific mandates, and a deep ecosystem of vendors and integrators. Enterprises capitalize on mature cloud infrastructure and robust venture funding, driving early experiments with AI-guided stewardship. Patent activity from Snowflake and Palantir reinforces the region’s innovation edge.
Asia-Pacific is the fastest-growing theater, rising at 24.05% CAGR. Malaysia’s mandatory DPO policy, India’s DPDPA, and China’s AI rules oblige enterprises to implement granular lineage, swelling demand. Telecommunications, retail, and manufacturing players in Indonesia and Vietnam adopt catalogs to meet new fintech and personal-data laws. The enterprise metadata management market size in Asia-Pacific is projected to more than triple by 2031.
Europe retains momentum through GDPR enforcement and the forthcoming AI Act, which emphasizes consent management and cross-border processing safeguards. Manufacturers embrace data mesh to coordinate multi-plant supply chains, while financial institutions strengthen lineage to satisfy supervisory reviews.
Smaller Latin American, Middle Eastern, and African markets are nascent but observe global precedents, gradually instituting metadata programs to shore up resilience.

Competitive Landscape
Incumbent vendors—Informatica, Collibra, Alation, IBM—consolidate their lead by integrating agentic AI, active governance, and cloud-native deployment options. Informatica launched CLAIRE Agents that automate data-quality fixes and push lineage insights into service-management tools. Collibra pilots a unified governance layer that spans structured data and ML models.
Patent filings from Snowflake and Palantir reveal multi-level metadata storage and decentralized protection for multi-cloud footprints, signaling ongoing differentiation in scale and security. Disruptors such as Zeenea, Select Star, Atlan, and OpenMetadata pursue open, composable stacks that dovetail with data-mesh principles. HCLSoftware’s planned acquisition of Zeenea underlines the strategic value of nimble discovery engines.
Partnerships flourish as system integrators package metadata solutions with broader modernization programs. Capgemini’s work with Deutsche Telekom highlights co-innovation to accelerate B2B launches. Futurum Group spotlights agentic AI as a catalyst that reduces stewardship overhead and democratizes governance. [4]Futurum Group, “The Rise of Agentic AI,” futurumgroup.com White-space remains in harmonizing cross-cloud lineage, enforcing active policy, and supporting the next wave of APAC and European regulations.
Enterprise Metadata Management Industry Leaders
Informatica LLC
Collibra NV
Alation Inc.
IBM Corporation
Oracle Corporation
- *Disclaimer: Major Players sorted in no particular order


Recent Industry Developments
- May 2025: Onix migrated a telecom provider from Teradata to BigQuery, boosting real-time analytics.
- May 2025: Informatica introduced agentic AI offerings on its cloud platform.
- April 2025: Malaysia’s privacy authority published guidelines mandating DPOs and breach notifications.
- March 2025: HCLSoftware announced its intent to buy Zeenea, expanding regulated-industry coverage.
- February 2025: Capgemini and Deutsche Telekom showcased a TMForum-based data model accelerating B2B product launches.
- January 2025: Indonesia’s regulator issued digital asset trading rules that tighten metadata controls.
- January 2025: Select Star and Collate added automated discovery and observability features for dynamic data stacks.
- January 2025: TELUS completed its Google Cloud migration, optimizing more than 200 pipelines for analytics.
- January 2025: Atlan released its third-generation data catalog for decentralized governance and real-time metadata.
- January 2025: Informatica unveiled CLAIRE Agents for automated data quality, lineage, and orchestration across hybrid environments.


Research Methodology Framework and Report Scope
Market Definitions and Key Coverage
According to Mordor Intelligence, we view the enterprise metadata management market as the revenue generated worldwide from software and cloud subscriptions, plus recurring support, that capture, catalog, govern, and distribute technical, business, and operational metadata across on-premise, cloud, and hybrid data estates.
Scope Exclusions: One-off consulting projects, open-source utilities, and bundled data-catalog modules lacking a stand-alone metadata layer remain outside our boundary.
Segmentation Overview
- By Component
- Solutions
- Services
- By Deployment Mode
- Cloud
- On-Premises
- Hybrid
- By Metadata Type
- Technical Metadata
- Business Metadata
- Operational/Process Metadata
- By Organization Size
- Large Enterprises
- Small and Medium Enterprises (SMEs)
- By End-user Industry
- BFSI
- Healthcare and Life Sciences
- Retail and E-commerce
- IT and Telecom
- Government and Public Sector
- Manufacturing
- Media and Entertainment
- Other End-user Industries
- By Geography
- North America
- United States
- Canada
- Mexico
- South America
- Brazil
- Argentina
- Chile
- Rest of South America
- Europe
- Germany
- United Kingdom
- France
- Italy
- Spain
- Russia
- Rest of Europe
- Asia-Pacific
- China
- India
- Japan
- South Korea
- Malaysia
- Singapore
- Australia
- Rest of Asia-Pacific
- Middle East and Africa
- Middle East
- United Arab Emirates
- Saudi Arabia
- Turkey
- Rest of Middle East
- Africa
- South Africa
- Nigeria
- Rest of Africa
- Middle East
- North America
Detailed Research Methodology and Data Validation
Primary Research
Mordor analysts interviewed chief data officers, architecture leads, and system-integrator partners across North America, Europe, and Asia-Pacific. The conversations validated average contract values, roll-out timelines, and renewal ratios, filling data gaps and confirming trend inflections suggested by secondary work.
Desk Research
Our team began with widely trusted public datasets such as US Bureau of Labor Statistics IT capex indices, Eurostat cloud-adoption surveys, and SEC filings that detail vendor segment revenues. Insights from groups like DAMA International, the Cloud Security Alliance, and the International Association of Privacy Professionals clarified regulatory triggers, while peer-reviewed papers helped us trace AI-driven lineage techniques. Paid intelligence drawn from D&B Hoovers and Dow Jones Factiva supplied granular company splits. These sources are illustrative only; many other open publications informed the review.
A second pass aligned terminology across regions, harmonized currency histories, and isolated metadata spend from adjacent governance tools so that our base year reflected a clean, like-for-like scope.
Market-Sizing & Forecasting
Our model applies a top-down share-of-wallet read on global enterprise software spend, weighted by the prevalence of active metadata programs by company size. Supplier revenue roll-ups, channel checks, and sampled price × volume calculations offer a selective bottom-up cross-check used to adjust totals. Key variables like cloud-migration rates, compliance spend per employee, number of regulated records, SaaS price erosion, and AI automation uptake feed a multivariate regression that extends the view to 2030. Where bottom-up slices lack coverage, matched-peer averages bridge the gap.
Data Validation & Update Cycle
Results pass variance checks against vendor earnings, public contract awards, and quarterly IT budget trackers. Deviations above preset thresholds trigger re-contacts and model tweaks before sign-off. Reports refresh annually, and analysts revisit estimates after material events so clients always receive the latest vetted view.
Why Mordor's Enterprise Metadata Management Baseline Commands Reliability
Published estimates diverge because firms draw the boundary of 'metadata' differently and assume unique price trajectories. Our disciplined scope setting, dual-lens modeling, and yearly refresh keep the baseline anchored in observable spend signals.
Key gap drivers include whether professional services are folded in, how cloud subscription prices evolve, and the treatment of currency swings.
Benchmark comparison
| Market Size | Anonymized source | Primary gap driver |
|---|---|---|
| USD 13.11 B (2025) | Mordor Intelligence | - |
| USD 14.11 B (2025) | Global Consultancy A | Combines metadata tools with wider data-catalog software, inflating totals |
| USD 10.71 B (2025) | Industry Association B | Relies on survey adoption rates without reconciling to vendor revenues |
| USD 8.80 B (2024) | Trade Journal C | Omits subscription renewals and uses static exchange rates |
In short, our blended approach links transparent scope choices with verifiable spend indicators, giving decision-makers a balanced, repeatable baseline they can trust.


Key Questions Answered in the Report
What is the current value of the enterprise metadata management market?
The enterprise metadata management market size stands at USD 15.86 billion in 2026 and is forecast to climb to USD 41.09 billion by 2031, registering a 20.95% CAGR.
Which region is growing fastest?
Asia-Pacific leads growth with a 24.05% CAGR, propelled by new privacy laws in Malaysia, India, and China plus rapid digital transformation across telecom, retail, and manufacturing.
What segment will expand most quickly?
Services are projected to advance at a 23.52% CAGR as enterprises seek consulting, integration, and managed operations to scale metadata programs.
Why are hybrid deployments gaining momentum?
Hybrid architectures help regulated organizations satisfy data-residency rules while accessing cloud analytics, making hybrid the fastest deployment mode at a 22.55% CAGR.
How are vendors differentiating in this market?
Incumbents integrate agentic AI for automated lineage, while disruptors offer open, composable stacks optimized for data mesh and decentralized governance.
What is the chief barrier to adoption?
High integration cost and skills shortages deter many firms, especially SMEs, though SaaS platforms and automation are beginning to lower entry hurdles.
Page last updated on:


