Metaverse In Gaming Market Size and Share
Market Overview
| Study Period | 2020 - 2031 |
|---|---|
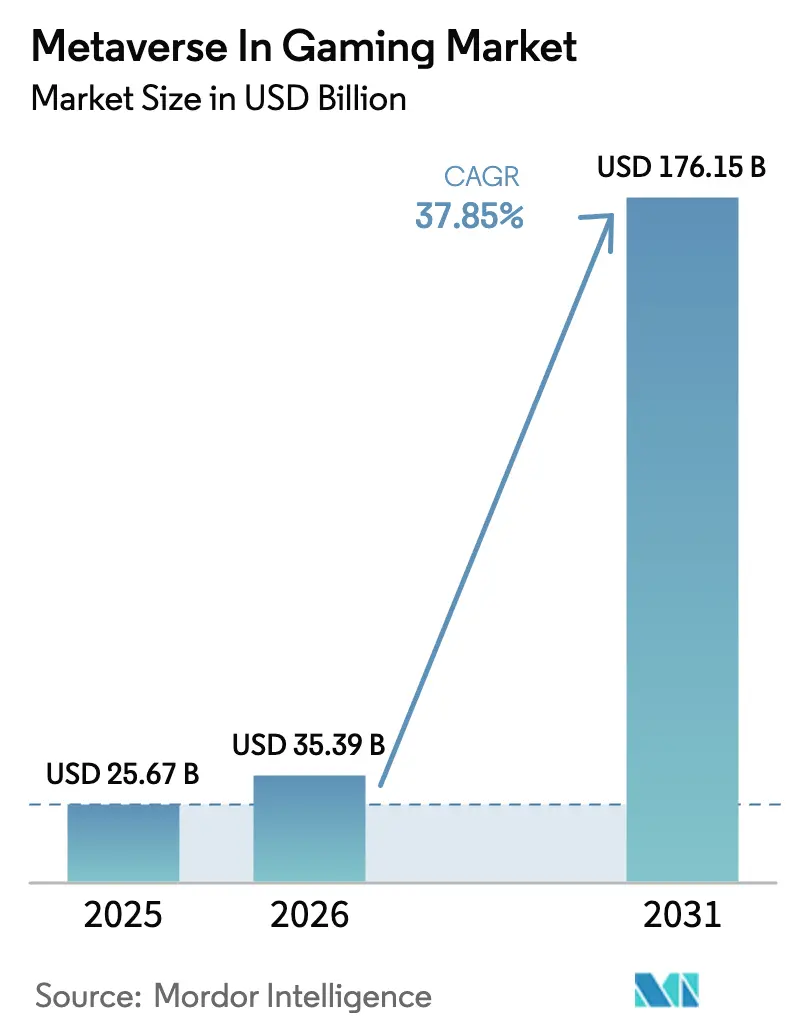
| Market Size (2026) | USD 35.39 Billion |
| Market Size (2031) | USD 176.15 Billion |
| Growth Rate (2026 - 2031) | 37.85% CAGR |
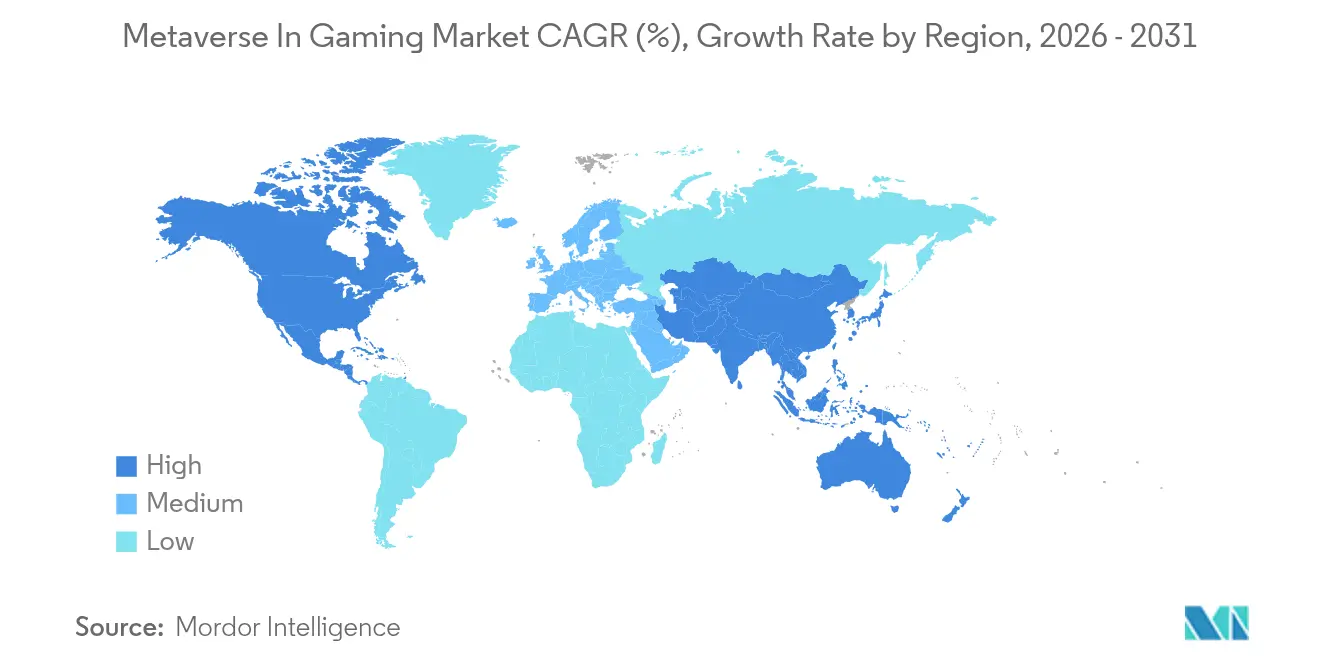
| Fastest Growing Market | Asia Pacific |
| Largest Market | North America |
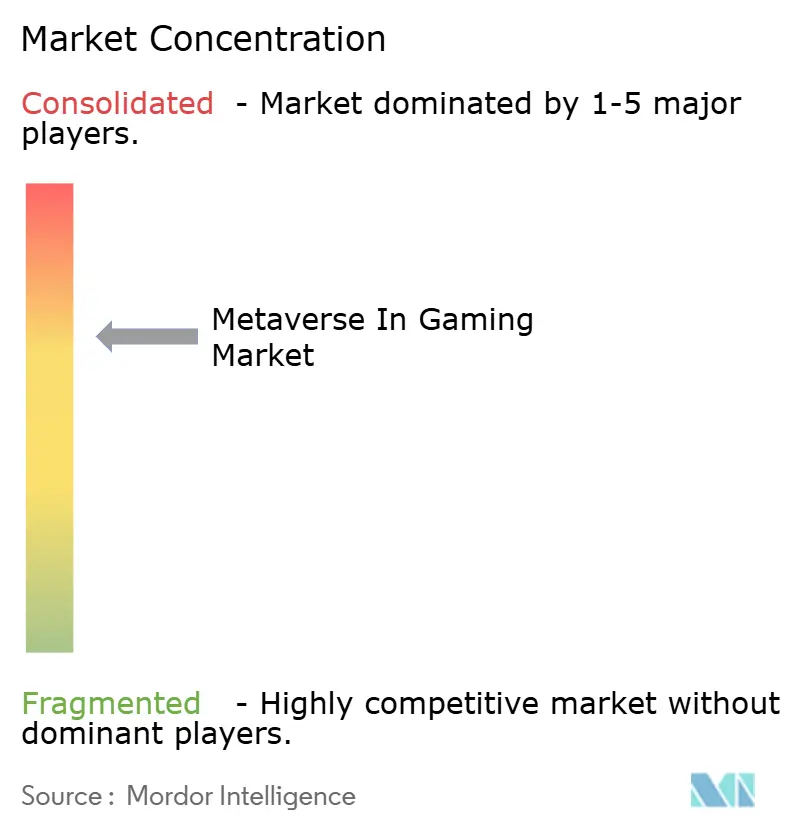
| Market Concentration | Medium |
Major Players *Disclaimer: Major Players sorted in no particular order Image © Mordor Intelligence. Reuse requires attribution under CC BY 4.0. | |
Metaverse In Gaming Market Analysis by Mordor Intelligence
The Metaverse in gaming market size is expected to grow from USD 25.67 billion in 2025 to USD 35.39 billion in 2026 and is forecast to reach USD 176.15 billion by 2031 at 37.85% CAGR over 2026-2031. Surging adoption of VR and AR headsets, the roll-out of high-speed 5G, tokenized economies, and multibillion-dollar alliances between entertainment IP owners and game platforms are powering this ascent. Hardware still brings in most revenue, yet software and services now outpace it as creators monetize avatars, live events, and play-to-earn loops. Regionally, North America commands the largest slice while Asia-Pacific records the fastest gains as China, India, Japan, and South Korea scale infrastructure and mobile penetration. Competitive intensity is sharpening as console giants, Web3 start-ups, and lifestyle brands rush to secure persistent virtual engagement. Meanwhile, cost-down optics, generative-AI authoring, and real-time voice translation are broadening the addressable base and sustaining the Metaverse in gaming market’s momentum.
Key Report Takeaways
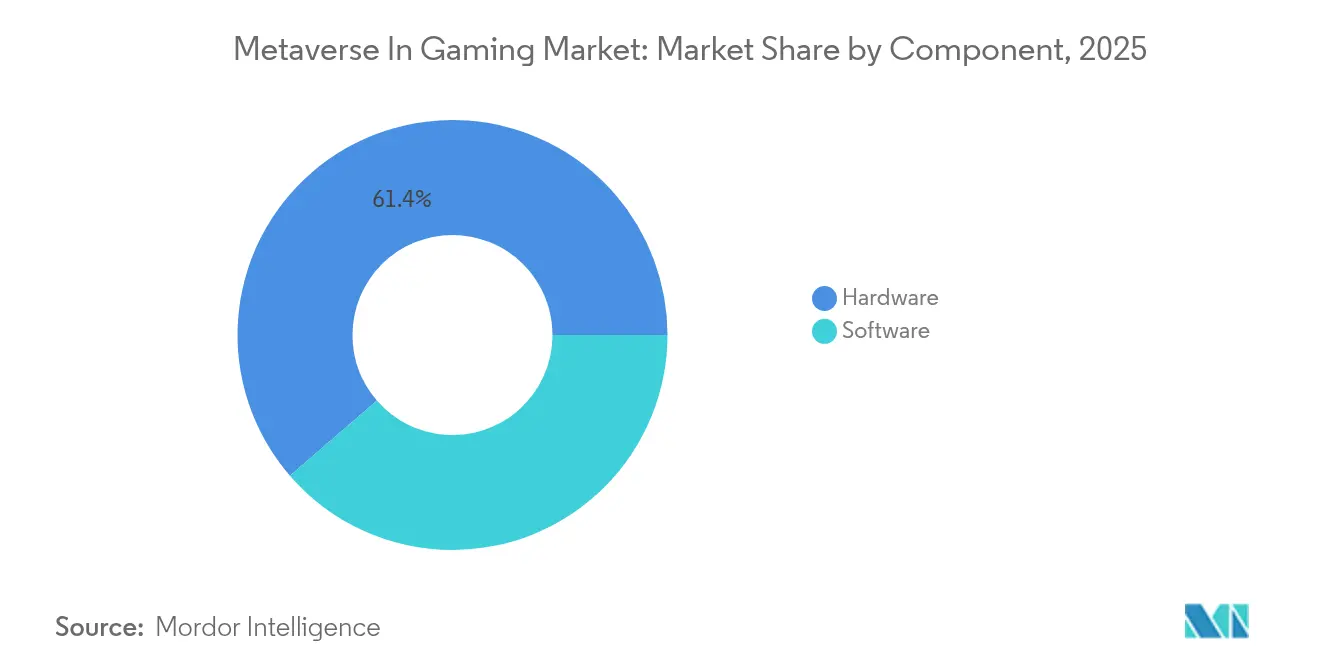
- By component, hardware contributed 61.35% of the Metaverse in gaming market share in 2025, while software is forecast to expand at a 21.4% CAGR through 2031.
- By technology, AR & VR held 48.08% revenue in 2025; blockchain is projected to accelerate at a 64.13% CAGR through 2031.
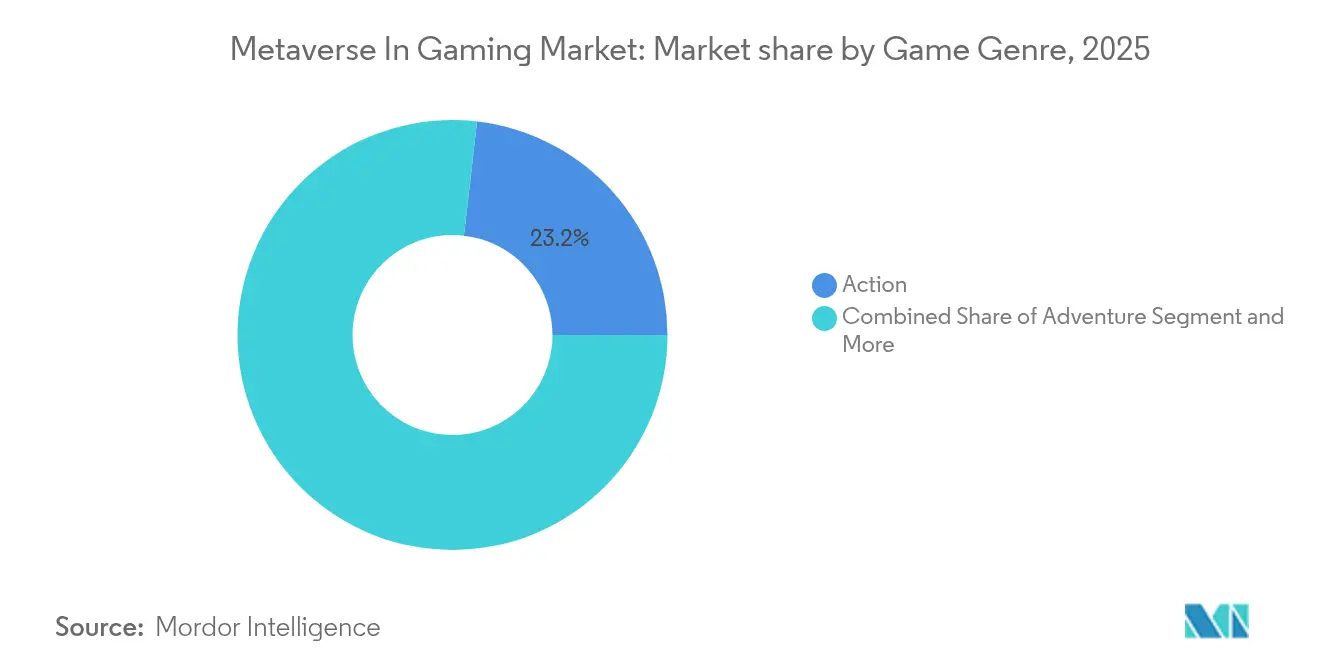
- By game genre, action titles led with 23.18% of the Metaverse in gaming market size in 2025, whereas role-playing games are set to grow at a 14.02% CAGR to 2031.
- By platform, mobile accounted for 50.25% share of the Metaverse in gaming market size in 2025, while cloud/streaming platforms are advancing at a 16.42% CAGR over the forecast horizon.
- By geography, North America generated 38.27% revenue in 2025; Asia-Pacific is expected to post a 12.32% CAGR through 2031.
Note: Market size and forecast figures in this report are generated using Mordor Intelligence’s proprietary estimation framework, updated with the latest available data and insights as of 2026.
Global Metaverse In Gaming Market Trends and Insights
Drivers Impact Analysis*
| Driver | (~) % Impact on CAGR Forecast | Geographic Relevance | Impact Timeline |
|---|---|---|---|
| Rapid adoption of VR/AR hardware | 8.5% | Global, with North America and Asia-Pacific leading | Short term (≤ 2 years) |
| Expansion of high-speed internet and 5G | 6.2% | Global, concentrated in developed markets | Medium term (2-4 years) |
| Growth of blockchain-enabled NFTs | 7.8% | Global, with Asia-Pacific early adoption | Medium term (2-4 years) |
| Big-tech and AAA studio investments | 9.1% | North America, Europe, Asia-Pacific core markets | Short term (≤ 2 years) |
| Generative-AI-driven UGC worlds | 5.4% | Global, with North America technology leadership | Long term (≥ 4 years) |
| Interoperability standards momentum | 3.2% | Global, with industry consortium leadership | Long term (≥ 4 years) |
| Source: Mordor Intelligence | |||
Rapid Adoption of VR/AR Hardware
Component suppliers now mass-produce silicon-carbide lenses that widen the field-of-view while trimming build costs[1]Ben Lang, “Meta Explores Low-Cost Silicon-Carbide Optics,” Road to VR, roadtovr.com. Apple’s Vision Pro achieved USD 1.75 billion from 500,000 units at a USD 3,500 price, proving early-adopter appetite. Meta’s Quest line captured 73% of 2024 headset shipments after 40% annual unit growth. Although Japan’s XR shipments fell 14.8% during a refresh cycle, mixed-reality variants still rose, confirming sustained interest.
Expansion of high-speed internet and 5G
Edge-enabled 5G delivers latency near 1 ms and throughput close to 1 Gbps, enabling fluid cloud play at scale. Global cloud-gaming users are forecast at 455 million in 2025, with USD 10.46 billion in revenue feeding into the Metaverse in the gaming market. NVIDIA GeForce Now, Xbox Cloud Gaming, and Amazon Luna harness adaptive streaming to stabilize frames in persistent worlds. Emerging economies leapfrog fixed broadband by sliding straight to 5G, widening participation.
Growth of blockchain-enabled NFTs
Web3 titles attract over 800,000 daily gamers executing 18 million on-chain trades across The Sandbox, Splinter lands, and Axie Infinity. Energy-efficient Proof-of-Stake and Enjin’s carbon-neutral pledge temper sustainability worries. Analysts see blockchain game revenue reaching USD 614 billion by 2030, positioning tokenized ownership as a core monetization pillar.
Big-tech and AAA studio investments
Disney’s USD 1.5 billion stake in Epic Games fuses blockbuster IP with Fortnite’s 100 million-plus players. NVIDIA and Microsoft launched neural-shading pipelines that lift frame rates while reducing power draw on RTX GPUs[2]NVIDIA Corporation, “Neural Shading Advances Real-Time Graphics,” nvidia.com. Luxury conglomerate LVMH taps Unreal Engine for virtual fitting rooms, signaling retail’s push into the Metaverse in the gaming market.
Restraint Impact Analysis*
| Restraint | (~) % Impact on CAGR Forecast | Geographic Relevance | Impact Timeline |
|---|---|---|---|
| Limited ODM global service coverage | -1.8% | Global; most pronounced in emerging markets | Medium term (2-4 years) |
| Weak enterprise brand-warranty perception | -2.1% | North America and Europe | Short term (≤ 2 years) |
| Semiconductor supply-chain fragility | -1.6% | Global; concentrated impact in Asia-Pacific | Short term (≤ 2 years) |
| Firmware / root-of-trust security gaps | -0.7% | Global; regulatory focus in Europe and North America | Long term (≥ 4 years) |
| Source: Mordor Intelligence | |||
Limited ODM global service coverage
Most ODMs cluster service centers in Asia, leaving enterprises elsewhere without 24/7 on-site swap programs. Organizations running mission-critical workloads weigh potential downtime costs higher than hardware savings, often favoring OEMs that maintain worldwide parts depots and field engineers.
Weak enterprise brand-warranty perception
Risk-averse IT managers equate familiar logos with reliability. Despite comparable warranty terms, lesser-known brands face scrutiny in regulated sectors where audit trails favor long-established vendors. The perception gap slows adoption for workloads that cannot tolerate failure.
*Our forecasts treat driver/restraint impacts as directional, not additive. The impact forecasts reflect baseline growth, mix effects, and variable interactions.
Segment Analysis
By Component: Hardware Foundation Drives Adoption
Hardware contributed 61.35% of the Metaverse in gaming market share in 2025, anchoring immersion with headsets, haptic controllers, and spatial-tracking cameras. Quest models shipped 9.6 million units and retained 73% of the global volume. Apple’s mixed-reality Vision Pro extends premium appeal, while Sony refines PS VR2 for high-fidelity console experiences. Parallel advances in pancake lenses, inside-out tracking, and lightweight battery packs widen comfort and affordability.
Software, though smaller in 2025, grows at 21.4% CAGR through subscriptions, virtual-item royalties, and live-event ticketing. Unity and Unreal deliver no-code authoring that accelerates indie releases. Roblox’s new commerce API integrates physical retail without leaving gameplay. This synergy ensures each hardware leap amplifies software monetization, weaving dense network effects throughout the Metaverse in gaming market.


By Technology: Blockchain Disruption Reshapes Economics
AR and VR technologies held 48.08% revenue in 2025, providing the sensory bedrock of Metaverse in the gaming market. Hi-res micro-OLED panels, foveated rendering, and spatial audio deepen presence, while machine-learning super-sampling sustains 90 fps on mid-range GPUs. Blockchain is the fastest climber at a 64.13% CAGR, recasting digital commodities into tradable assets.
The Six Dragons lets players mint swords as NFTs and port them across chains. Inworld AI supplies conversational non-player characters that recall prior chats and evolve storylines. Together these forces blend to expand Metaverse in gaming market size for tokenized worlds while enriching immersion.
By Game Genre: RPG Narratives Drive Deeper Engagement
Action shooters dominated revenue with 23.18% share in 2025 through fast loops and franchise loyalty. Yet role-playing games grow at 14.02% CAGR as players chase evolving story arcs and cross-platform progression.
Love and Deepspace passed USD 500 million via romance-fused boss fights, with some users spending over USD 10,000 to augment virtual relationships. Metamon couples’ governance tokens with character levelling, marrying game design and decentralized finance. Simulation, sports, and strategy keep niche appeal, profiting from modular engine templates that shorten build times.
By Platform: Mobile Accessibility Leads, Cloud Streaming Surges
Smartphones delivered 50.25% revenue in 2025, making mobile the prime on-ramp to the Metaverse in gaming market. Integrated cameras and LiDAR enable AR quests without extra gear. HypeHype lets users remix levels on phones in minutes. Cloud streaming leaps ahead at 16.42% CAGR as server-side rendering frees players from GPU upgrades; cross-progression then lets a hero levelled on mobile resume a 4K PC dungeon that night.
PC maintains high-fidelity leadership via modding communities and esports, while consoles offer curated exclusives with tactile controllers. Mixed reality’s see-through overlays will fuse physical and digital play, expanding the Metaverse in gaming industry’s reach beyond core gamers.
Geography Analysis
North America generated 38.27% of the Metaverse gaming market revenue in 2025. Robust discretionary income, deep venture pools, and early headset launches underpin the region’s lead. Meta Reality Labs grew hardware sales 40% year-on-year, and Vision Pro installed half a million units at premium pricing. Disney’s Epic Games partnership embeds Marvel and Star Wars IP into open-ended worlds, while NVIDIA’s USD 3.34 trillion valuation highlights semiconductor leverage.
Asia-Pacific posts the fastest rise with a forecast 12.32% CAGR through 2031. China unveiled more than 100 provincial VR hubs that pair tourism IP with advanced tracking. Japan’s VRChat accounts for 2.5 million of its 10 million monthly users, confirming cultural resonance. India is on track to add 250 million new gamers by 2029 as low-cost 5G data unleashes mobile AR experiences. Regional publishers aggressively adapt local folklore into blockchain MMORPGs, giving the Metaverse in the gaming market an indigenous flavor.
Europe retains a significant slice thanks to premium console ownership and strong indie studios. The Digital Services Act enforces content safety, compelling platforms to invest in compliance engineering. A new virtual-worlds roadmap mandates sustainable development alignment, possibly slowing speed-to-market yet boosting consumer trust. Long-term, balanced regulation may underpin steady Metaverse in gaming market growth across the bloc.

Competitive Landscape
The field is moderately concentrated. Meta, Sony, Apple, and HTC capture the bulk of headset volumes, with Meta alone holding 73% shipments. Epic Games and Unity dominate engine middleware with contrasting royalty and subscription models. Roblox and Decentral and lead creator ecosystems, while Animoca Brands bankrolls dozens of Web3 studios.
Strategic coalitions swell: Disney-Epic for entertainment crossovers; LVMH-Epic so luxury avatars can try couture; Walmart-Unity enabling in-world checkout. NVIDIA and Microsoft co-develop neural shading, slashing power demand for ray tracing. SharpLink Gaming spent USD 463 million on Ether to bankroll sports metaverse tokens, underlining capital intensity. Genies and Liminal Experiences raise fresh funds for AI avatar toolkits, challenging incumbents with user-first pipelines.
This contest of walled-garden ecosystems versus open-chain worlds drives continual feature leaps, keeping the Metaverse in the gaming market vibrant yet unpredictable.
Metaverse In Gaming Industry Leaders
Meta Platforms Inc.
Microsoft Corporation
Sony Group Corporation
Tencent Holdings Ltd.
Roblox Corporation
- *Disclaimer: Major Players sorted in no particular order

Recent Industry Developments
- June 2025: SharpLink Gaming acquires 176,271 ETH for USD 463 million to fuel sports metaverse expansion.
- May 2025: Roblox rolls out Shopify checkout, bridging virtual play and physical retail.
- April 2025: FTC files child-privacy complaint against Meta’s Horizon Worlds.
- April 2025: Genies unveils AI avatar toolset, enabling granular customization.


Research Methodology Framework and Report Scope
Market Definitions and Key Coverage
Our analysis defines the metaverse in gaming market as all value generated when interactive game worlds merge with persistent, networked 3-D spaces and players engage through connected hardware (VR, AR, MR headsets and ancillary gear) plus enabling software and services that let avatars socialize, trade, and compete in real time.
Scope Exclusions: Revenues from enterprise-only collaboration platforms and purely social virtual spaces that lack game mechanics are not included.
Segmentation Overview
- By Component
- Hardware
- VR Headsets
- AR Headsets
- MR Headsets
- Other Hardware
- Software
- Hardware
- By Technology
- AR and VR
- Mixed Reality (MR)
- Blockchain
- Artificial Intelligence
- Other Technologies
- By Game Genre
- Action
- Adventure
- Role-Playing Games
- Simulation
- Sports and Racing
- Other Genres
- By Platform
- Mobile
- PC
- Console
- Cloud / Streaming
- North America
- By Geography
- North America
- United States
- Canada
- Mexico
- South America
- Brazil
- Argentina
- Rest of South America
- Europe
- United Kingdom
- Germany
- France
- Italy
- Spain
- Nordics
- Rest of Europe
- Middle East and Africa
- Middle East
- Saudi Arabia
- United Arab Emirates
- Turkey
- Rest of Middle East
- Africa
- South Africa
- Egypt
- Nigeria
- Rest of Africa
- Middle East
- Asia-Pacific
- China
- India
- Japan
- South Korea
- ASEAN
- Australia
- New Zealand
- Rest of Asia-Pacific
- North America
Detailed Research Methodology and Data Validation
Primary Research
Mordor analysts interview hardware OEM product leads, blockchain-game founders, esports organizers, and immersive content studios across North America, Europe, and Asia-Pacific. These guided discussions validate volume assumptions, typical average selling prices, user-migration patterns, and monetization mechanics that rarely surface in public filings.
Desk Research
We start by mapping the universe through widely accessible tier-1 sources such as GSMA Intelligence for 5G rollout statistics, UN Comtrade customs data for headset shipments, World Bank digital adoption indices, Entertainment Software Association gamer demographics, and patent counts extracted via Questel. Company filings, investor decks, and respected technology media enrich pricing and adoption cues. This mosaic lets our team flag structural parameters before any model build.
A secondary sweep then draws on interactive dashboards from D&B Hoovers, Dow Jones Factiva news archives, and regional trade associations to benchmark publisher revenues, wallet creation rates, and regulatory developments that may accelerate or restrain uptake. The sources cited here illustrate our approach; many additional references underpin the dataset compilation.
Market-Sizing & Forecasting
A top-down demand-pool reconstruction uses headset production and trade flows, active wallet counts, monthly active users for leading titles, 5G subscriber growth, and average in-game spend to size 2024 and 2025. Results are cross-checked through selective bottom-up supplier roll-ups and channel price scans to refine totals. Forecasts to 2030 rely on a multivariate regression blended with ARIMA trend extension where variables such as headset ASP shifts, NFT transaction velocity, and mobile cloud-streaming latency improvements carry weighted coefficients. When bottom-up gaps appear, proxy metrics like hours-played per user bridge the shortfall before final calibration.
Data Validation & Update Cycle
Outputs move through anomaly screens, senior-analyst peer review, and variance checks against independent benchmarks. Reports refresh each year, with interim revisions triggered by material events like a headset price shock or regulatory pivot. Right before delivery, an analyst reruns the model so clients always receive the latest perspective.
Why Our Metaverse In Gaming Baseline Is Dependable
Published estimates often diverge because firms frame the metaverse differently, apply varied device scopes, or refresh numbers on uneven cadences.
Key gap drivers include whether console GPU sales and speculative NFT resales are bundled into market revenue, how aggressively token inflation is projected, and the cadence at which new headset ASPs are rolled forward. By centering on playable game environments, validated hardware flow, and conservative monetization ratios, Mordor Intelligence provides a balanced, decision-ready baseline.
Benchmark comparison
| Market Size | Anonymized source | Primary gap driver |
|---|---|---|
| USD 25.67 B (2025) | Mordor Intelligence | - |
| USD 34.71 B (2025) | Regional Consultancy A | Adds play-to-earn token trading and secondary NFT resale values |
| USD 67.53 B (2025) | Global Consultancy B | Bundles gaming PCs, standalone GPUs, and generic cloud-gaming subscriptions |
| USD 23.89 B (2024) | Trade Journal C | Counts only VR hardware revenue, excluding blockchain-enabled game economies |
These contrasts show that scope breadth and input discipline meaningfully shift totals. By keeping definitions transparent, variables traceable, and refresh cadence tight, Mordor Intelligence delivers the most reliable compass for planners navigating the fast-moving metaverse gaming arena.


Key Questions Answered in the Report
What is the size of the Metaverse in gaming market today?
The market is valued at USD 35.39 billion in 2026 and is projected to reach USD 176.15 billion by 2031 at a 37.85% CAGR over 2026-2031.
Which region grows the fastest in the Metaverse in gaming market?
Asia-Pacific is forecast to expand at a 12.32% CAGR through 2031 over 2026-2031 thanks to large mobile-first gamer populations, affordable 5G access, and expansive government XR projects.
What fuels the rapid rise of the Metaverse in gaming market?
Lower-cost VR/AR hardware, ubiquitous 5G, tokenised asset ownership, and multibillion-dollar investments from brands such as Disney, NVIDIA, and LVMH are the primary growth engines.
How dominant is mobile within the Metaverse in gaming market?
Mobile platforms commanded 50.25% revenue in 2025, making smartphones the leading entry point for immersive experiences until standalone devices become broadly affordable.
Why is blockchain critical for the Metaverse in gaming industry?
Blockchain lets players truly own and trade in-game items across multiple titles, unlocking new revenue streams and sustaining persistent in-world economies.
What main challenges could slow adoption?
High headset prices in emerging markets and stricter data-privacy regulations in North America and Europe are the leading headwinds for near-term expansion.
Page last updated on:


