
Market Overview
| Study Period | 2020 - 2031 |
|---|---|
| Market Size (2026) | USD 7.59 Billion |
| Market Size (2031) | USD 12.86 Billion |
| Growth Rate (2026 - 2031) | 11.12 % |
| Fastest Growing Market | Asia Pacific |
| Largest Market | North America |
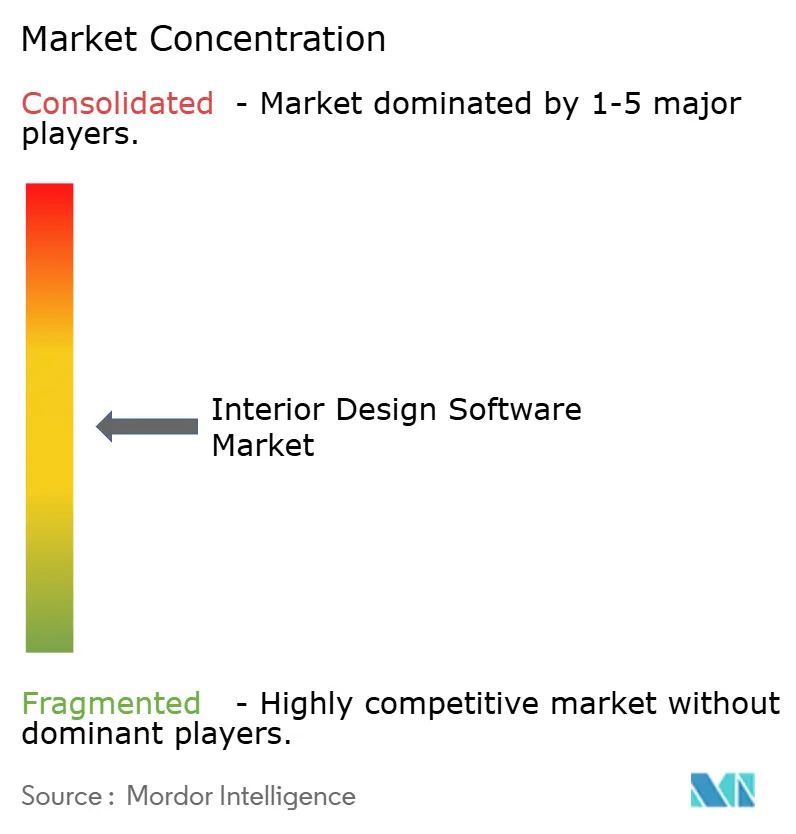
| Market Concentration | Medium |
Major Players *Disclaimer: Major Players sorted in no particular order Image © Mordor Intelligence. Reuse requires attribution under CC BY 4.0. | |
Interior Design Software Market Analysis by Mordor Intelligence
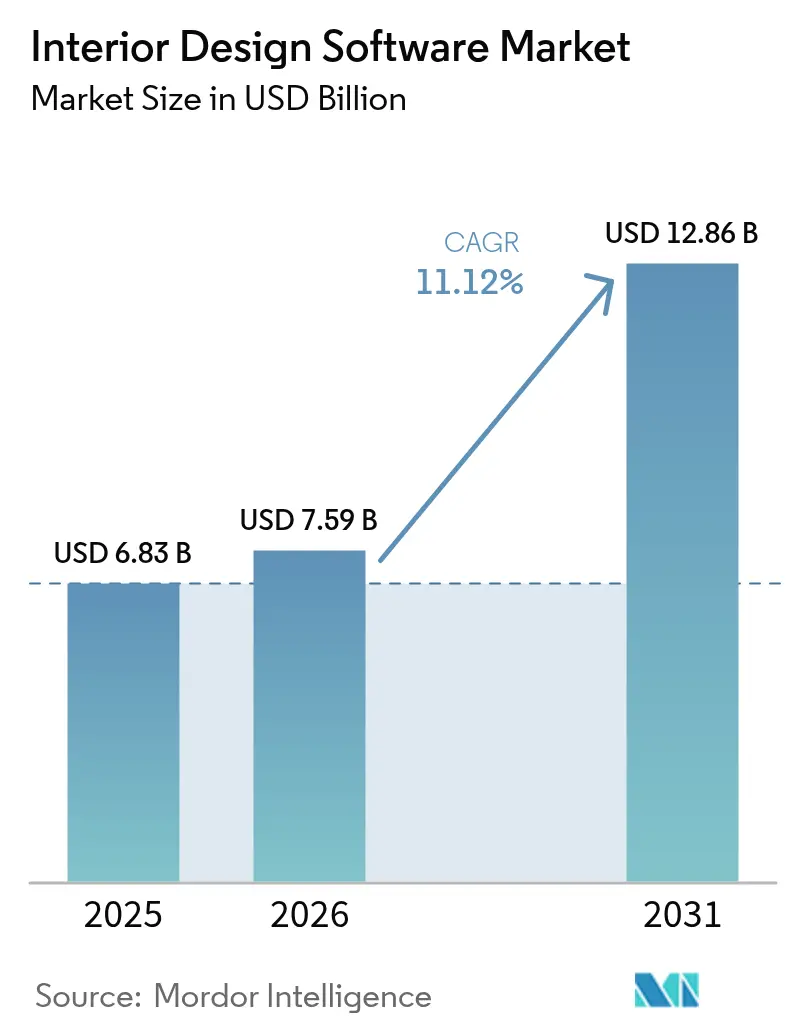
The interior design software market size was valued at USD 6.83 billion in 2025 and estimated to grow from USD 7.59 billion in 2026 to reach USD 12.86 billion by 2031, at a CAGR of 11.12% during the forecast period (2026-2031). Momentum is fueled by the convergence of artificial intelligence, cloud computing, and immersive visualization that is redefining concept development, collaboration, and client engagement across the design value chain. Post-COVID remote-work norms are solidifying cloud workflows that connect distributed teams, while falling GPU-render costs are democratizing photorealistic visualization. Integration of BIM workflows into interior design platforms is creating new competitive advantages as project stakeholders adopt ISO 19650–compliant information management. The interior design software market is therefore moving from discrete point solutions toward unified, lifecycle-centric ecosystems that bundle 3D modeling, data-rich BIM objects, real-time collaboration, and cloud-native rendering.
Key Report Takeaways
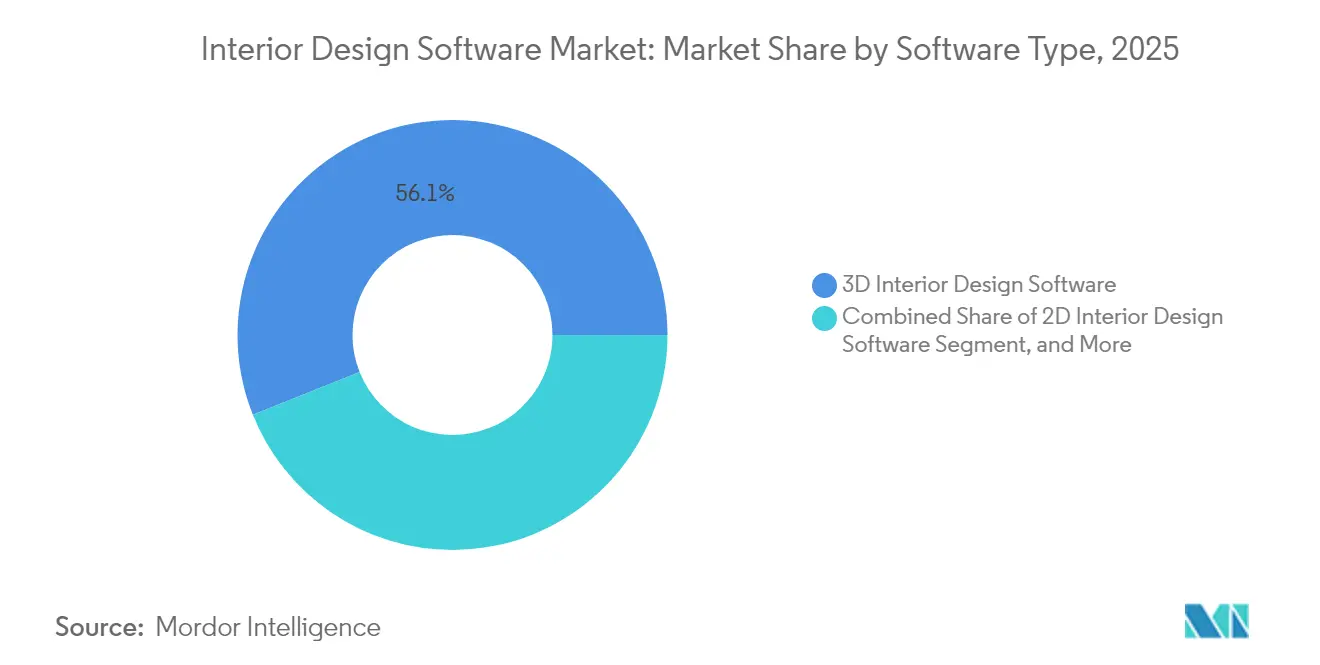
- By software type, 3D Interior Design Software led with 56.05% of the interior design software market share in 2025. VR/AR-Ready Design Platforms are advancing at a 12.1% CAGR through 2031.
- By deployment mode, on-premises solutions held 63.05% of the interior design software market size in 2025, while cloud platforms are expanding at a 12.31% CAGR.
- By end user, Interior Designers and Architects commanded 63.02% of demand in 2025 in the interior design software market, whereas residential end-users are rising at a 12.18% CAGR through 2031.
- By application, Residential commanded 52.55% of demand in 2025 in the interior design software market, and commercial projects accounted for a 12.05% CAGR between 2026 and 2031, overtaking overall market growth.
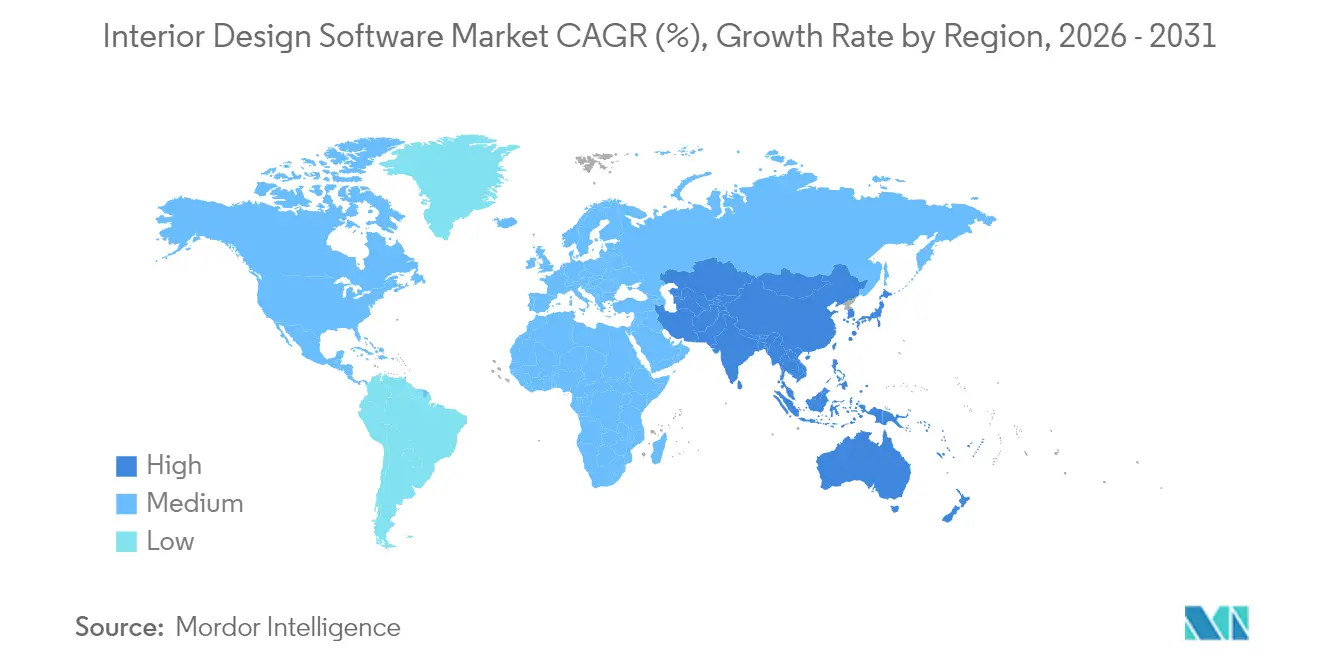
- By Geography, North America captured 38.10% revenue share in 2025 in the interior design software market; Asia Pacific is projected to climb at an 11.55% CAGR to 2031.
- Autodesk, Nemetschek, and Dassault Systèmes collectively accounted for 42% of the interior design software market share in 2024.
Note: Market size and forecast figures in this report are generated using Mordor Intelligence’s proprietary estimation framework, updated with the latest available data and insights as of 2026.
Market Trends and Insights
Drivers Impact Analysis of Interior Design Software Market*
| Driver | (~) % Impact on CAGR Forecast | Geographic Relevance | Impact Timeline |
|---|---|---|---|
| Adoption of BIM-integrated interior design workflows | +2.8% | Global, with strongest uptake in North America and Europe | Medium term (2-4 years) |
| Rising demand for photorealistic visualization in e-commerce and VR showrooms | +2.1% | Global, led by North America and Asia Pacific | Short term (≤ 2 years) |
| Surge in remote collaboration needs among distributed design teams post-COVID-19 | +1.9% | Global | Short term (≤ 2 years) |
| Drop in GPU cloud-render costs enabling SaaS-based rendering services | +1.7% | Global, with early adoption in developed markets | Medium term (2-4 years) |
| AI-powered generative design accelerating concept iteration cycles | +2.2% | North America and Europe initially, expanding to Asia Pacific | Medium term (2-4 years) |
| Growing smart home renovation spend from millennial homeowners | +1.8% | North America and Europe primarily | Long term (≥ 4 years) |
| Source: Mordor Intelligence | |||


Adoption of BIM-Integrated Interior Design Workflows
Mandatory BIM standards and client demand for coordinated data are pushing designers toward platforms that handle geometry and information in a single environment. A 2025 Vectorworks survey showed 68% of AEC professionals already use BIM and 65% see the highest ROI from it.[1]Vectorworks, “AEC Trends 2025,” vectorworks.net Singapore’s regulations now require 3D BIM submissions for certain projects, accelerating adoption across Asia.[2]BIM Singapore, “Guide to Purchasing BIM Software 2025,” bim.com.sg Vendors are responding by embedding ISO 19650-ready data structures, automated clash detection, and cloud-based CDEs inside their interiors modules. Competitive positioning now hinges on seamless hand-off between schematic design, documentation, and facilities management. Smaller providers such as Bricsys lean on cost-effective licensing to lure firms upgrading from 2D CAD. Collectively, these forces add 2.8 percentage points to forecast CAGR as platform upgrades become unavoidable for code compliance and client retention.
Rising Demand for Photorealistic Visualization in E-Commerce and VR Showrooms
Furniture retailers and residential clients increasingly expect 4K renders and VR walk-throughs before approving purchases or layouts. Cloud2Render charges between USD 1.08 and USD 6.48 per GPU-hour, enabling small firms to deliver Hollywood-grade imagery without hardware purchases. Virtual staging has shortened home-sale cycles by 87% and lifted prices by 15% according to Interior AI, demonstrating direct ROI for visualization spend. AiHouse claims to produce 4K renders in under three minutes, reducing iteration time and designer effort.[3]AiHouse Inc., “AI-Powered 3D Interior Design Software,” aihouse.com As e-commerce embeds room-view configurators, visualization quality influences conversion rates, driving software upgrades that support ray-traced lighting and material realism. This trend adds 2.1 percentage points to CAGR and accelerates the shift toward SaaS rendering.
Surge in Remote Collaboration Needs Among Distributed Design Teams Post-COVID-19
Permanent hybrid work arrangements now require platforms that offer version control, role-based permissions, and live mark-up sessions. Houzz rolled out Team Chat and Voice-Over-Notes in 2025 to serve firms managing multiple concurrent projects. Autodesk Docs integrates mark-ups directly into AutoCAD and Revit sessions, minimizing file friction. Seamless co-editing improves client approval cycles, mitigates rework, and supports global talent sourcing. Security enhancements such as SSO and enterprise data encryption from providers like Vizcom have answered IT objections, lifting barrier removal to adoption.[4]Vizcom, “Security and Privacy,” vizcom.ai Collaboration drivers now contribute 1.9 percentage points to market CAGR by tipping conservative firms toward cloud subscriptions.
Drop in GPU Cloud-Render Costs Enabling SaaS-Based Rendering Services
Intense hyperscaler competition and utilization-optimized orchestration have cut cloud-GPU pricing by nearly 40% since 2023. Vagon offers on-demand high-memory GPU instances with pay-as-you-go billing, eliminating queues and removing on-premises farm upkeep. Cost parity with local workstations has nudged mid-size practices toward cloud and freed budgets for premium software licenses. Vendors now bundle on-click cloud render buttons, shielding users from infrastructure complexity and ensuring predictable billing. These economics inject 1.7 percentage points into forecast CAGR and reinforce subscription growth.
Restraints Impact Analysis of Interior Design Software Market*
| Restraint | (~) % Impact on CAGR Forecast | Geographic Relevance | Impact Timeline |
|---|---|---|---|
| High learning curve and training costs for professional-grade suites | -1.6% | Global, with higher impact in emerging markets | Medium term (2-4 years) |
| Piracy and availability of low-cost cracked software in developing regions | -1.2% | Primarily Asia Pacific, South America, and parts of MEA | Long term (≥ 4 years) |
| Limited interoperability between legacy CAD formats and modern 3D engines | -0.9% | Global, with strongest impact in North America and Europe | Medium term (2-4 years) |
| Data-privacy concerns in cloud-hosted project files for enterprise clients | -0.8% | Global, with emphasis on North America and Europe | Short term (≤ 2 years) |
| Source: Mordor Intelligence | |||
High Learning Curve and Training Costs for Professional-Grade Suites
Vectorworks research identifies lack of structured training as the top barrier to digital-tool adoption. Advanced suites now bundle parametric modeling, BIM tagging, and cloud collaboration, which require sustained learning investments. In AR/VR workflows, 50% of early adopters reported hardware purchases and scope revisions before realizing benefits. Smaller studios in emerging markets are deterred by subscription costs plus training outlays, slowing upgrade cycles and trimming 1.6 percentage points from CAGR. Vendors respond with contextual tutorials, AI-driven command suggestions, and tiered user interfaces to lower learning thresholds.
Piracy and Availability of Low-Cost Cracked Software in Developing Regions
Unlicensed downloads remain prevalent where legal enforcement is lax and software costs represent high proportions of operating expenses. Graphisoft warns that pirated copies lack updates, contain malware, and cannot access cloud services, yet the immediate cost advantage still tempts many users. Subscription models that depend on online validation mitigate some risk, but perpetual versions remain vulnerable. Piracy clips 1.2 percentage points from forecast CAGR, particularly in Asia Pacific, Latin America, and the Middle East, until cloud-dependent functionality becomes indispensable.
*Our forecasts treat driver/restraint impacts as directional, not additive. The impact forecasts reflect baseline growth, mix effects, and variable interactions.
Interior Design Software Market Segment Analysis
By Software Type:
3D Platforms Drive Market Evolution3D Interior Design Software accounted for 56.05% of the interior design software market share in 2025, illustrating the decisive shift from line-based drafting toward immersive spatial modeling. VR/AR-Ready Design Platforms, projected to expand at a 12.1% CAGR, reflect rising client demand for walk-through experiences that de-risk design choices. The interior design software market size attributed to BIM-enabled suites is expected to grow steadily through 2031 as regulatory mandates accelerate adoption of data-rich models. AI-powered generative design further differentiates platforms, with AiHouse offering 4K renders in under three minutes. Legacy 2D applications retain niche relevance for documentation but now often serve as downstream outputs generated automatically from 3D or BIM models, underscoring the convergence of capabilities under single user interfaces.
Competitive positioning hinges on rendering quality, library breadth, and interoperability with manufacturing systems. Dassault Systèmes’ CATIA R2025x introduces mixed-reality interaction and a Stellar Interactive Rendering Engine that bolsters photorealism and collaboration [3DS.COM]. Dassault’s push signals an arms race toward real-time, device-agnostic visualization that transforms client presentations into immersive decision sessions. Smaller challengers court cost-sensitive markets with modular feature sets, while incumbents leverage ecosystems of plugins and certified content to lock in professional users. The long-run trajectory suggests deeper fusion of BIM data, AI layout generation, and cloud streaming, positioning 3D platforms as the operating system for interior space creation.


By Deployment Mode:
Cloud Migration Accelerates Despite Security ConcernsOn-premises deployments commanded 63.05% of revenue in 2025, yet cloud offerings are climbing at a 12.31% CAGR as firms weigh scalability and update convenience against data-sovereignty concerns. Cloud transitions are most rapid among mid-size practices that lack IT staff; automatic patching and elastic rendering offset fears of downtime. Vendors are closing security gaps through zero-trust architectures, audit logging, and compliance frameworks aligned to ISO 19650. Vizcom markets AES-256 encryption, VPC isolation, and SSO links with Azure AD and Okta to reassure enterprise buyers. Autodesk and Nemetschek’s revenue reports show subscription portfolios outpacing perpetual licenses, signaling irreversible momentum toward recurring cloud-based monetization.
Hybrid configurations are emerging as compromise models, with large firms hosting confidential assets on-premises while synchronizing lightweight proxies to cloud for visualization and mark-up. Cloud render farms slash design iteration lead times, and AI features often depend on server-side inference, nudging laggard firms across the adoption line. The interior design software market therefore experiences a gradual but firm pivot to SaaS, unlocking data analytics and usage-based pricing that were impossible under local installs.
By End User:
Professional Services Lead Market ExpansionInterior Designers and Architects generated 63.02% of 2025 demand, confirming that specialist knowledge underpins the software’s value proposition. These professionals exploit parametric controls, BIM coordination, and project-management integrations to maximize billable efficiency and reduce field revisions. Residential DIY users form the fastest-growing segment at a 12.18% CAGR, aided by AI-driven interfaces that hide complexity behind consumer-friendly wizards. For instance, Interior AI offers virtual staging outputs in minutes at commodity price points, widening the addressable base of users.
Furniture retailers and real-estate developers adopt platforms for configurators, marketing renders, and sales engagement. Houzz’s Pro suite bundles CRM and payment gateways with design visualization, demonstrating the blurring lines between design, procurement, and client management. As use cases diversify, vendors tailor tiered packages, from free consumer versions with watermark limitations to enterprise licenses featuring API access and governance controls. Over the forecast period, professional segments will maintain revenue dominance, but democratized tooling ensures that non-professionals increasingly influence feature roadmaps and interface simplification.

By Application:
Commercial Segment Drives Growth AccelerationResidential projects retained 52.55% share in 2025, buoyed by rising renovation budgets and millennials’ tech expectations. The interior design software market size attached to commercial spaces, however, is projected to accelerate at a 12.05% CAGR as workplaces, hospitality venues, and retail stores upgrade post-pandemic layouts. Commercial stakeholders prioritize BIM compliance, clash detection, and multi-disciplinary coordination, supporting higher average transaction sizes and long-term subscription commitments. U.S. home renovation outlays reaching USD 463 billion in Q1 2024 underpin stable residential demand.
Hospitality owners leverage immersive visualization to differentiate guest experiences, while healthcare and education facilities require layout adaptability and infection-control modeling. Vendors respond with sector-specific object libraries, regulatory templates, and environmental analysis plugins. Commercial growth thus becomes a catalyst for feature deepening in code analysis, asset tracking, and cross-team collaboration that later trickles down to residential tiers, reinforcing a virtuous innovation cycle.
Geography Analysis
North America Interior Design Software Market
North America led the interior design software market with 38.10% share in 2025, underpinned by mature renovation ecosystems, high technology penetration, and BIM-centric regulatory frameworks. Harvard JCHS data recorded USD 463 billion in U.S. renovation spending during Q1 2024, while 93% of homeowners hired professionals, sustaining software subscriptions that facilitate contractor collaboration. Cloud adoption, already mainstream, is set to deepen as vendors bundle AI drafting tools that are exclusively server-side. The region’s growth outlook also benefits from millennial home-equity gains and integration of smart-home devices requiring sophisticated space planning.
APAC Interior Design Software Market
Asia Pacific posts the fastest regional CAGR at 11.55% through 2031, driven by urbanization and local policy pushes for digital construction. Indian provider MicroGenesis logged INR 235 crore (USD 28.3 million) revenue while partnering with Nemetschek, illustrating the appetite for international platforms adapted to regional codes. China’s modernization of construction workflows and Southeast Asia’s infrastructure spend create fertile conditions for BIM-ready interior software. Subscription models priced in local currencies and localized content libraries are accelerating penetration among small studios lacking capital for perpetual licenses.
EMEA Interior Design Software Market
Europe offers steady expansion anchored by ISO 19650 adoption and sustainability mandates. Nemetschek’s 13.1% Design-segment revenue growth in 2024 underscores compliance-driven demand. Multilingual workflows and energy-performance modules are decisive purchase criteria as EU directives tighten carbon-footprint reporting. Meanwhile, Middle East and Africa witness budding opportunities tied to smart-city initiatives, though currency volatility and patchy internet access temper near-term uptake. Vendors pursuing these markets invest in offline-capable clients and regional cloud data centers to satisfy compliance and latency expectations. Collectively, geography patterns indicate convergence toward cloud BIM ecosystems, with local adaptations defining competitive edges.

Regulatory Landscape
Interoperability and model-based delivery requirements are increasingly tied to formal standards that influence interior design software feature roadmaps, especially where interiors tools intersect with BIM deliverables. ISO 16739-1:2024 (IFC) and buildingSMART guidance around Model View Definitions (MVDs) support open data exchange, while the National BIM Standard-United States (NBIMS-US) remains a common reference for structured BIM information practices. These frameworks reinforce demand for ISO 19650-aligned information management, IFC export/import fidelity, and audit-friendly metadata handling across design, visualization, and collaboration modules.
Public-sector and national mandates also add jurisdiction-specific compliance requirements that filter into commercial procurement. In the United States, agency and owner standards, including requirements used by the Port Authority of New York and New Jersey and the City of Seattle, formalize BIM/VDC expectations for project delivery. In Europe, Act No. 330/2025 in the Czech Republic mandates that obliged entities acquire and maintain construction information models in common data environments using uniform national construction data standards published by the Office for Technical Standardisation, Metrology and State Testing, which increases CDE readiness and standardized data structures. For AI-enabled design functions, the European Council provisional political agreement on the AI Omnibus (May 2026) adjusted the EU AI Act compliance timeline, and Directive (EU) 2024/2853 (Product Liability Directive) becomes applicable in December 2026 and explicitly treats software as a product, raising the emphasis on traceability, documentation, and risk controls around AI-assisted outputs.
Competitive Landscape
The interior design software market displays moderate concentration. Autodesk, Nemetschek, and Dassault Systèmes together secured 42% revenue in 2024, enabled by broad portfolios, global channels, and robust R&D budgets. Autodesk logged USD 6.13 billion total revenue in 2025 and continues folding AI and cloud modules across AutoCAD and Revit, shielding its installed base from challenger erosion. Nemetschek’s 88.1% subscription revenue rise signals successful migration from perpetual licensing, reducing churn and financing new cloud services.
Strategic thrusts focus on AI augmentation, BIM compliance, and immersive visualization. Dassault’s CATIA R2025x release merges mixed-reality interfaces with rendering-engine upgrades, underscoring the experiential battleground. Niche vendors differentiate through vertical specialization; AiHouse courts manufacturing-linked workflows, while Houzz Pro integrates customer-relationship features for small contractors. Market entry barriers stem from expensive 3D kernel development and certification for standards like ISO 16739-1 IFC, limiting the threat of new entrants. However, open-source 3D engines and cloud platforms may lower technical hurdles over time, intensifying price competition.
Interoperability friction remains an unresolved pain point. Legacy CAD formats often require proprietary translators, causing data loss and user frustration. Vendors aim to standardize on open IFC schemas, yet competitive agendas slow full alignment. Security, particularly for cloud-hosted models, is now a differentiator as corporate IT scrutinizes SOC-2 reports and VPC isolation. Overall, rivalry will likely intensify around platform completeness, AI-driven productivity, and ecosystem lock-in rather than purely on license pricing.
Interior Design Software Industry Leaders
Dassault Systemes SE
Trimble Inc.
SmartDraw Software, LLC
Autodesk, Inc.
Foyr Pte. Ltd.
- *Disclaimer: Major Players sorted in no particular order
Interior Design Software Market Companies Covered in this Report
- Autodesk, Inc.
- Dassault Systèmes SE
- Nemetschek SE
- Trimble Inc.
- Chief Architect, Inc.
- Cyncly AS
- SketchUp Inc.
- Bentley Systems, Incorporated
- SmartDraw Software, LLC
- RoomSketcher AS
- Planner 5D UAB
- Cedreo SAS
- Infurnia Technologies Private Limited
- Foyr Pte. Ltd.
- Homestyler, Inc.
- Asynth SAS
- Microvellum, Inc.
- Vectorworks, Inc.
- Floorplanner NV
- Live Home 3D LLC
- eTeks (Sweet Home 3D)
- Morpholio LLC
- Nova Development Corp.

Market Opportunities and Future Outlook
Product direction in 2026 points to whitespace in AI-native workflows that reduce the skill barrier for 3D and BIM-adjacent interior design tasks while keeping professional governance in place. Homestyler announced Homestyler V6.0 (April 2026) with a unified AI Studio that combines 3D design, AI generation, and collaboration, while Planner 5D launched an AI Studio workflow (June 2026) to take users from concept creation through rendering within one environment. Core AI launched HomeGPT (June 2026), using multimodal inputs such as a single photo to generate home design concepts, which supports continued expansion of consumer and prosumer creation tools that can be monetized through entry tiers, upgraded libraries, and collaboration features.
Real-time visualization is another near-term opportunity for both residential and commercial stakeholders, supported by tighter rendering integrations and cloud delivery. Vectorworks released Vectorworks 2026 Update 4 (March 2026) and separately announced commercial availability of Maxon Redshift for Vectorworks (March 2026), extending purpose-built real-time rendering deeper into interior design workflows and lifting baseline expectations for interactive, photoreal output without dedicated render-farm expertise. As platforms converge around unified modeling, BIM information handling, and visualization, differentiation increasingly hinges on interoperability (IFC/NBIMS-aligned exchange), security and governance for cloud collaboration, and workflow connectors that bridge design to procurement, configuration, and downstream project delivery.
Recent Industry Developments in Interior Design Software Market
- April 2026: Trimble announced an integration linking SketchUp with Anthropic Claude, enabling conversational creation and modification of 3D models via text or speech using the Model Context Protocol. The update targets faster concept iteration and lowers the barrier to 3D modeling for time-constrained design teams, which reinforces SketchUp positioning as AI features become a baseline in design platforms.
- June 2025: Dassault Systèmes signed a five-year partnership with BoConcept to embed HomeByMe 3D space planning and product configuration into BoConcepts customer buying journey across 65 countries. By tying visualization to a global retail workflow, the partnership expands configurator-driven use cases and increases the role of curated product libraries and seamless omnichannel experiences.
- February 2025: Dassault Systèmes subsidiary Centric Software agreed to acquire Contentserv for an enterprise value of EUR 220 million to add PIM/PXM capabilities. The deal strengthens the link between design content, product information, and downstream commerce execution, reinforcing platform strategies that connect interior planning, configuration, and fulfillment data.


Interior Design Software Market Report Scope and Research Methodology
Market Definition and Coverage
This market is defined as revenue earned from software used to plan, visualize, and document interior spaces, including 2D or 3D layouts, rendering, material libraries, and collaboration features sold to professionals and individual users.
Scope exclusions: We exclude pure interior design services, general-purpose architectural CAD that is not sold or positioned for interior workflows, and hardware-only sales (such as scanners or headsets).
Segments Covered in This Report
- By Software Type
- 2D Interior Design Software
- 3D Interior Design Software
- BIM-Enabled Design Suites
- VR/AR-Ready Design Platforms
- By Deployment Mode
- On-premises
- Cloud-based
- By End User
- Interior Designers and Architects
- Furniture and Home Décor Retailers
- Real-Estate Developers and Builders
- DIY Homeowners
- Other End Users
- By Application
- Residential
- Commercial
- Hospitality
- Healthcare
- Education and Institutional
- Other Applications
- By Geography
- North America
- United States
- Canada
- Mexico
- South America
- Brazil
- Argentina
- Rest of South America
- Europe
- Germany
- United Kingdom
- France
- Italy
- Spain
- Russia
- Rest of Europe
- Asia Pacific
- China
- Japan
- India
- South Korea
- Australia
- Rest of Asia Pacific
- Middle East and Africa
- Middle East
- Saudi Arabia
- United Arab Emirates
- Turkey
- Rest of Middle East
- Africa
- South Africa
- Nigeria
- Rest of Africa
- Middle East
- North America
Data Sources, Market Sizing, and Validation
Desk Research
For desk research, we start by mapping the demand environment for interior projects and the supply environment for software. Public sources anchor where spend and adoption are moving, such as US Census Bureau construction and housing data, Eurostat building permits and housing statistics, World Bank macro indicators, and trade association releases tied to construction and remodeling activity.
We also review vendor websites, product documentation, press coverage, and investor materials to understand pricing models (subscription versus perpetual) and feature bundles that affect average revenue per user. A paid database subscription is used selectively for company financials and news to track product revenue commentary and corporate events that can shift reported sales. These examples are not exhaustive, and many other public sources were used for data collection, validation, and clarification.
Primary Interviews and Surveys
Primary work focused on interviews and short surveys with software providers, channel partners, interior designers, design studios, and commercial real estate stakeholders who influence purchasing. Respondent input was used to confirm adoption pace, typical contract size bands, renewal behavior, and how cloud deployments change active seat counts, with coverage across APAC, EMEA, and the Americas so one region did not dominate the final view.
Distribution of primary research fieldwork respondents
| Company type | Respondent position | Region |
|---|---|---|
| Top tier: 30% | CXOs: 14% | APAC: 47% |
| Mid tier: 55% | Functional/Unit leaders: 31% | EMEA: 32% |
| Smaller Players: 15% | Managers: 55% | Americas: 21% |
Market-Sizing & Forecasting
Sizing is built using the top-down method by reconstructing the addressable user pool from housing and commercial fit-out activity, then applying software penetration and spend intensity assumptions by buyer type. Results are corroborated with selective bottom-up approximations using sampled pricing by plan tier, typical seats per account, and channel feedback on deal volumes, which helps correct overcounts in fragmented user groups.
Key inputs used in the model include residential versus non-residential project mix, design firm and practitioner density, cloud subscription share, average seats per paid account, and the pace of price changes tied to bundled collaboration and rendering features. Where direct signals are weak, gaps are handled using regional comparables and then narrowed through interview-based ranges for adoption and replacement cycles.
For forecasting, scenario analysis is applied around housing starts, renovation spending, and commercial occupancy trends. The trajectory is then smoothed to reflect how renewals and seat expansions typically move year to year. Assumptions on penetration and pricing are only moved after they are re-checked with expert views collected during fieldwork.
Data Validation & Update Cycle
Validation is done by comparing model outputs with independent signals such as construction cycle indicators, subscription trend commentary available in public materials, and region-level adoption sentiment from interviews. When a variance is large, drivers are traced back to specific inputs, and the numbers are reviewed through a multi-step analyst check before sign-off.
The model is refreshed on an annual cycle, and interim updates are triggered when material events occur, such as pricing changes, acquisitions, or sharp shifts in demand for remodeling and commercial renovations. Before delivery, a final pass is completed so clients receive the most current view based on the latest available inputs.
Mordor Intelligence's Interior Design Software Market Size Versus Other Published Estimates
Published market values for interior design software often do not align because each publisher selects its own base year, scope boundaries, and approach to projecting subscription pricing. Differences also show up when modules like rendering and collaboration are bundled, since some methods treat these as separate add-ons and others assume they are included in a single plan.
Some estimates are anchored to earlier base years and then carried forward with a single growth rate, which can understate the recent shift toward cloud seats and renewal-led expansion. Others may group adjacent design tools into the same spend pool. Mordor Intelligence counts revenue only when it is directly tied to interior design software licenses or subscriptions, with services and unrelated CAD usage excluded, which can widen gaps versus broader spend definitions.
Benchmark comparison
| Source | Market Size | Gaps in Research Methodology |
|---|---|---|
| Mordor Intelligence | USD 7.59 B (2026) | |
| Global Consultancy A | USD 5.37 B (2024) | Anchored to 2024, which can understate the later uplift from cloud subscription mix and expanding seat counts. The figure can also differ if bundled plan pricing is applied with a flatter progression across regions. |
| Industry Research Group B | USD 4.32 B (2023) | Uses 2023 as the stated year, so level differences persist even if the CAGR looks similar later. Limited clarity on treatment of newer collaboration and visualization modules can shift average revenue assumptions across buyer types. |
Overall, the spread is mainly explained by the year used for the stated market size and by how subscription pricing and seat growth are handled during the transition to cloud-first plans. By keeping the scope tight to software revenue and cross-checking assumptions with adoption and pricing inputs, the final number stays traceable to practical drivers that can be reviewed and repeated.


Key Questions Answered in the Report
What is the current value of the interior design software market?
It is USD 7.59 billion in 2026, projected to climb to USD 12.86 billion by 2031.
How fast is the market expected to grow?
The market is forecast to register an 11.12% CAGR between 2026 and 2031.
Which software type holds the largest share?
3D Interior Design Software captured 56.05% of 2025 revenue.
Which region shows the strongest growth outlook?
Asia Pacific is set to expand at an 11.55% CAGR through 2031.
Who are the leading vendors?
Autodesk, Nemetschek, and Dassault Systèmes collectively account for 42% of revenue.
Page last updated on:


 Your data is secure and never sold or shared.


