
Unified Endpoint Management Market Size and Share
Market Overview
| Study Period | 2020 - 2031 |
|---|---|
| Market Size (2026) | USD 8.72 Billion |
| Market Size (2031) | USD 27.03 Billion |
| Growth Rate (2026 - 2031) | 25.38 % |
| Fastest Growing Market | Asia Pacific |
| Largest Market | North America |
| Market Concentration | Medium |
Major Players *Disclaimer: Major Players sorted in no particular order Image © Mordor Intelligence. Reuse requires attribution under CC BY 4.0. | |
Unified Endpoint Management Market Analysis by Mordor Intelligence
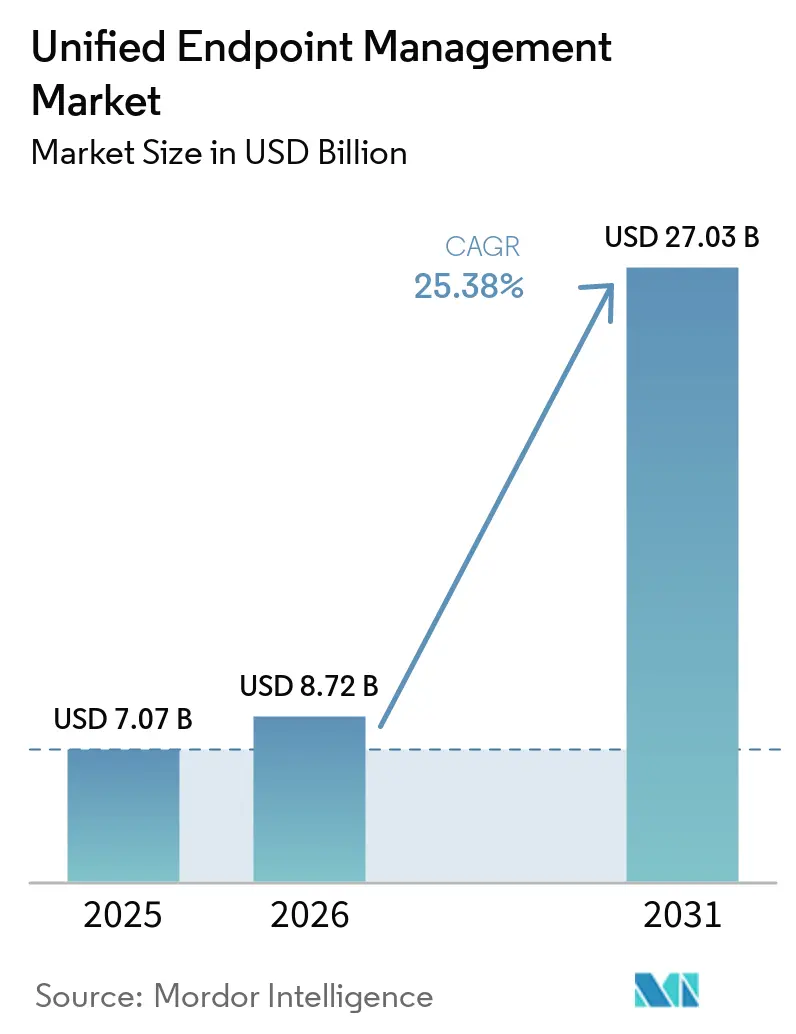
The unified endpoint management market size was valued at USD 7.07 billion in 2025 and estimated to grow from USD 8.72 billion in 2026 to reach USD 27.03 billion by 2031, at a CAGR of 25.38% during the forecast period (2026-2031). In 2026, the unified endpoint management market reflects strong enterprise demand for a single control layer across mobile devices, desktops, and cloud-managed endpoints. Growth is being supported by the need to manage endpoint security, identity rules, and day-to-day workflows through fewer tools. Hybrid work, tighter compliance expectations, and the spread of AI-enabled work are also increasing the number of devices and access points that enterprises must govern. Competitive activity is now centered on tighter links between endpoint data, identity controls, and automated remediation, which leaves clear room for vendors that can simplify deployment in regulated and legacy-heavy environments.
Key Report Takeaways
- By component, solutions held 66.78% share of the unified endpoint management market in 2025, while the same segment is projected to expand at a 26.14% CAGR through 2031 in the unified endpoint management market.
- By deployment mode, cloud accounted for 60.42% share of the unified endpoint management (UEM) market in 2025 and is expected to record the fastest CAGR at 26.45% through 2031.
- By organization size, large enterprises held 71.62% share of the UEM market in 2025, while SMEs are projected to expand at a 26.62% CAGR through 2031.
- By end-user industry, IT and Telecom accounted for 24.67% share of the unified endpoint management market in 2025, while healthcare is expected to record the highest CAGR at 26.07% through 2031.
- By geography, North America held 39.78% share of the unified endpoint management (UEM) market in 2025, while Asia-Pacific is projected to advance at a 26.68% CAGR through 2031.
Note: Market size and forecast figures in this report are generated using Mordor Intelligence’s proprietary estimation framework, updated with the latest available data and insights as of 2026.
Market Trends and Insights
Drivers Impact Analysis of Unified Endpoint Management Market*
| Driver | (~) % Impact on CAGR Forecast | Geographic Relevance | Impact Timeline |
|---|---|---|---|
| Security-First Digitization for Privileged, Confidential, and Regulated Workloads | +5.8% | Global | Short term (≤ 2 years) |
| Cloud-First Modernization of Client-Facing and Internal Workflows | +5.2% | Global | Medium term (2-4 years) |
| Continuing Hybrid Work in Law Firms and Professional Services | +4.7% | North America and Europe | Short term (≤ 2 years) |
| Rising Demand for AI-Assisted Knowledge Retrieval and Matter Workflow Automation | +4.1% | Global | Medium term (2-4 years) |
| Matter-Level Productivity Analytics and Digital Employee Experience Management | +2.8% | North America, spill-over to Europe | Medium term (2-4 years) |
| Client Portal Consolidation and Zero-Friction Cross-Office Collaboration | +2.3% | North America and Europe | Long term (≥ 4 years) |
| Source: Mordor Intelligence | |||
Security-First Digitization for Privileged, Confidential, and Regulated Workloads
Security has become the main buying trigger in the unified endpoint management market, rather than a secondary feature layered onto device control. Legal firms, financial institutions, and healthcare providers handle privileged, confidential, and regulated data, so endpoint compromise can quickly turn into litigation, privacy, or audit exposure. The American Bar Association's Formal Opinion 512 made vendor data handling review a professional obligation for lawyers, which raised the importance of governance around endpoint and AI tools.[1]American Bar Association, “Formal Opinion 512,” American Bar Association, americanbar.org That pressure is also lifting contract values because many buyers pair UEM with identity and access management so that policy, access, and audit controls are tied together. HCL BigFix received NIAP certification in July 2025, which strengthened its position in regulated and federal settings where security validation carries unusual weight.
Cloud-First Modernization of Client-Facing and Internal Workflows
Cloud deployments led the unified endpoint management market in 2025 and continue to push buying patterns toward faster rollouts and simpler remote coverage. Cloud agents reach distributed devices over standard protocols, which reduces the infrastructure burden that usually slows on-premises deployments. Once device management moves to the cloud, many organizations also review collaboration, VDI, intranet, and workflow tools on the same stack. That creates broader wallet-share opportunities for vendors with established platform portfolios inside the unified endpoint management market. Microsoft's 2026 expansion of advanced Intune capabilities into Microsoft 365 E3 and E5 bundles shows how vendors are using cloud UEM to widen platform adoption beyond endpoint control alone.[2]Microsoft Corporation, “Microsoft 365 Adds Advanced Microsoft Intune Solutions at Scale,” Microsoft Intune Blog, techcommunity.microsoft.com
Continuing Hybrid Work in Law Firms and Professional Services
Hybrid work in legal and professional services has become a durable operating model, and it keeps the unified endpoint management (UEM) market focused on endpoint-level enforcement. Matter walls and client confidentiality rules must be enforced on the device and the network, not only inside an application or document repository. The same professional obligations described by the American Bar Association have made governance around endpoint access and data handling harder to defer in legal environments. Home networks and personally owned devices can weaken those controls when they sit outside formal BYOD policies or routine monitoring. This makes conditional access, device health checks, and careful rollout planning essential, especially for senior users who expect more autonomy in how they work.
Rising Demand for AI-Assisted Knowledge Retrieval and Matter Workflow Automation
AI tools for research, document drafting, billing support, and workload coordination are expanding the number of endpoints and connected services that the UEM market must cover. This shift is exposing the limits of older client-server management models that were not designed for fast policy execution across mixed device and SaaS estates. ServiceNow expanded its Microsoft integration in May 2026 to extend AI agent governance across Agent 365, Microsoft Foundry, and Copilot Studio, which shows how governance is moving upward into the AI workflow layer. Tanium and ServiceNow also introduced ITOM AI Prime in May 2026 to connect real-time endpoint telemetry with more automated remediation workflows at enterprise scale. Vendors that can convert endpoint state into quick policy action are drawing stronger interest as enterprises expand AI usage.
Restraints Impact Analysis of Unified Endpoint Management Market*
| Restraint | (~) % Impact on CAGR Forecast | Geographic Relevance | Impact Timeline |
|---|---|---|---|
| High Integration Friction With Legacy Document, Billing, and Case Management Systems | -3.5% | Global | Short term (≤ 2 years) |
| Elevated Confidentiality, E-Discovery, and Data Residency Compliance Burden | -2.8% | North America and Europe | Medium term (2-4 years) |
| Billable-Hour Sensitivity and Slow Change Adoption Across Senior Legal Users | -2.2% | Global | Medium term (2-4 years) |
| AI Governance Risk in Privilege-Sensitive Knowledge Workflows | -1.8% | Global | Long term (≥ 4 years) |
| Source: Mordor Intelligence | |||
High Integration Friction with Legacy Document, Billing, and Case Management Systems
Integration friction remains the clearest brake on the unified endpoint management market in legal and professional services. Many firms still rely on document, billing, and case systems that were built before cloud-native architectures became standard. Connecting those estates to modern UEM platforms often requires custom middleware, long service engagements, and continuous maintenance after rollout. The result is that the organizations with the greatest endpoint risk often face the slowest path to full coverage in the unified endpoint management market. Mid-sized firms are especially exposed because they need stronger governance but often do not have large in-house integration teams.
Elevated Confidentiality, E-Discovery, and Data Residency Compliance Burden
The compliance burden around confidentiality, e-discovery, and data residency is also slowing parts of the UEM market. European buyers have to align device management with GDPR, while US legal organizations also work within state bar rules and American Bar Association guidance. Telemetry routing, encryption choices, and data retention rules can determine whether a cloud deployment is acceptable for a regulated client environment. Formal Opinion 512 requires lawyers to understand how AI and technology vendors handle data before adoption, which raises due diligence expectations around endpoint and workflow tools. These checks lengthen procurement cycles in regulated sectors, even when long-term demand remains firm.
*Our forecasts treat driver/restraint impacts as directional, not additive. The impact forecasts reflect baseline growth, mix effects, and variable interactions.
Unified Endpoint Management Market Segment Analysis
By Component:
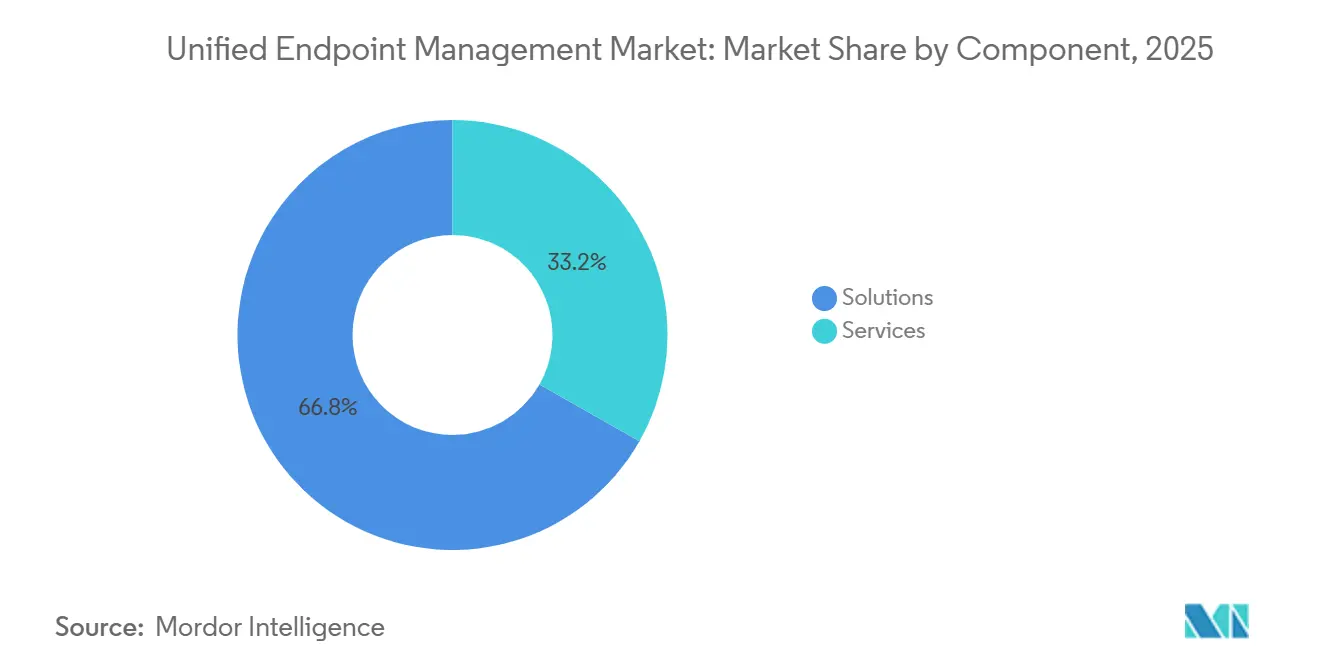
Solutions Platform Spending Dominates, Services Stay EmbeddedSolutions held 66.78% of unified endpoint management market share in 2025 and are projected to expand at a 26.14% CAGR through 2031. Enterprises favor consolidated platform licenses because they want fewer consoles, clearer policy enforcement, and more consistent coverage across device types. Within solutions, unified endpoint management and enterprise mobility management remain the most established areas of demand. Adjacent areas such as communication and collaboration, employee experience, intranet tools, workflow automation, and knowledge management are still moving through consolidation, which leaves room for acquisition and partnership activity in the unified endpoint management market.
Services remain embedded in the UEM industry because large deployments still need configuration, integration, and managed support. This is especially true when estates span multiple operating systems, geographies, and compliance rules. IBM added WatsonX-based policy recommendations to MaaS360 in 2025, which helps teams detect drift from STIG or HIPAA-aligned settings and suggests corrective steps.[3]IBM Corporation, “Policy Recommendations Powered by AI, How IBM MaaS360 Keeps You Ahead,” IBM Community, community.ibm.com Even with stronger automation, services demand stays resilient in the unified endpoint management market because regulated buyers still need change management, integration work, and ongoing governance.


By Deployment Mode:
Cloud Leads While On-Premises and Hybrid Stay RelevantCloud accounted for 60.42% of the UEM market size in 2025 and is forecast to grow at a 26.45% CAGR through 2031. That pattern shows the leading deployment model is still gaining ground instead of settling into maturity. Cloud agents let IT teams cover remote fleets faster because they avoid the heavier infrastructure prerequisites tied to many on-premises environments. The shared data layer created by cloud delivery also supports more continuous policy enforcement and faster remediation in the unified endpoint management market.
On-premises deployments still matter in sensitive environments where local control and strict data handling remain top priorities. Hybrid models are also gaining traction because they let firms keep sensitive workloads closer to home while managing standard endpoints through cloud services. Microsoft continued to widen Intune's advanced capabilities in 2026, which reinforced the pull toward cloud-managed environments while keeping the broader management layer tied to the Microsoft stack. This balance between cloud scale and local control is keeping several deployment paths relevant across the unified endpoint management industry.
By Organization Size:
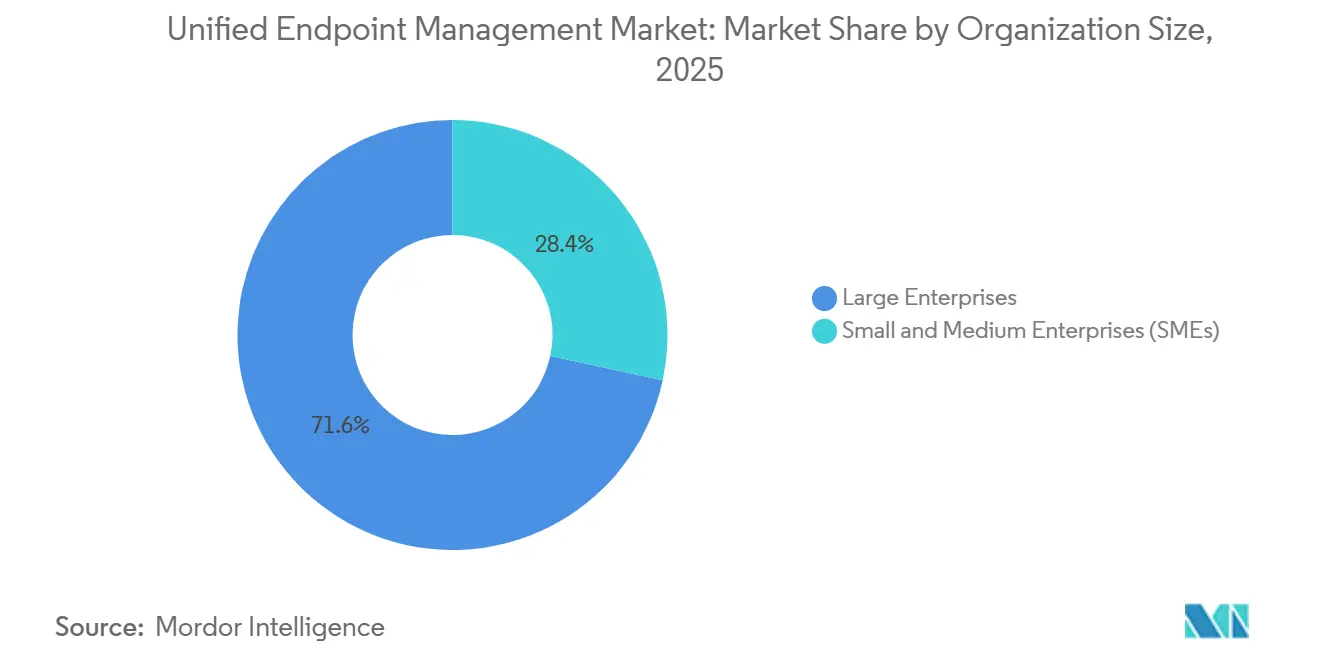
Large Enterprises Anchor Demand, SMEs Build MomentumLarge enterprises represented 71.62% of the UEM market size in 2025, reflecting the scale benefits of centralized governance across large and diverse device fleets. Their spending is less discretionary in sectors that manage privileged data, complex compliance rules, and broad remote work footprints. Buyers in this group increasingly value converged management, clearer compliance visibility, and easier automation over isolated feature depth. This leaves the unified endpoint management market closely tied to large account renewals, standardization programs, and platform consolidation decisions.
SMEs are projected to post the fastest growth at a 26.62% CAGR through 2031, which shows that adoption is moving beyond the largest IT estates. Subscription delivery and lighter onboarding are making UEM more reachable for firms that never had dedicated endpoint teams or deep internal support resources. ServiceNow and Lenovo said in May 2026 that their expanded agreement targeted organizations with 5,000 to 50,000 employees, with goals that included lower support costs and faster onboarding. Insurance requirements, client security expectations, and workforce expansion are widening the addressable base of the UEM market.
By End-User Industry:
IT and Telecom Leads, Healthcare Sets the PaceIT and Telecom represented 24.67% of the UEM market size in 2025, making it the largest end-user segment. The sector already manages broad device estates across field staff, retail networks, and operations teams, so unified control solves an immediate operational problem. That operating complexity makes endpoint governance a practical requirement instead of a discretionary software layer in the unified endpoint management market. Kyndryl's renewal with Vodafone Idea in November 2025, focused on IT automation, cyber resilience, and zero-touch delivery, shows how telecom buyers are linking endpoint governance with broader operations modernization.
Healthcare is expected to record the fastest growth at a 26.07% CAGR through 2031 in the unified endpoint management market. Digital clinical workflows, medical IoT growth, and HIPAA-linked controls are expanding the number and type of endpoints that must be governed. IBM's MaaS360 policy recommendation engine is designed to flag HIPAA-related policy drift, which strengthens its relevance for healthcare environments. As healthcare organizations add AI-enabled administrative and diagnostic tools, they are creating endpoint categories that need more specialized policy templates than generic configurations can usually provide.
Geography Analysis
North America Unified Endpoint Management Market
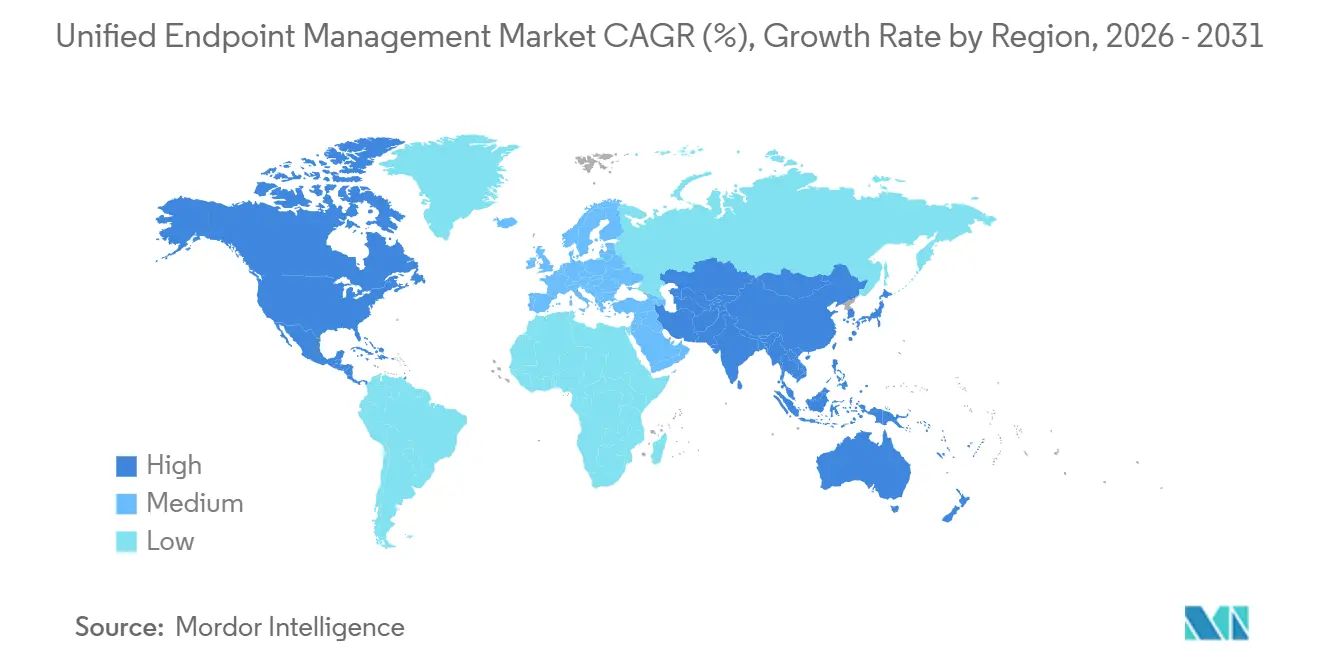
North America accounted for 39.78% of unified endpoint management (UEM) market share in 2025, making it the largest regional block. Early cloud adoption and a stronger cybersecurity spending culture continue to support demand across the region. Regulated sectors such as healthcare, legal services, and finance also raise the value of complete audit trails and tighter endpoint control. Large law firms and enterprise service networks in major US cities remain attractive customers because client confidentiality and e-discovery readiness are central operating requirements. Kyndryl's March 2026 Texas DIR contract shows how public sector modernization is adding another layer of demand for endpoint security, cloud, and AI-linked services.
Europe and South America Unified Endpoint Management Market
Europe remains a key geography in the unified endpoint management (UEM) market because GDPR, zero-trust priorities, and hybrid work are all shaping buying decisions. Buyers in Germany and nearby markets continue to weigh cloud flexibility against local control and strict data handling requirements. Kyndryl's April 2026 SANDETEL contract in Spain shows how regional governments are tying cloud adoption, process automation, and compliance into wider modernization programs. South America is still earlier in adoption, with activity centered on multinational firms that want consistent endpoint standards across regional offices.
APAC and MEA Unified Endpoint Management Market
Asia-Pacific is projected to grow at a 26.68% CAGR through 2031, the fastest pace among regions in the unified endpoint management market. The region benefits from mobile workforce growth, digital transformation programs, and lower legacy infrastructure burdens in several deployment settings. China, Japan, India, and South Korea remain the largest national demand centers, while healthcare IT and manufacturing governance are widening the use case base. Middle East and Africa are smaller today, but smart city and public digitalization efforts in Saudi Arabia and the UAE are building a medium-term opening for vendors with regional delivery capacity.

Competitive Landscape
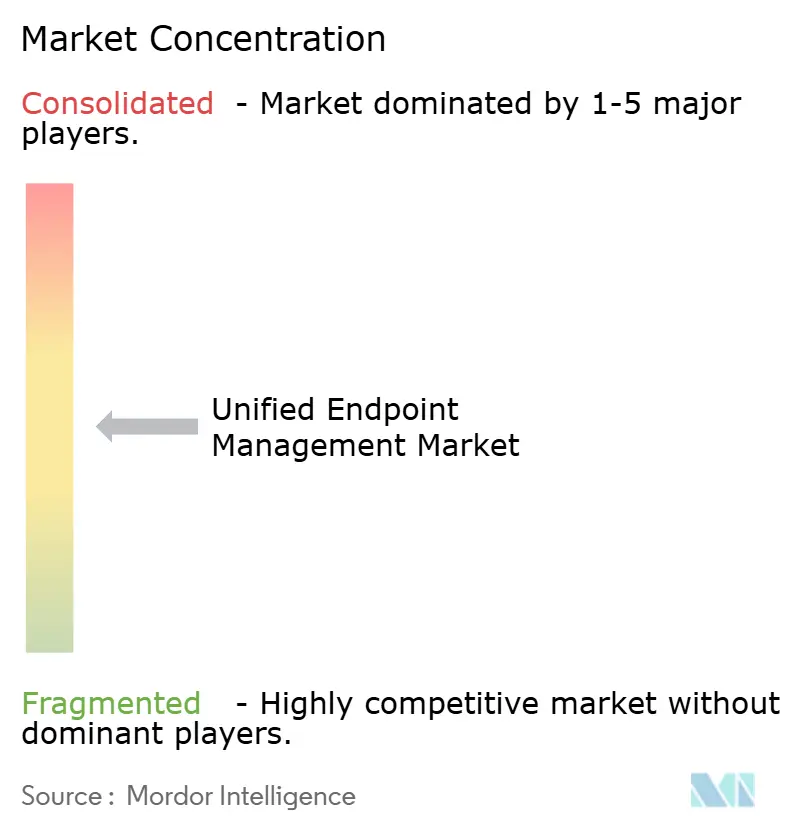
The competitive landscape of the unified endpoint management (UEM) market is medium-concentrated, with platform vendors and IT services firms competing on different parts of the spend pool. Microsoft Intune holds a strong structural position because it sits inside Microsoft 365, Entra ID, and the broader Microsoft cloud stack. IBM MaaS360, HCL BigFix, Cisco Cloud Control, and Omnissa Workspace ONE compete where buyers want deeper neutrality, specialized compliance support, or broader infrastructure reach. Service providers such as Kyndryl, Accenture, TCS, Wipro, and Capgemini compete more heavily for managed delivery, integration, and modernization contracts. This split means product depth alone is not enough in the unified endpoint management market, because enterprises also evaluate rollout support and policy execution at scale.
A major pattern in the unified endpoint management market is the push to connect endpoint data with automated action. Cisco launched Cloud Control in June 2026 as a unified environment for human administrators and AI agents across networking, security, compute, observability, and collaboration. HCLSoftware partnered with Tychon in February 2026 to add automated cryptography discovery and inventory to BigFix, which extends endpoint governance into post-quantum readiness. These moves show that vendors are widening UEM from device control toward broader operational and security orchestration.
Another competitive theme is packaging, because vendors are using the unified endpoint management market to pull buyers into larger platform relationships. Microsoft's 2026 decision to add advanced Intune capabilities at scale inside Microsoft 365 bundles is a clear example of this strategy. IBM's 2026 Smart Device Groups release also points to faster real-time policy execution as a practical differentiator in large estates. The main open space remains governance for AI-era endpoints, where standards for AI workstations, inference devices, and agent execution environments are still taking shape.
Unified Endpoint Management Industry Leaders
IBM Corporation
Microsoft Corporation
Broadcom Inc.
Ivanti Inc.
Citrix Systems Inc.
- *Disclaimer: Major Players sorted in no particular order
Unified Endpoint Management Market Companies Covered in this Report
- Jamf Holding Corp.
- Ivanti Software, Inc.
- SOTI Inc.
- Mitsogo Inc.
- 42Gears Mobility Systems Pvt. Ltd.
- Matrix42 GmbH
- Omnissa, LLC
- NinjaOne, LLC
- Tanium Inc.
- Automox, Inc.
- JumpCloud Inc.
- Kandji, Inc.
- Addigy, Inc.
- Mosyle Corporation
- ProMobi Technologies Pvt. Ltd.
- Syxsense Inc.
- Action1 Corporation
- Absolute Software Corporation
- Atera Networks Ltd.
- baramundi software GmbH
- Aagon GmbH
- Adaptiva Corporation
- Miradore Oy
- Codeproof Technologies Inc.
- SimpleMDM, Inc.
- FileWave AG

Recent Industry Developments in Unified Endpoint Management Market
- June 2026: Cisco unveiled Cisco Cloud Control at Cisco Live US, a unified management platform integrating networking, security, compute, observability, and collaboration under a single operational environment for human administrators and AI agents. The platform connects to third-party ecosystems including Microsoft, ServiceNow, Google Cloud, and AWS, entering controlled availability in the United States with global expansion planned for later in 2026. This positions Cisco as a horizontal infrastructure orchestration player across the UEM-adjacent endpoint governance stack.
- May 2026: Tanium and ServiceNow announced the ITOM AI Prime powered by Tanium solution at Knowledge 2026, integrating Tanium's Autonomous IT Platform with ServiceNow IT Operations Management AI Prime. The joint offering targets a projected 60% reduction in MTTR through autonomous endpoint patching and real-time CMDB enrichment, removing manual intervention from endpoint remediation workflows at enterprise scale.
- May 2026: ServiceNow and Lenovo announced an expanded multi-year strategic agreement at Knowledge 2026, targeting enterprises with 5,000 to 50,000 employees across Australia, New Zealand, Hong Kong, Singapore, and Ireland. Projected outcomes include up to 30% reduction in IT support costs, 50% faster employee onboarding, and proactive resolution of up to 40% of IT issues before user impact, with global expansion planned.
- May 2026: ServiceNow expanded its strategic integration with Microsoft at Knowledge 2026, extending AI Control Tower governance across the Microsoft Agent 365 ecosystem, Microsoft Foundry, and Copilot Studio. ServiceNow AI specialists are available in the Microsoft Agent 365 Marketplace, enabling unified governance of AI agents operating across Microsoft 365 tools in enterprise environments.


Unified Endpoint Management Market Report Scope and Research Methodology
Market Definition and Coverage
Our study defines the unified endpoint management market as every software platform and related service that lets an organization enroll, configure, monitor, and secure laptops, desktops, smartphones, rugged handhelds, wearables, and IoT endpoints from one console. According to Mordor Intelligence, the scope counts perpetual licenses, SaaS subscriptions, and managed services purchased by commercial, government, and education customers worldwide.
Scope Exclusions: Stand-alone mobile-device management tools that do not extend policy enforcement to PCs or IoT devices are excluded.
Segments Covered in This Report
- By Component
- Solutions
- Device Management
- Application Management
- Content Management
- Security and Compliance Management
- Analytics and Automation
- Services
- Solutions
- By Deployment Mode
- Cloud-Based
- On-Premise
- Hybrid
- By Organization Size
- Large Enterprises
- Small and Medium Enterprises
- By End-User Industry
- IT and Telecommunications
- BFSI
- Government and Defense
- Healthcare and Life Sciences
- Manufacturing
- Retail and E-Commerce
- Education
- Transportation and Logistics
- Energy and Utilities
- Other end-user industries
- By Geography
- North America
- United States
- Canada
- Mexico
- South America
- Brazil
- Argentina
- Chile
- Rest of South America
- Europe
- Germany
- United Kingdom
- France
- Italy
- Spain
- Netherlands
- Russia
- Rest of Europe
- Asia-Pacific
- China
- Japan
- India
- South Korea
- Australia and New Zealand
- Southeast Asia
- Rest of Asia-Pacific
- Middle East
- Saudi Arabia
- United Arab Emirates
- Turkey
- Rest of Middle East
- Africa
- South Africa
- Egypt
- Nigeria
- Rest of Africa
- North America
Data Sources, Market Sizing, and Validation
Primary Research
Mordor analysts interview endpoint security architects, procurement leads, and channel partners across North America, Europe, and Asia-Pacific. These conversations clarify real-world device mixes, license renewal behavior, and regional compliance triggers, helping us validate secondary signals and fine-tune key assumptions.
Desk Research
We collect baseline metrics from authoritative, open sources such as NIST zero-trust guidelines, ENISA threat bulletins, International Telecommunication Union device penetration tables, FCC equipment authorizations, Cloud Security Alliance papers, and IEEE Access studies on enterprise mobility. Annual reports, 10-Ks, investor decks, and reputable press provide revenue splits, subscription counts, and deployment anecdotes that sharpen our supply-side view.
Paid resources are tapped judiciously; D&B Hoovers gives company financials, while Dow Jones Factiva flags material announcements that could swing adoption or pricing. The sources listed here illustrate our approach and are not exhaustive.
Market-Sizing & Forecasting
We construct a top-down demand pool using active workforce counts, average devices per employee, and BYOD penetration, which are then multiplied by prevailing subscription ASPs. Supplier roll-ups and selective channel checks act as a bottom-up reasonability screen. Variables such as hybrid-work adoption, OS life-cycle roadmaps, cybersecurity spending indices, regulatory mandates, and endpoint refresh cycles feed a multivariate regression that projects values through 2030. Gaps in source granularity are bridged with analog benchmarks from similar software categories and confirmed with expert feedback.
Data Validation & Update Cycle
Modeled outputs pass variance checks against independent device shipment tallies and disclosed vendor revenue. Senior analysts review anomalies before sign-off. We refresh each dataset every twelve months and trigger interim updates when material events, like a major cyber incident or licensing model change, occur.
How Mordor Intelligence's Unified Endpoint Management Market Size Compares to Other Published Estimates
Published market estimates often diverge because firms choose different endpoint buckets, revenue definitions, refresh cadences, and currency conversions. Our disciplined scope selection and annual refresh keep the baseline tightly aligned with how buyers actually procure UEM today.
Key gap drivers include whether managed-service fees are counted, how aggressively future device ratios are assumed, and if cloud upsell premiums are applied. By tying every assumption to observable metrics and expert consensus, we minimize bias from blanket growth multipliers or legacy exchange rates.
Benchmark comparison
| Market Size | Anonymized source | Primary gap driver |
|---|---|---|
| USD 7.04 billion (2025) | Mordor Intelligence | - |
| USD 5.29 billion (2023) | Regional Consultancy A | Excludes managed-service revenue; single 2022 FX rate |
| USD 6.80 billion (2025) | Global Consultancy B | Uses fixed 18 % growth multiplier; no device-mix adjustment |
| USD 5.63 billion (2024) | Industry Association C | Counts software licenses only; omits SaaS renewals |
These comparisons show that, while others provide useful snapshots, Mordor's balanced mix of verified variables, periodic reviews, and transparent assumptions delivers the most dependable baseline for strategic planning.


Key Questions Answered in the Report
What is the current size and outlook of the unified endpoint management market?
The unified endpoint management market was valued at USD 7.07 billion in 2025, stands at USD 8.72 billion in 2026, and is forecast to reach USD 27.03 billion by 2031 at a 25.38% CAGR.
Which region leads demand for unified endpoint management solutions?
North America led with 39.78% share in 2025, supported by early cloud adoption, stronger cybersecurity spending, and stricter compliance needs in regulated sectors.
Which deployment model is growing the fastest in UEM?
Cloud was both the largest deployment mode at 60.42% share in 2025 and the fastest-growing one, with a projected 26.45% CAGR through 2031.
Why do large enterprises still account for most UEM spending?
Large enterprises held 71.62% share in 2025 because they manage broader device fleets, more operating systems, more geographies, and heavier compliance obligations.
Which end-user sector is expanding the quickest?
Healthcare is expected to post the fastest CAGR at 26.07% through 2031, driven by digital clinical workflows, medical IoT expansion, and HIPAA-linked governance needs.
What is shaping vendor competition in 2026?
Competition is increasingly shaped by how well vendors connect endpoint telemetry with automated action, bundle UEM into larger platforms, and support AI-era endpoint governance.
Page last updated on:


 Your data is secure and never sold or shared.


