
Enterprise Resource Planning Market Analysis by Mordor Intelligence
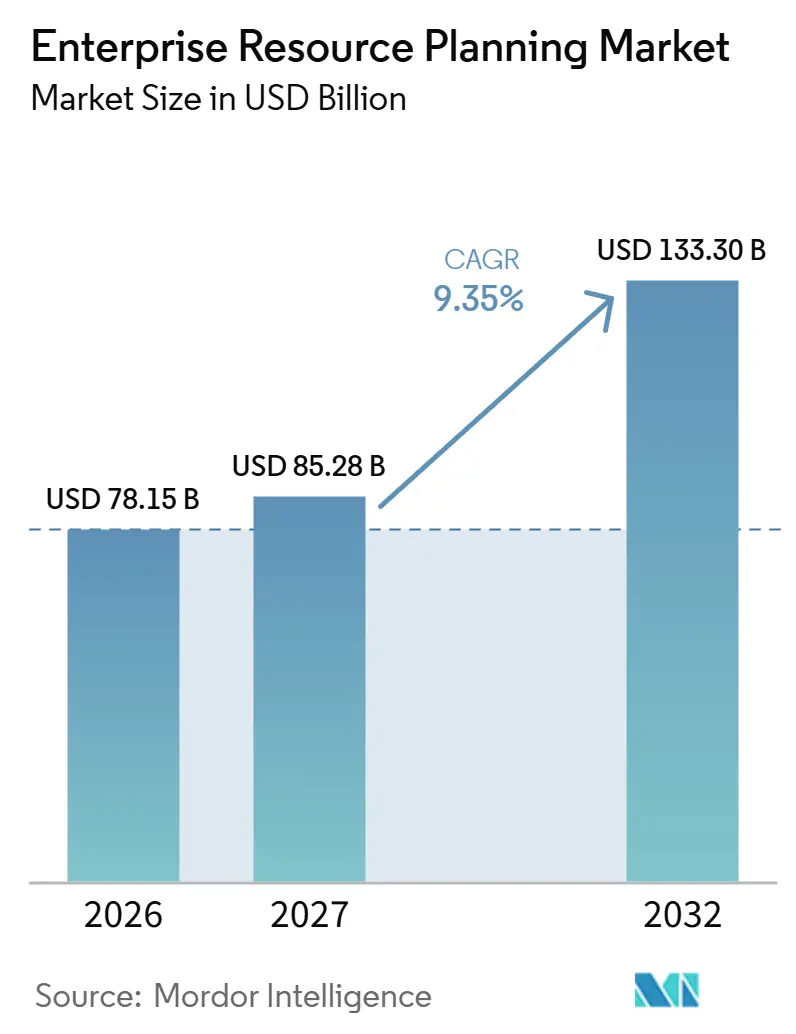
The enterprise resource planning market size is estimated at USD 78.15 billion in 2026 and is projected to be USD 85.28 billion in 2027, reaching USD 133.3 billion by 2032, growing at a CAGR of 9.35% from 2027 to 2032.
Scalable cloud services support ERP adoption among smaller German enterprises, while migration connects application replacement with a hosting choice. Suppliers can extend their role into ongoing optimization, but deployment costs and complex data relationships constrain the transition to a usable replacement. China's amended Cybersecurity Law, effective January 2026, requires critical information infrastructure operators to store specified personal information and important data collected or generated in domestic operations inside China, narrowing cross-border hosting choices for covered buyers. Suppliers that combine migration services with in-country hosting can give covered buyers a replacement path consistent with domestic storage requirements.
Key Report Takeaways
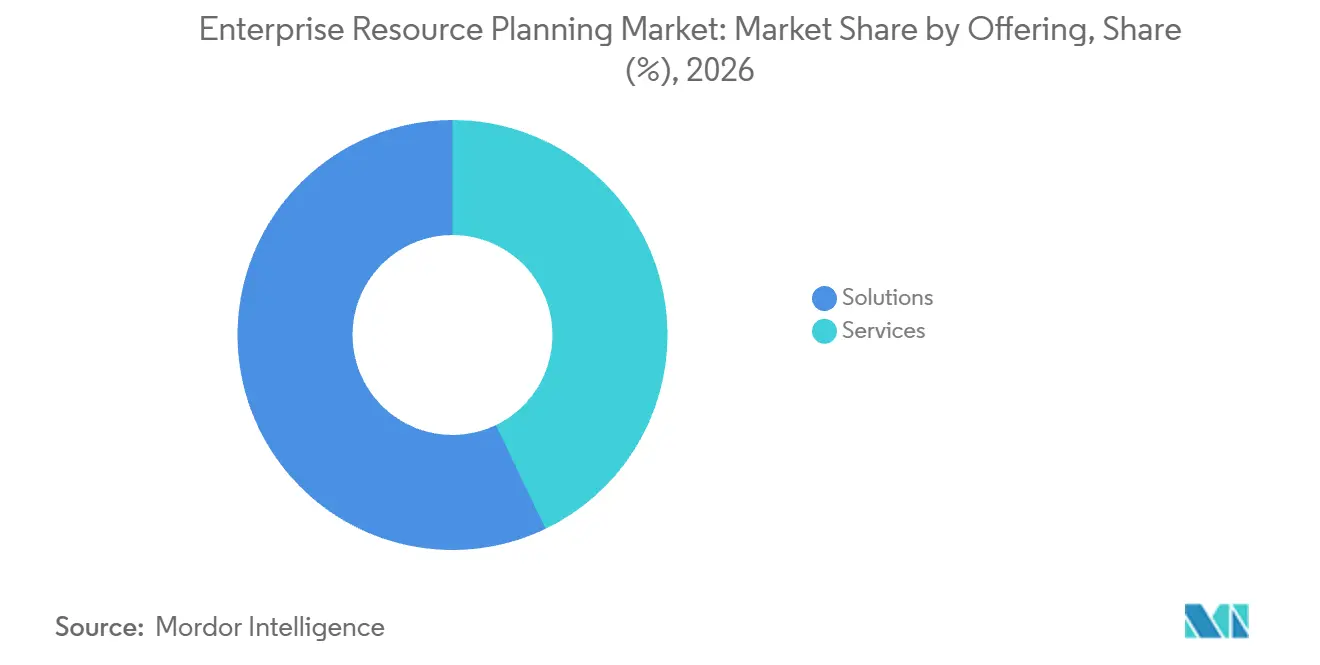
- By offering, solutions held a 57.13% enterprise resource planning market share in 2026, while services are forecast to be the fastest-growing segment at a CAGR of 14.08% from 2027 to 2032.
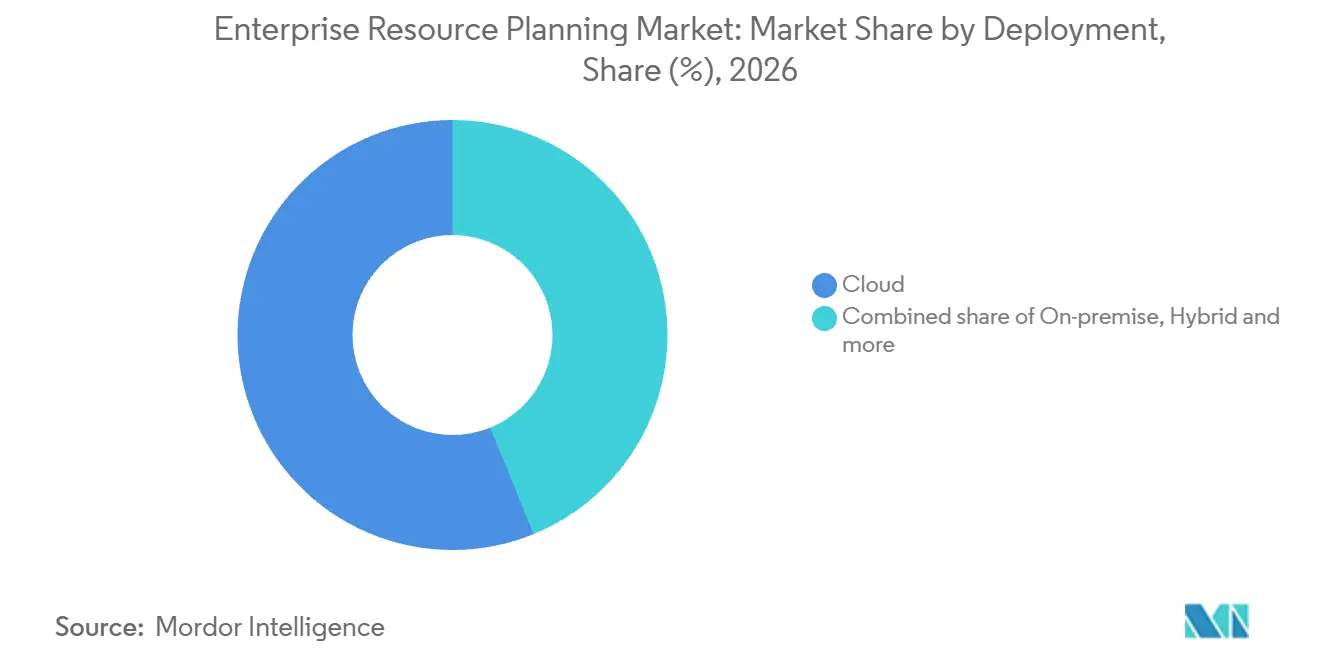
- Deployment revenue was led by cloud, with a 56.15% share of the enterprise resource planning market size in 2026, while hybrid is forecast to be the fastest-growing segment at a CAGR of 16.31% from 2027 to 2032.
- Among functions, finance led with 31.73% of revenue in 2026, while human resources is forecast to be the fastest-growing segment at a CAGR of 11% from 2027 to 2032.
- By enterprise size, small and medium-sized enterprises held 65.01% of revenue in 2026 and are forecast to be the fastest-growing segment at a CAGR of 15.12% from 2027 to 2032.
- Manufacturing led end-user industries with 24.49% of revenue in 2026, while IT and telecom is forecast to be the fastest-growing segment at a CAGR of 16.55% from 2027 to 2032.
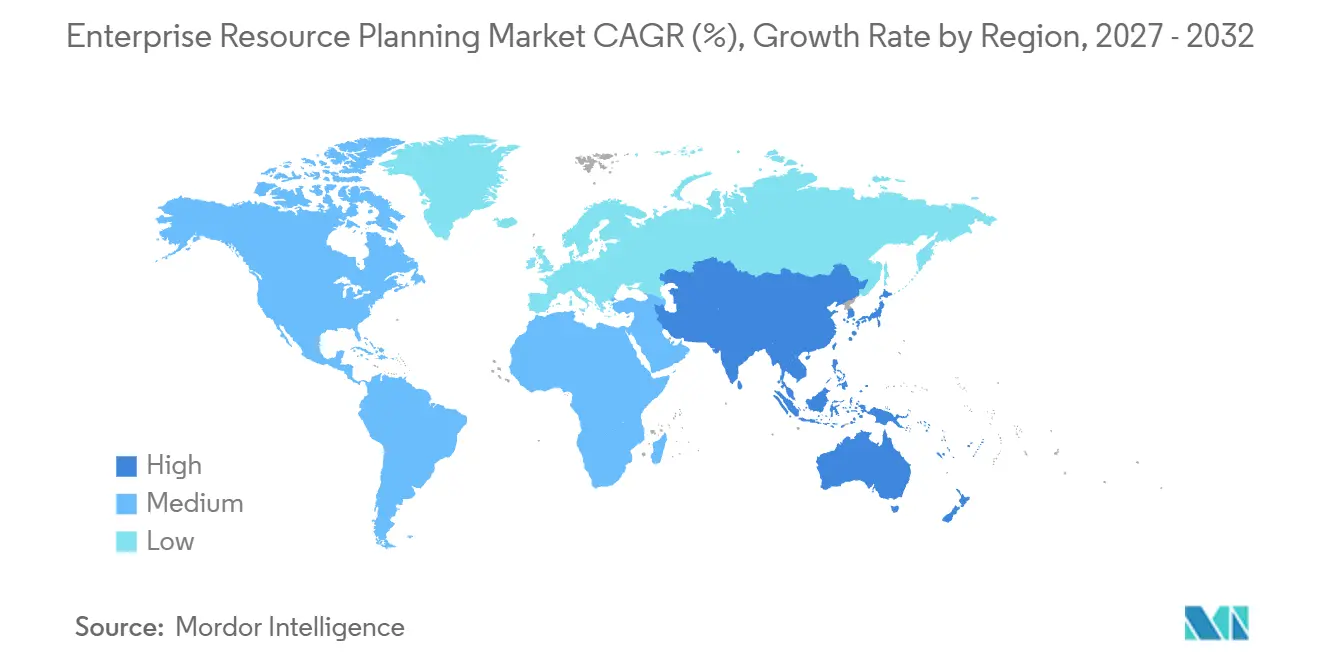
- Geographically, North America led with 33.63% of revenue in 2026, while Asia-Pacific is forecast to be the fastest-growing region at a CAGR of 12.15% from 2027 to 2032.
Note: Market numbers in this report are based on Mordor Intelligence's proprietary estimation framework, which combines nine months of actuals with Q4 projections for base year 2026.
Market Trends and Insights
Drivers Impact Analysis of Enterprise Resource Planning Market*
| Driver | (~) % Impact on CAGR Forecast | Geographic Relevance | Impact Timeline |
|---|---|---|---|
| Cloud-First Migration Momentum | +5.1% | North America, Europe and Asia-Pacific | Medium term (2-4 years) |
| AI-Driven Analytics Embedded in ERP | +1.4% | North America and Asia-Pacific | Medium term (2-4 years) |
| SME SaaS Adoption Surge | +3.9% | European Union, including Germany | Medium term (2-4 years) |
| Mandatory E-Invoicing Mandates (VAT, CTC) | +1.6% | Belgium and United Arab Emirates | Short term (≤ 2 years) |
| ESG Accounting Add-Ons For Scope-3 Tracking | +0.6% | State of California | Short term (≤ 2 years) |
| Increasing Adoption of Cloud-Based ERP Solutions | +0.4% | Germany and Ireland | Long term (≥ 4 years) |
| Source: Mordor Intelligence | |||
Cloud-First Migration Momentum
By November 12, 2025, Amey had transitioned from a 20-year-old legacy ECC system to SAP Cloud ERP Private Edition hosted on Google Cloud Platform. SAP SE reported that Cloud ERP Suite revenue rose 28% in fiscal 2025, or 32% at constant currencies. The suite's revenue growth shows expanding commercial demand for cloud ERP, while Amey illustrates how replacement of an installed system contributes to that demand. The Amey project combined a software transition with a specified hosting environment, making migration expertise relevant to both application and infrastructure choices. Migration can therefore draw cloud ERP demand from installed ECC users, extending the addressable pool beyond organizations adopting ERP for the first time.
AI-Driven Analytics Embedded in ERP
Embedding AI analytics in ERP can make the application a place to interpret a transaction as well as record it. In its Q2 2026 release, SAP described generally available AI-assisted reporting in SAP S/4HANA Cloud Public Edition, letting accounts receivable managers explore localized financial and logistics data through natural-language queries within their workflows. Microsoft reports that generative insights for seasonality, trends and signal correlations have been generally available in Dynamics 365 Supply Chain Management demand planning since August 2026. Natural-language exploration addresses how receivables managers retrieve information, while generative insights address how planners interpret demand signals. ERP suppliers can therefore compete on role-specific analytical capabilities, bringing reporting usability and demand interpretation into application selection.
SME SaaS Adoption Surge
Scalable application capacity can give smaller ERP buyers a purchasing option that varies with their operating needs. In Germany in 2025, 22% of enterprises with 10 to 49 persons employed purchased ERP software as a cloud computing service.[1] The corresponding share for enterprises with 50 to 249 persons employed was 26%. Eurostat's enterprise cloud definition combines on-demand provision, payable services and elastic capacity that can avoid investment in potentially underused infrastructure. Applied to ERP, that model allows a provider to serve a defined starting workload and expand provision as more users require access. Usage-based offers consequently make active workloads commercially important alongside account acquisition, because capacity can also contract when demand falls.
Mandatory E-Invoicing Mandates (VAT, CTC)
Tax compliance makes structured invoice exchange a concrete ERP integration requirement. Since January 1, 2026, Belgium has required structured electronic invoices for transactions between Belgian enterprises liable to VAT.[2] The invoices pass directly between enterprise software systems, and emailing a PDF does not meet the requirement. This distinction gives ERP suppliers a specific implementation task linking invoice generation to compliant exchange. For affected finance teams, the commercial value lies in completing the regulated transaction within the accounting workflow. Providers can therefore compete on reliable invoice delivery and reconciliation, with compliance creating demand for targeted upgrades as well as broader replacements.
Restraints Impact Analysis of Enterprise Resource Planning Market*
| Restraint | (~) % Impact on CAGR Forecast | Geographic Relevance | Impact Timeline |
|---|---|---|---|
| High Implementation and Switching Costs | -1.7% | North America and Europe | Medium term (2-4 years) |
| Data Integration and Legacy Complexity | -1.2% | North America, Europe and Asia-Pacific | Medium term (2-4 years) |
| Rising Data-Sovereignty / Residency Laws | -0.5% | China and Brazil | Long term (≥ 4 years) |
| Shortage Of Micro-Vertical ERP Talent | -0.3% | North America and Europe | Short term (≤ 2 years) |
| Source: Mordor Intelligence | |||
High Implementation and Switching Costs
Implementation costs can constrain ERP adoption when the delivery expense is difficult to justify alongside the software benefits. In SAPinsider's December 2025 to March 2026 survey, 63% of respondents with no SAP S/4HANA plans identified increased cloud infrastructure and deployment costs as implementation barriers. Within that same group, 50% identified an inability to create a value proposition for SAP S/4HANA. Among these respondents, cost was cited more often than a missing value case, so an investment case would first have to justify infrastructure and deployment spending.
Data Integration and Legacy Complexity
An ERP replacement can be constrained by relationships inside its data even after the target application has been selected. TechTarget's May 2026 analysis identified poor data quality, incompatible formats and complex ERP data as barriers to successful migration. Maintaining referential integrity among complex data relationships can be costly and time-consuming, with inadequate attention risking mismatched records, broken links or data loss. Employees may also have to decide which data to migrate and which to archive while preserving the relationships between records. Preserving connected records thus adds a delivery burden that can delay the point at which the buyer can use the replacement ERP system.
*Our forecasts treat driver/restraint impacts as directional, not additive. The impact forecasts reflect baseline growth, mix effects, and variable interactions.
Enterprise Resource Planning Market Segment Analysis
By Offering:
Software Relationships Support Implementation DemandSolutions accounted for a 57.13% share of the enterprise resource planning market size in 2026. SAP SE reported Cloud ERP Suite revenue of EUR 10.74 billion (USD 12.53 billion) in the first half of 2026, up 24% from the first half of 2025. The largest segment therefore includes substantial spending tied to an identifiable ERP suite, making continuity of that software relationship commercially important for its supplier. The first-half increase made this suite a source of additional application revenue for SAP within an already substantial software business.
Services is forecast to be the fastest-growing segment, with a CAGR of 14.08% from 2027 to 2032. On October 3, 2025, the Netherlands' Ministry of Infrastructure and Water Management signed a 15-year contract naming SAP Nederland Holding B.V. as the supplier. The contract combined SaaS ERP services, on-premises ERP licenses and implementation services. The contract places implementation within an extended ERP relationship encompassing different deployment models. Because the award covers SaaS and installed licenses together, the implementation services in it serve both deployment modes under one supplier contract.

By Deployment:
Cloud Scale Coexists with Hybrid ModernizationCloud represented a 56.15% enterprise resource planning market share in 2026. Oracle reported USD 1.1 billion in Q3 fiscal 2026 Fusion Cloud ERP SaaS revenue, up 17% in USD and 14% in constant currency year over year.[3] Such product-specific revenue makes ongoing application service commercially consequential to the provider, beyond the initial decision to select an ERP platform. Oracle's constant-currency growth was 3 percentage points below its USD growth, showing that currency effects amplified the reported increase in this SaaS business.
Hybrid is forecast to be the fastest-growing segment, with a CAGR of 16.31% from 2027 to 2032. In SAPinsider's 2025 survey, 30% of hybrid-majority respondents reported significant acceleration of SAP modernization plans associated with adopting cloud architecture. This ties cloud architecture adoption among hybrid-majority SAP organizations to faster modernization of their existing SAP workloads, making a staged transition a relevant commercial proposition for that customer group. On-premise deployment was the most common arrangement among ERP systems in PMMI's 2025 survey of 57 member respondents, followed by cloud-based deployment. Suppliers can address both needs through transitions that accommodate an established deployment while creating a practical route toward cloud use.
By Function:
Finance Continuity and Workforce Rollouts Shape DemandFinance was the largest segment, accounting for 31.73% of revenue in 2026. In PMMI's 2025 member-company survey, all 5 companies using SAP reported using its finance functionality. Birmingham City Council reported in July 2025 that manual correction of erroneous cost-center postings in its Oracle ERP ledger had delayed production of its 2023/24 accounts. That historical operating problem makes posting accuracy and account-close readiness concrete criteria for a finance implementation. The commercial test is whether the ledger can support the accounts without a second manual correction workload.
Human resources is forecast to be the fastest-growing segment, with a CAGR of 11% from 2027 to 2032. In July 2026, Japan-based KITZ began operating a unified global HR platform built on SAP SuccessFactors Employee Central and started rolling it out to employees. Odyssey supported implementation of the platform. The project therefore creates a delivery role for an implementation provider alongside SAP's application role, linking global HR unification to employee rollout.
By Enterprise Size:
First Adoption and Installed Use Require Different PropositionsSmall and medium-sized enterprises were the largest segment, with 65.01% of revenue in 2026, and are forecast to be the fastest-growing segment at a CAGR of 15.12% from 2027 to 2032. In 2025, 41.08% of small EU enterprises in surveyed nonfinancial business activities used ERP applications, with small enterprises defined as having 10 to 49 employees or self-employed persons. This measured use leaves room for first-time adoption within an established small-employer population. Small EU nonusers in that surveyed population are potential first-time buyers, giving suppliers an opening to establish integrated workflows in firms without an ERP application.
Large enterprises in surveyed EU nonfinancial business activities recorded 88.71% ERP use in 2025, with the size class defined as 250 or more employees or self-employed persons. For this population, a sales proposition can center on replacing or extending an application that is already in use. Smaller-enterprise selling can also address nonusers within the measured population, making first adoption a distinct route alongside changes to an installed system. The practical distinction is whether the project establishes an ERP workflow or changes one that the organization already uses.
By End-user Industry:
Manufacturing Adoption Meets Telecom Migration DemandManufacturing was the largest segment, accounting for 24.49% of revenue in 2026. In 2025, 57.62% of surveyed EU manufacturing enterprises used ERP software. Chemicals manufacturer Advent Chembio reported SAP Business One's go-live on November 12, 2025, connecting production, quality, warehousing, sales and finance with batch traceability and materials planning. With production and quality on the same platform as warehousing and sales, system scope follows the batch through release and dispatch. The buying proposition therefore includes traceable production handoffs, making continuity of batch records a concrete criterion for manufacturing ERP delivery.
IT and telecom is forecast to be the fastest-growing segment, with a CAGR of 16.55% from 2027 to 2032. Retail and e-commerce has a support-contract example in Denmark, where Tata Consultancy Services announced extended SAP S/4HANA support for Coop Danmark's network of more than 900 stores in March 2025. That engagement illustrates continuing ERP platform support for a retail buyer. Colt Technology Services, a global telecommunications provider operating in more than 40 countries, completed its cloud ERP migration through RISE with SAP in 2026. Colt's completed migration illustrates demand from modernizing an existing multinational telecom ERP environment within the fastest-growing segment.
Geography Analysis
North America Enterprise Resource Planning Market
North America accounted for a 33.63% share of the enterprise resource planning market size in 2026. By February 3, 2026, Clorox had completed the full rollout of its SAP ERP system across the United States and Canada. Separately, 50% of 158 manufacturing leaders surveyed across North America listed ERP and MES modernization as a 2026 technology priority. Clorox's completed cross-border ERP program and the manufacturers' stated priorities give suppliers distinct opportunities in multinational deployment and potential modernization work.
Asia-Pacific Enterprise Resource Planning Market
Asia-Pacific is forecast to be the fastest-growing region, with a CAGR of 12.15% from 2027 to 2032. In July 2026, SAP announced that BMW Brilliance Automotive Ltd. in Greater China had chosen SAP Cloud ERP Private. The same update identified India's Agrawal Metal Works Pvt. Ltd. and Electrosteel Castings Ltd. as industrial and manufacturing buyers of the private-cloud ERP product. In 2025, Singapore-headquartered OCBC was using Oracle Fusion Cloud ERP to unify its global finance platform. Demand therefore spans industrial transformation and multinational finance unification, with private-cloud selections creating potential projects alongside an operating banking platform.
In South America, Brazil's automotive-wheel manufacturer Iochpe-Maxion migrated SAP S/4HANA to SAP Cloud ERP Private in June 2025, and Peru's AOPSA put SAP Business One into operation on September 11, 2025. In Europe, 61.28% of EU information and communication enterprises with at least 10 employees or self-employed persons used ERP software in 2025, supporting an installed-customer proposition for application extensions or replacements. In the Middle East and Africa, Transnet Port Terminals, a division of South Africa's state-owned Transnet, completed its ECC 6.0 to SAP S/4HANA migration across all 16 sea-cargo terminals by September 25, 2025. By January 3, 2026, Saudi Arabia's National Center for the Development of the Non-Profit Sector had completed an ERP implementation using SAP S/4HANA and SAP SuccessFactors. The commercial scope varies from installed-system changes in Brazil and EU ICT businesses to terminal-wide migration and public-sector deployment, requiring propositions matched to each operating footprint.
Regulatory Framework and Outlook
These selected jurisdictions are compared from the perspective of a multinational cloud ERP provider processing customer data. Federal cloud procurement qualification, processor contracts and cross-border transfer controls create different delivery conditions for such a provider. The commercial question is how those obligations fit the proposed application, client sector and data flows, with ratings reflecting the delivery burden and access to qualified customers.
Regulatory Table of Enterprise Resource Planning Market
| Decision factor | United States | Germany | China | Brazil |
|---|---|---|---|---|
| Primary authority | Federal Trade Commission (FTC); federal authorizing agencies | State data-protection supervisory authorities, subject to telecommunications, postal and some broadcasting exceptions | Cyberspace Administration of China (CAC) | National Data Protection Authority (ANPD) |
| Key instruments or direction | FTC Safeguards Rule; federal cloud security requirements; consolidated FedRAMP rules from January 1, 2027 | General Data Protection Regulation (GDPR), Articles 28 and 32; proposed Federal Data Protection Act (BDSG) supervisory reform | Network Data Security Management Regulations; outbound certification measures from January 1, 2026 | Data-protection law (LGPD); ANPD Resolution 19/2024; minimum-security standards in internal drafting |
| Commercial effect | Supplier safeguards required by FTC-covered financial clients; federal assessments reused where practicable | Binding processor contracts and appropriate security for customer personal data | Qualifying personal-data export routes; assessment for necessary exports of important data collected or generated in China | Legal basis, legitimate disclosed purposes and a valid mechanism for covered personal-data exports |
| Current policy attractiveness | Medium | Medium | Low | Medium |
| Future direction of policy attractiveness | No change | No change | No change | Hardening |
| Source: Mordor Intelligence | ||||
The United States assessment reflects FTC-covered financial-client safeguards and reuse of federal assessments where practicable, with consolidated rules becoming mandatory on January 1, 2027, to maintain FedRAMP certification. The Bundesrat's August 27, 2026 proposal covers binding majority decisions by Germany's data-protection conference and a lead authority for affiliated companies, while the federal government reported legal reservations and planned its own proposal. China's assessment combines covered important-data export controls with January 2026 certification measures specifying an existing personal-data transfer route. Brazil's transfer channels support current access, while ANPD's minimum-security standards work, in internal drafting on October 20, 2026, could make the existing LGPD security duty more prescriptive.
Value Chain Stages
The ERP value chain compares application provision, implementation and continuing optimization, with suppliers able to participate at several stages. Oracle combines ERP publishing with its own advisory, implementation, change-management and post-implementation services. Microsoft's Dynamics 365 partner ecosystem also provides assessment, architecture, implementation and training, with many prepackaged services offered at no cost. These arrangements make the boundary between software provision and delivery work commercially important, because participation in an early assessment does not automatically establish where paid services begin.
Value Chain Analysis Table of Enterprise Resource Planning Market
| Primary activity | Key participants | Value capture | Bottleneck | Resilience response |
|---|---|---|---|---|
| ERP application provision | ERP publishers such as Microsoft Corporation and Oracle Corporation | Application subscriptions | Fit between software scope and required workflows | Resolve essential workflows before configuration |
| Implementation and business change | Implementation and transition partners such as Deloitte and Accenture | Contracted implementation and change-management fees | Coordination between application design and organizational changes | Assign delivery responsibilities across the buyer, publisher and integrator |
| Post-launch optimization | Publisher consulting teams such as Oracle Consulting | Continuing ERP optimization service fees | Translating application updates into useful operating changes | Maintain a defined post-production improvement program |
| Source: Mordor Intelligence | ||||
Oracle describes its Phase 0 preimplementation services as complimentary and its post-production services as helping customers apply quarterly product innovations. Because Oracle Consulting belongs to the software publisher, Oracle can pursue both application subscriptions and post-production service work within the same customer relationship. Quarterly product innovations make post-launch optimization a continuing scope of work, so value capture can extend past initial implementation without a new application sale.
Competitive Landscape
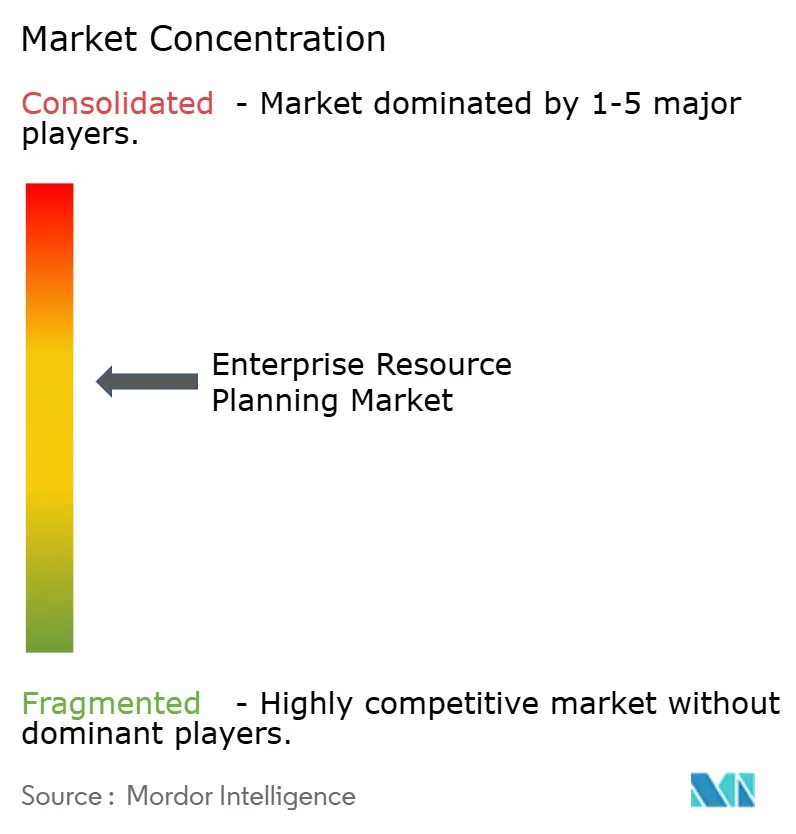
Competition is moderately concentrated around established application vendors, with industry specialists and providers focused on mid-sized businesses offering alternatives for buyers seeking a specific operating proposition. Microsoft Corporation, SAP SE, Infor Inc., Oracle Corporation and Sage Group plc are major competing ERP providers. In September 2025, SAP reported a completed Cloud ERP implementation connecting more than 100,000 PwC professionals across 19 countries. The PwC go-live demonstrates delivery of a unified ERP platform across national operations, making a completed multinational rollout a specific capability SAP can bring to comparable enterprise engagements.
Industry-focused and mid-sized-business propositions offer distinct alternatives, as Infor supplies industry-specific CloudSuite ERP and Sage positions Intacct for mid-sized businesses. Sage reported Intacct annual recurring revenue growth of more than 20% in the United States and around 50% outside the United States in fiscal 2025. For suppliers addressing these buyers, a continuing application relationship creates an opportunity to expand paid use after the initial selection, while an industry focus can define the operating context of the offer. Sage's result makes geographic expansion of a mid-sized-business application a competitive route alongside Infor's industry specialization.
Country-specific deployment and delivery arrangements add another competitive dimension to ERP selection. On January 28, 2025, Infor and Deloitte Italy announced an expanded collaboration in Italy covering CloudSuite solutions, including Infor LN for discrete manufacturing. Oracle's Fusion Cloud ERP is available on EU Sovereign Cloud across all 27 EU member states. EU-incorporated entities own, operate and manage the EU-located platform, using EU-based personnel. Infor's collaboration addresses delivery of discrete-manufacturing ERP in Italy, while Oracle's EU entities and personnel address platform operation and data control, so the two propositions answer different buyer requirements.
Enterprise Resource Planning Industry Leaders
-
Microsoft Corporation
-
SAP SE
-
Infor Inc.
-
Oracle Corporation
-
Sage Group plc
- *Disclaimer: Major Players sorted in no particular order
Enterprise Resource Planning Market Companies Covered in this Report
- SAP SE
- Oracle Corporation
- Microsoft Corporation
- Infor Inc.
- Sage Group plc
- Epicor Software Corporation
- IFS AB
- Unit4 NV
- Acumatica, Inc.
- Odoo SA
- QAD Inc.
- Plex Systems, Inc.
- Deltek, Inc.
- Priority Software Ltd.
- Ramco Systems
- Syspro
- TOTVS
- Yonyou
- HashMicro
Key Opportunities for Market Participants
These opportunities compare integrated ERP replacement with narrower connections between enterprise applications and mandatory e-invoicing services. Their commercial scope differs because an integrated solution procurement combines software and implementation, while a phased invoice obligation can be addressed through a defined systems connection. Suppliers need to match their delivery commitments to that distinction, with separate business integration included only where the buyer determines it is necessary.
Market Opportunities Table of Enterprise Resource Planning Market
| Opportunity | Why now | Buyer / lead segment | Recommended play | Main barrier | Likely beneficiaries |
|---|---|---|---|---|---|
| Integrated public-sector ERP replacement | Haringey Council approved procurement commencement on July 14, 2026 | Haringey Council in the United Kingdom | Bid software, implementation and support together; scope separate business integration only if required | Aligning implementation and organizational-change responsibilities | ERP publishers and implementation partners |
| ERP invoice-service integration | Provider appointment deadline October 30, 2026; implementation deadline January 1, 2027 | Businesses in the UAE's January 2027 implementation cohort | Connect ERP invoice workflows to an accredited provider and validate exchanges | Dependencies between provider onboarding and application testing | ERP integration specialists and accredited service providers |
| Government e-invoicing delivery | Provider appointment deadline March 31, 2027; implementation date October 1, 2027 | UAE government entities covered by the system | Sequence provider onboarding, ERP changes and acceptance testing against the government phase | Coordinating the provider connection with application acceptance | Public-sector ERP integrators and accredited service providers |
| Source: Mordor Intelligence | |||||
The central opening is to make e-invoicing operational within the ERP workflow handling the transaction. A defined invoice interface and tested provider connection give suppliers a specific deliverable tied to statutory implementation dates. Contract scope can then distinguish a compliance connection from integrated system replacement, allowing each proposal to carry delivery responsibilities appropriate to the buyer's actual requirement.
Recent Industry Developments in Enterprise Resource Planning Market
- Aug 2026: Microsoft made generative insights for seasonality, trends and signal correlations generally available in Dynamics 365 Supply Chain Management demand planning.
- May 2026: SAP introduced its Business AI Platform and Autonomous Suite, including AI agents for business applications.
- Apr 2026: Oracle made 12 Fusion Agentic Applications available across Oracle Fusion Cloud ERP and Oracle Fusion Cloud Supply Chain & Manufacturing.
Enterprise Resource Planning Market Report Scope and Research Methodology
Market Definition and Coverage
The global enterprise resource planning market measures annual worldwide spending in USD on ERP software solutions and related services used to manage and automate organizational business functions. It covers on-premise, cloud, and hybrid deployments across enterprise sizes, functions, and end-user industries.
Scope exclusions: Standalone IT hardware, separately invoiced cloud infrastructure or hosting, standalone non-ERP application software, and general IT consulting unrelated to ERP are excluded.
Segments Covered in This Report
- By Offering
- Solutions
- Services
- By Deployment
- On-premise
- Cloud
- Hybrid
- By Function
- Human Resources
- Supply Chain
- Finance
- Marketing
- Other Functions
- By Enterprise Size
- Large Enterprises
- Small and Medium-Sized Enterprises
- By End-user Industry
- Manufacturing
- Retail and E-commerce
- BFSI
- IT and Telecom
- Government and Public Sector
- Energy and Utilities
- Healthcare
- Other End-user Industries
- By Geography
- North America
- United States
- Canada
- Mexico
- South America
- Brazil
- Argentina
- Rest of South America
- Europe
- United Kingdom
- Germany
- France
- Italy
- Spain
- Rest of Europe
- Asia-Pacific
- China
- Japan
- India
- South Korea
- Rest of Asia-Pacific
- Middle East and Africa
- Middle East
- United Arab Emirates
- Saudi Arabia
- Rest of Middle East
- Africa
- South Africa
- Egypt
- Rest of Africa
- Middle East
- North America
Data Sources, Market Sizing, and Validation
Desk Research
Secondary research uses public sources such as Eurostat's ICT enterprise statistics and enterprise software use tables to track ERP adoption by size, industry and country, while Eurostat's enterprise survey methodology defines the population behind those indicators. Destatis's cloud computing tables distinguish purchases of cloud ERP software from general cloud service use, and national statistical offices and the Eurostat database help compare adoption signals across markets. These sources inform adoption context and market drivers rather than serving as direct measures of global ERP spending.
Company filings, annual reports and investor materials help identify ERP product boundaries, subscription and license revenue, implementation and support activity, and geographic exposure. Reputable business and technology reporting can cross-check material product or customer developments. The named sources are illustrative and not exhaustive, and further sources inform collection, validation and clarification.
Primary Interviews and Surveys
Interviews and structured surveys would include ERP software vendors, implementation and integration providers, and purchasing organizations across enterprise sizes and end-user industries, with executives and functional leaders able to explain buying, deployment and service decisions. Respondents would help check secondary estimates of offering, deployment, function, enterprise size, industry and regional spending, while a consistent questionnaire would distinguish ERP-specific customer spending from hardware, general cloud infrastructure and unrelated consulting. Where sources leave a gap, analysts would document the uncertainty, compare independent company and adoption indicators, and seek clarification from relevant respondents before using the evidence in triangulation.
Distribution of primary research fieldwork respondents
| Company type | Respondent position | Region |
|---|---|---|
| Top tier: 25% | CXOs: 20% | APAC: 40% |
| Mid tier: 55% | Functional/Unit leaders: 35% | EMEA: 32% |
| Smaller Players: 20% | Managers: 45% | Americas: 28% |
Market-Sizing & Forecasting
The model estimates global customer spending on ERP solutions and ERP-specific services from a top-down market base, then checks selected totals against supplier revenue disclosures and sampled customer contract values multiplied by deployment volumes. Core indicators include vendor ERP license and subscription revenue, ERP-specific service revenue, cloud migration and enterprise adoption rates, and customer spending by offering and deployment. Adoption by company size and industry helps allocate the total across the accepted classifications. Analysts build segment shares from disclosed product and service mixes, enterprise adoption evidence, contract examples and industry or regional demand patterns, keeping each transaction counted once when a bundled suite spans multiple functions.
Forecasts use scenario analysis informed by ERP revenue growth, cloud conversion, installed-system replacement cycles, SME adoption, regulatory e-invoicing requirements and demand for implementation and support services. Primary respondents can check whether these drivers plausibly affect each variable and segment. Supplier roll-ups and sampled contract-value-times-volume checks test selected portions of the top-down estimate, with known coverage and currency differences reconciled before comparison. When company disclosures combine ERP with other applications or infrastructure, analysts isolate the ERP component only where the source supports it and otherwise retain a documented range for triangulation rather than assigning unrelated revenue to ERP.
Data Validation & Update Cycle
Analysts triangulate vendor disclosures, public adoption indicators, contract evidence and respondent explanations, then investigate year-to-year changes, inconsistent segment shares and estimates that diverge from independent market signals before sign-off. A second review checks definitions, units, currency, geography, period alignment and arithmetic, and analysts re-contact a source or respondent when a material discrepancy, unclear product boundary or changed forecast driver could alter the estimate. The evidence is refreshed annually, reviewed between cycles when a material event changes ERP spending or deployment conditions, and checked again in a fresh pre-delivery pass.
Mordor Intelligence's Enterprise Resource Planning Market Sizing Compared With Other Published Estimates
The global enterprise resource planning market measures annual worldwide spending in USD on ERP software solutions and related services used to manage and automate organizational business functions. Core indicators include vendor ERP license and subscription revenue, ERP-specific service revenue, cloud migration and enterprise adoption rates, and customer spending by offering and deployment.
Key Gap Drivers are addressed through a consistent transaction boundary, market-specific demand inputs and cross-checks across the study. A second review checks definitions, units, currency, geography, period alignment and arithmetic, and analysts re-contact a source or respondent when a material discrepancy, unclear product boundary or changed forecast driver could alter the estimate.
Benchmark comparison
| Source | Market Size | Gaps in Research Methodology |
|---|---|---|
| Mordor Intelligence | USD 85.28 B (2027) | |
| Global Consultancy A | USD 77.1 B (2025) | At its 2025 base, this estimate is 9.6% below this report's 2027 value of USD 85.28 B, 2 years later. The page labels the measure ERP software, while this market also includes ERP-specific services. |
| Industry Research Publisher B | USD 55-60 B (2026) | The page does not specify whether ERP-specific services are counted. |
Mordor Intelligence ties the estimate to the study’s defined coverage and demand model. A second review checks definitions, units, currency, geography, period alignment and arithmetic, and analysts re-contact a source or respondent when a material discrepancy, unclear product boundary or changed forecast driver could alter the estimate.
Key Questions Answered in the Report
What is the Enterprise Resource Planning market size and growth outlook?
The estimated size is USD 78.15 billion in 2026, with USD 85.28 billion projected for 2027 and USD 133.3 billion for 2032. The forecast CAGR is 9.35% from 2027 to 2032.
What is driving demand for ERP software?
Cloud migration, scalable services and structured e-invoicing support demand. Belgium has required structured invoices for transactions between Belgian VAT-liable enterprises since January 1, 2026.
Which offering leads ERP revenue?
Solutions led with 57.13% of revenue in 2026. Services are forecast to be the fastest-growing offering, with a CAGR of 14.08% from 2027 to 2032.
Which companies compete in ERP software?
Major competitors include Microsoft Corporation, SAP SE, Infor Inc., Oracle Corporation and Sage Group plc.
What is a major challenge for ERP migration?
In SAPinsider's December 2025 to March 2026 survey, 63% of respondents with no SAP S/4HANA plans cited increased cloud infrastructure and deployment costs as an implementation barrier.
Which regions lead ERP demand and forecast growth?
North America led with 33.63% of revenue in 2026. Asia-Pacific is forecast to be the fastest-growing region, with a CAGR of 12.15% from 2027 to 2032.