Enterprise Service Bus Software Market Size and Share
Market Overview
| Study Period | 2019 - 2030 |
|---|---|
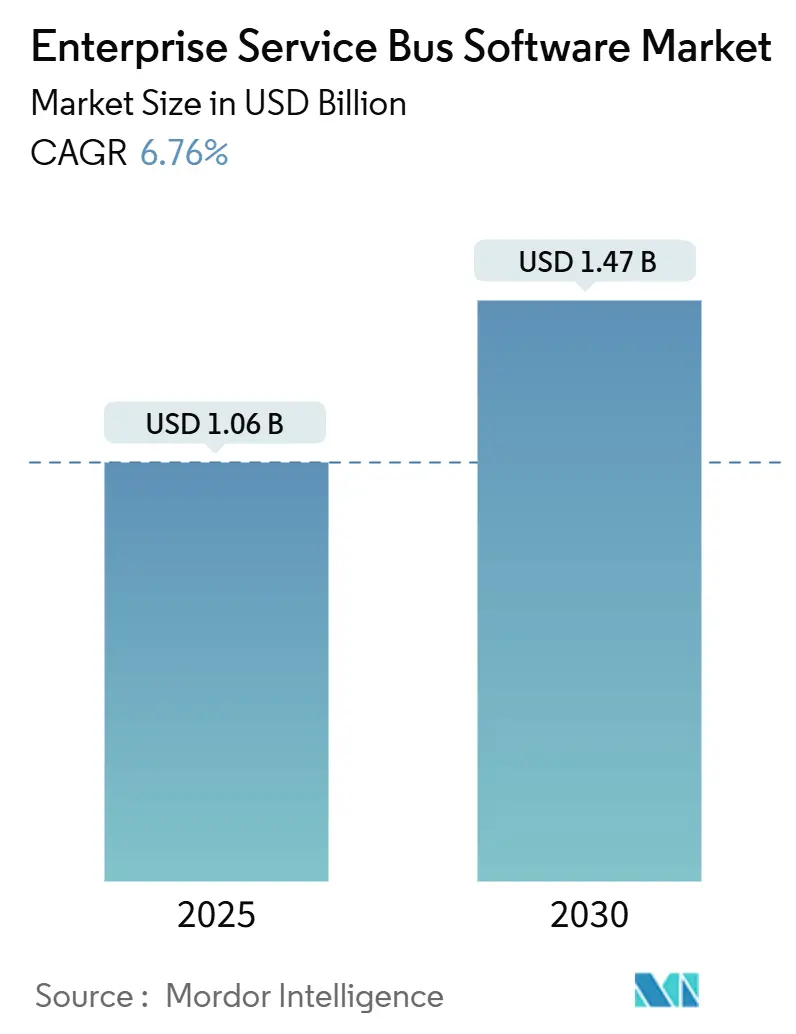
| Market Size (2025) | USD 1.06 Billion |
| Market Size (2030) | USD 1.47 Billion |
| Growth Rate (2025 - 2030) | 6.76% CAGR |
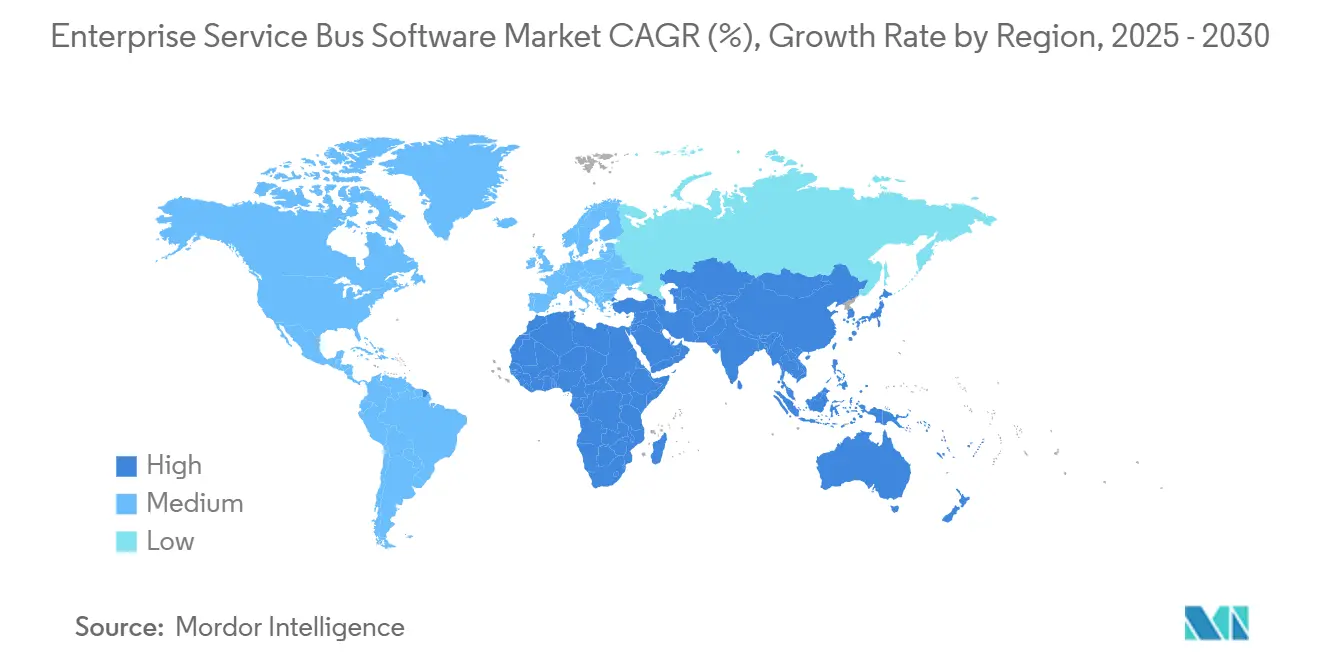
| Fastest Growing Market | Asia Pacific |
| Largest Market | North America |
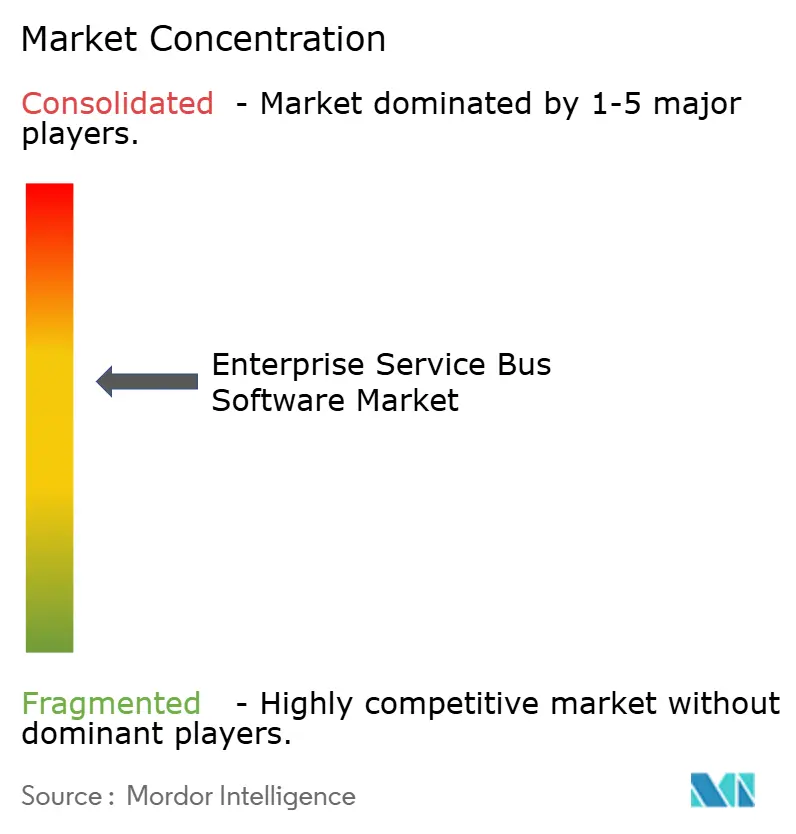
| Market Concentration | Medium |
Major Players *Disclaimer: Major Players sorted in no particular order Image © Mordor Intelligence. Reuse requires attribution under CC BY 4.0. | |
Enterprise Service Bus Software Market Analysis by Mordor Intelligence
The Enterprise Service Bus Software market size stands at USD 1.06 billion in 2025 and is forecast to reach USD 1.47 billion by 2030, reflecting a 6.76% CAGR. This steady pace signals a sector balancing legacy, on-premises investments with cloud-native alternatives that promise lower operating costs and faster iteration cycles. Demand rises as microservices, real-time data streaming, and government-led digital agendas widen the integration gap that point-to-point APIs cannot bridge. Vendors differentiate on compliance credentials, embedded AI assistance, and pre-built vertical connectors, while buyers weigh total cost of ownership, data-residency mandates, and scarce integration talent. Competitive intensity remains moderate, with the top five providers collectively under the 50% mark, leaving room for open-source and regional specialists to win workloads in fast-growing geographies.
Key Report Takeaways
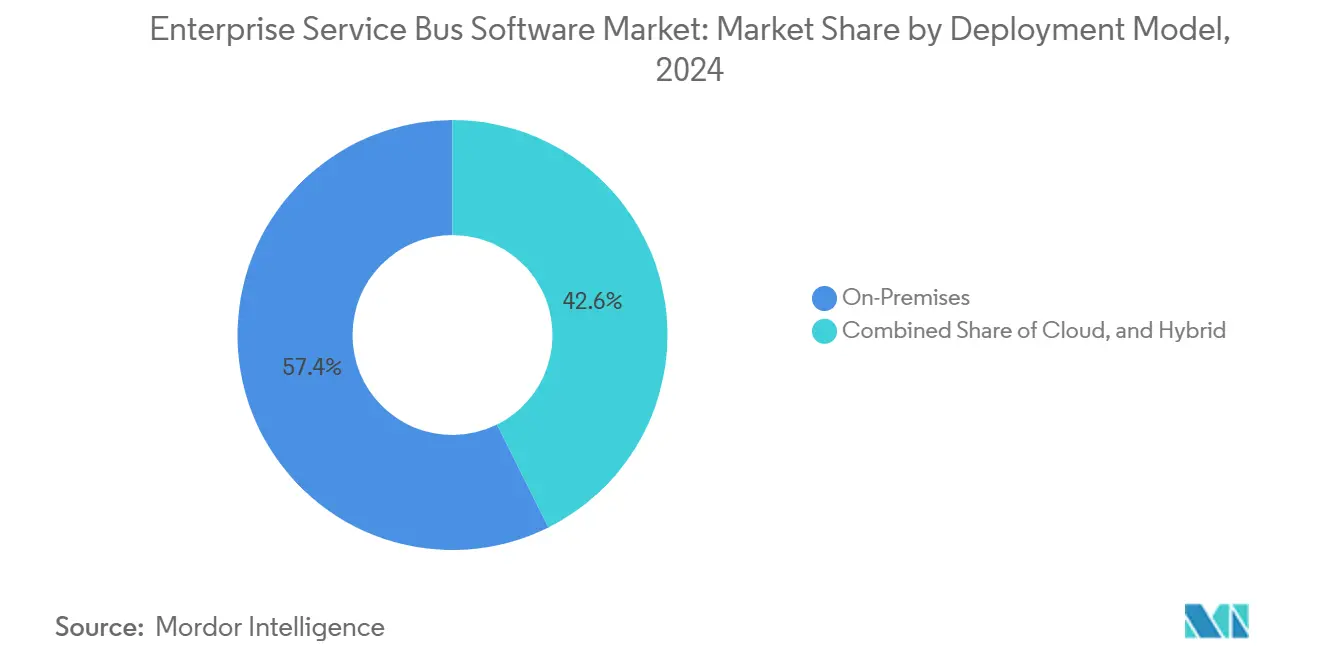
- By deployment model, On-Premises installations led with 57.36% revenue share in 2024, while Hybrid architectures are advancing at an 8.46% CAGR to 2030.
- By organization size, large enterprises held 68.37% of the Enterprise Service Bus Software market share in 2024; small and Medium Enterprises are expected to expand at a 7.81% CAGR through 2030.
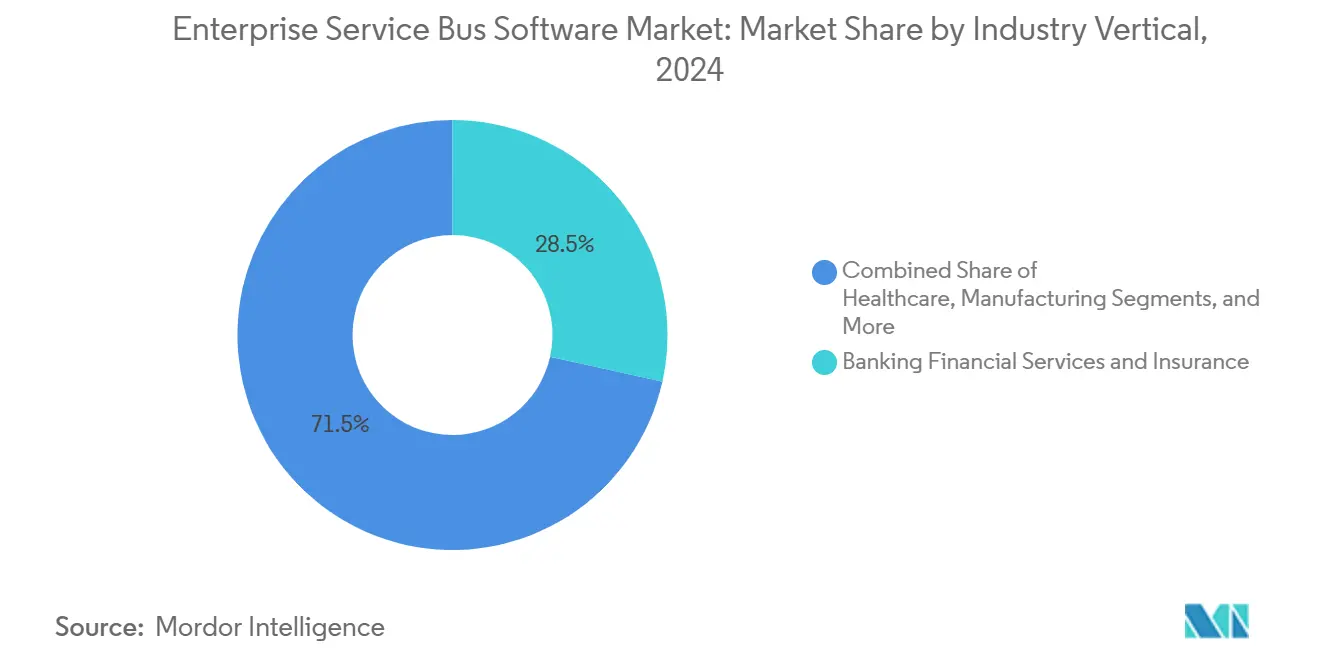
- By industry vertical, Banking Financial Services and Insurance accounted for 28.48% share of the Enterprise Service Bus Software market size in 2024 and Healthcare is projected to grow at an 8.67% CAGR through 2030.
- By component, Software licenses commanded 71.24% of 2024 revenue, whereas Services are growing at a 7.93% CAGR to 2030.
- By geography, North America contributed 34.29% share in 2024 and Asia-Pacific is forecast to rise at an 8.74% CAGR through 2030.
Global Enterprise Service Bus Software Market Trends and Insights
Drivers Impact Analysis*
| Driver | (~) % Impact on CAGR Forecast | Geographic Relevance | Impact Timeline |
|---|---|---|---|
| Increasing Adoption of Microservices Architecture Among Large Enterprises | +1.2% | Global, concentrated in North America and Europe | Medium term (2-4 years) |
| Rise of Hybrid and Multi-Cloud Integration Needs | +1.4% | Global, particularly North America and Asia-Pacific | Short term (≤ 2 years) |
| Growing Demand for Real-Time Data Streaming Across Heterogeneous Applications | +1.1% | Global, with early traction in BFSI and IT-Telecommunications sectors | Medium term (2-4 years) |
| Acceleration of Digital Transformation Initiatives Post-Pandemic | +0.9% | Global, strongest in Asia-Pacific and Middle East | Short term (≤ 2 years) |
| Expansion of IoT Ecosystems Requiring Scalable Integration Backbones | +0.8% | Global, led by Manufacturing and Smart City projects in APAC | Long term (≥ 4 years) |
| Emergence of Event-Driven Business Models in Financial Services | +0.7% | North America and Europe, expanding to Middle East | Medium term (2-4 years) |
| Source: Mordor Intelligence | |||
Increasing Adoption of Microservices Architecture
Fortune-scale firms decomposing monoliths find that legacy SOAP services still funnel through an Enterprise Service Bus (ESB) software market gateway because service meshes cannot provide audit-grade logging on their own.[1] IEEE Software, “Microservices Migration Patterns in Enterprise Systems,” ieee.org Vendors now bundle Istio-compatible adapters to mediate traffic between cloud-native and mainframe environments within the same runtime. Financial institutions adopt this hybrid approach because regulators require a single, unified source of truth for transaction logs. Retailers often follow a similar pattern when reconciling historical ERP data with containerized order-management platforms. Though the shift is gradual, it sustains license renewals and consulting demand, lifting growth by roughly 1.2 percentage points.
Rise of Hybrid and Multi-Cloud Integration Needs
Enterprises pursuing multi-cloud avoid lock-in but inherit complex traffic rules that a conventional API gateway cannot orchestrate at scale. ESB platforms equipped with policy-based routing satisfy sovereign cloud, encryption, and audit demands in the same deployment. Europe’s Data Governance Act and China’s Personal Information Protection Law intensify this requirement, accelerating upgrades during the next two years. Vendors with ISO 27001 and SOC 2 certifications win share because compliance due-diligence shortens procurement cycles.
Growing Demand for Real-Time Data Streaming Across Heterogeneous Applications
Sub-second event pipelines redefine value propositions once centered on batch ETL. JPMorgan Chase processes billions of fraud-monitoring events daily through an ESB layer infused with Apache Kafka, confirming that real-time routing is indispensible for regulated workloads. Retailers follow suit, merging inventory feeds, point-of-sale data, and e-commerce orders into single streams that trigger price engines. Telecom operators apply the same playbook to network-slice orchestration. These use cases collectively contribute 1.1 percentage points to growth.
Acceleration of Digital Transformation Initiatives Post-Pandemic
Public-sector digitization compresses timelines that private industries once set over a decade. India’s Unified Payments Interface crossed 11 billion transactions in December 2024, enabled by ESB nodes that federate more than 400 banks under uniform APIs. Saudi ministries follow with mandates that every agency expose data services by 2025.[2]Saudi Vision 2030, “Digital Transformation Program,” vision2030.gov.sa Such government programs lock ESB adoption into capital budgets, especially in Asia-Pacific and the Gulf Cooperation Council, adding 0.9 percentage points to the worldwide CAGR.
Restraints Impact Analysis*
| Restraint | (~) % Impact on CAGR Forecast | Geographic Relevance | Impact Timeline |
|---|---|---|---|
| High Initial Licensing and Implementation Costs for ESB Platforms | -0.8% | Global, most acute in Small and Medium Enterprises segment and emerging markets | Short term (≤ 2 years) |
| Skills Shortage in Advanced Integration and API Management | -0.6% | Global, particularly severe in Asia-Pacific, Latin America, and Africa | Medium term (2-4 years) |
| Shift Toward Lightweight iPaaS and API Gateways Reducing Need for Full ESB | -0.7% | North America and Europe, concentrated in cloud-native startups and digital-first enterprises | Medium term (2-4 years) |
| Rising Security Complexities in Decentralized Integration Architectures | -0.5% | Global, with heightened concern in Banking Financial Services and Insurance, Healthcare, and Government sectors | Long term (≥ 4 years) |
| Source: Mordor Intelligence | |||
High Initial Licensing and Implementation Costs for ESB Platforms
Annual subscription fees often start above USD 300,000, with first-year professional services frequently doubling that outlay. Firms under 5,000 employees pause projects when cost projections eclipse available capital, particularly in Latin America where currency fluctuation magnifies USD invoices. Vendors counter with consumption-based plans; however, customers risk unpredictable bills during high-season traffic spikes. The price barrier currently removes about 0.8 percentage points from potential growth.
Skills Shortage in Advanced Integration and API Management
Integration architects command premium salaries yet remain scarce, especially in emerging Asia where university curricula still emphasize monolith design. The Linux Foundation notes that 61% of enterprises report vacancies older than six months for such roles. Low-code and AI-assisted tooling narrows the gap but introduces governance risk when citizen developers misconfigure connectors. The shortage trims roughly 0.6 percentage points from addressable expansion, a drag unlikely to resolve before 2028.
*Our forecasts treat driver/restraint impacts as directional, not additive. The impact forecasts reflect baseline growth, mix effects, and variable interactions.
Segment Analysis
By Deployment Model: Hybrid Architectures Reconcile Sovereignty and Scale
Hybrid configurations hold the fastest trajectory, expanding at 8.46% CAGR as firms marry cloud scale with data-sovereignty obligations. On-Premises still dominated with 57.36% revenue in 2024, a figure rooted in sunk costs, security rules, and air-gap mandates across defense and public utilities. Financial institutions exemplify hybrid momentum after Oracle disclosed that nearly half of its Integration Cloud deals now include on-premises nodes for sensitive payloads.[3]Oracle Investor Relations, “Fiscal 2024 Earnings Release,” oracle.com
The Enterprise Service Bus Software market responds by embedding policy engines that persist master records in local data centers while streaming anonymized subsets to analytic clouds. European and Chinese regulators enforce localization statutes that pure-cloud offerings cannot satisfy. Consequently, vendors fortify hybrid blueprints with encryption-in-transit, data-lineage tracking, and unified dashboards.


By Organization Size: SMEs Leverage Consumption Pricing to Close the Gap
Although Large Enterprises commanded 68.37% revenue in 2024, SMEs add the highest velocity at 7.81% CAGR, driven by transaction-tiered billing below USD 5,000 per month. Retail startups connect Shopify, Salesforce, and QuickBooks without bespoke code, accelerating time-to-value. Large Enterprises plateau as core use cases saturate, shifting focus to observability and API management.
The Enterprise Service Bus Software market benefits when midsize manufacturers, logistics firms, and fintechs comply with API-based tax and payments mandates. Asia-Pacific shows the strongest SME uptake because government digital programs oblige even microbusinesses to expose standardized data feeds. Vendor roadmaps now prioritize guided wizards, pre-built SaaS connectors, and AI-assisted mapping to lower entry hurdles.
By Industry Vertical: Healthcare Interoperability Mandates Drive Fastest Expansion
Banking Financial Services and Insurance remained the largest slice at 28.48% during 2024, yet Healthcare is outpacing all peers with an 8.67% CAGR through 2030. U.S. providers must expose electronic health records over HL7 FHIR APIs or risk million-dollar penalties. Similar rules emerge in the European Health Data Space. ESB solutions translate HL7 v2 messages into RESTful formats, route them through consent checkpoints, and log immutable audit trails, lifting adoption across hospitals and laboratory networks.
Other sectors follow distinct triggers. Telecom operators synchronize 5G core events with edge clouds. Manufacturers bridge OPC UA shop-floor telemetry with ERP systems to predict downtime. Governments enforce zero-trust segmentation yet demand agency-wide data sharing, a paradox neatly handled by ESB policy engines. Each domain contributes incremental workloads that collectively widen the Enterprise Service Bus Software market size.
By Component: Services Outpace Software as Complexity Shifts Downstream
Software captured 71.24% of 2024 revenue, but Services grow faster at 7.93% through 2030 as value migrates to implementation expertise. IBM reports that integration contracts now average 3.2 times license spend, underscoring the shift from product features to delivery accountability. Projects stretch nine to 12 months for enterprises owing to API version conflicts and data-quality remediation.
Managed services gain traction among mid-market buyers that lack 24/7 operations teams. Providers guarantee 99.9% uptime, shoulder incident response, and supply capacity forecasts that align with consumption pricing. Consequently, the Enterprise Service Bus Software market share for pure software is expected to decline incrementally as integrators and consultancies absorb work previously handled in-house.
Geography Analysis
North America retained 34.29% share in 2024, powered by instant payment rails such as FedNow, which enforces sub-2-second settlement windows and ISO 20022 message formats.[4]Federal Reserve, “FedNow Service Overview,” frbservices.org U.S. healthcare providers race to meet information-blocking fines, while Canadian and Mexican banks front-load ESB investment ahead of open-data laws. Regulatory clarity, deep budgets, and a mature vendor ecosystem sustain steady but moderate growth.
Asia-Pacific posts the fastest 8.74% CAGR through 2030, reflecting massive government digital budgets. China earmarks USD 1.4 trillion for cloud migration of state-owned enterprises, compressing ESB cycle times. India’s GST network unifies 36 state tax systems via ESB mediation, processing billions of invoices monthly. Japan’s Digital Agency imposes API-first design for all services, while Australia’s Consumer Data Right forces banks to publish real-time customer data feeds. Manufacturing powerhouses in South Korea deploy ESBs at plant level to fuse operational technology with enterprise analytics.
Europe advances amid tightening cyber-resilience rules. The Digital Operational Resilience Act demands continuous testing of third-party integration touchpoints by January 2025. United Kingdom post-Brexit divergence requires dual data pipelines to satisfy EU and domestic statutes. In the Middle East, Saudi Vision 2030 and the UAE Digital Government Strategy channel funds into smart-city backbones. Africa’s momentum centers on South Africa, where payment modernization mandates real-time settlement by 2025. Latin America faces currency volatility, but Brazil’s Pix system still yields national-scale ESB workloads that validate future demand.

Competitive Landscape
The Enterprise Service Bus Software market shows moderate fragmentation. IBM, Oracle, Microsoft, TIBCO, and MuleSoft together hold about 48% share, enabling challengers like Boomi, SnapLogic, WSO2, and Red Hat to capture niche demand. Incumbents lean on compliance portfolios and global support desks. Disruptors embed generative AI that converts plain-language intents into executable flows, shrinking configuration times but raising governance concerns over hallucinated mappings.
Vertical-specific connectors, AI-assisted design, and consumption billing. Salesforce poured USD 500 million into MuleSoft to auto-generate API specs and connectors, promising a 40% cut in development effort. Microsoft wires Copilot into Azure Integration Services to target citizen integrators. IBM registered quantum-safe middleware encryption in 2024.
Open-source options accelerate in price-sensitive regions. WSO2 Micro Integrator starts under two seconds and slots into container clusters, a feature prized by microservices teams. Red Hat Fuse gains traction on Kubernetes Operator automation, aligning with GitOps pipelines. Meanwhile, clients seek embedded observability to trace transactions end-to-end without layering separate APM tools. Vendors that merge ESB and distributed tracing stand to gain wallet share as hybrid traffic complexity intensifies.
Enterprise Service Bus Software Industry Leaders
IBM Corporation
Oracle Corporation
Microsoft Corporation
TIBCO Software Inc.
MuleSoft LLC
- *Disclaimer: Major Players sorted in no particular order

Recent Industry Developments
- September 2024: Salesforce announced a USD 500 million expansion of its MuleSoft platform, adding generative AI that auto-creates API specifications and 200 new SaaS connectors, targeting enterprises with large API inventories.
- August 2024: Microsoft integrated Azure Integration Services with Copilot, letting developers describe workflows in natural language and receive auto-generated Logic Apps spanning over 1,000 connectors.
- July 2024: IBM completed its USD 2.3 billion acquisition of StreamSets and webMethods, folding both into Cloud Pak for Integration to deepen data-integration and API-management capabilities.
- June 2024: Oracle released Integration 3.0 with embedded Kafka clusters and real-time stream processing for sub-100-millisecond latency use cases in finance and telecom.


Global Enterprise Service Bus Software Market Report Scope
The Enterprise Service Bus (ESB) Software Market encompasses platforms and services that integrate disparate applications and data sources through a unified communication backbone within enterprise IT environments. It includes deployment models such as on-premises, cloud, and hybrid, serving both large enterprises and SMEs across industries like BFSI, IT and telecom, retail and eCommerce, healthcare, manufacturing, and government and defense. The market covers both software and services components, reflecting the broad ecosystem required for seamless system interoperability.
The Enterprise Service Bus Software Market Report is Segmented by Deployment Model (On-Premises, Cloud, Hybrid), Organization Size (Large Enterprises, Small and Medium Enterprises), Industry Vertical (Banking Financial Services and Insurance, IT and Telecommunications, Retail and eCommerce, Healthcare, Manufacturing, Government and Defense), Component (Software, Services), and Geography (North America, South America, Europe, Asia-Pacific, Middle East and Africa). The Market Forecasts are Provided in Terms of Value (USD).
| On-Premises |
| Cloud |
| Hybrid |
| Large Enterprises |
| Small and Medium Enterprises |
| Banking Financial Services and Insurance |
| IT and Telecommunications |
| Retail and eCommerce |
| Healthcare |
| Manufacturing |
| Government and Defense |
| Software |
| Services |
| North America | United States | |
| Canada | ||
| Mexico | ||
| South America | Brazil | |
| Argentina | ||
| Rest of South America | ||
| Europe | United Kingdom | |
| Germany | ||
| France | ||
| Spain | ||
| Italy | ||
| Rest of Europe | ||
| Asia-Pacific | China | |
| India | ||
| Japan | ||
| Australia | ||
| South Korea | ||
| Rest of Asia-Pacific | ||
| Middle East and Africa | Middle East | Saudi Arabia |
| United Arab Emirates | ||
| Turkey | ||
| Rest of Middle East | ||
| Africa | South Africa | |
| Kenya | ||
| Rest of Africa | ||
| By Deployment Model | On-Premises | ||
| Cloud | |||
| Hybrid | |||
| By Organization Size | Large Enterprises | ||
| Small and Medium Enterprises | |||
| By Industry Vertical | Banking Financial Services and Insurance | ||
| IT and Telecommunications | |||
| Retail and eCommerce | |||
| Healthcare | |||
| Manufacturing | |||
| Government and Defense | |||
| By Component | Software | ||
| Services | |||
| By Geography | North America | United States | |
| Canada | |||
| Mexico | |||
| South America | Brazil | ||
| Argentina | |||
| Rest of South America | |||
| Europe | United Kingdom | ||
| Germany | |||
| France | |||
| Spain | |||
| Italy | |||
| Rest of Europe | |||
| Asia-Pacific | China | ||
| India | |||
| Japan | |||
| Australia | |||
| South Korea | |||
| Rest of Asia-Pacific | |||
| Middle East and Africa | Middle East | Saudi Arabia | |
| United Arab Emirates | |||
| Turkey | |||
| Rest of Middle East | |||
| Africa | South Africa | ||
| Kenya | |||
| Rest of Africa | |||


Key Questions Answered in the Report
What is the forecast value of the Enterprise Service Bus Software market by 2030?
It is expected to reach USD 1.47 billion, advancing at a 6.76% CAGR.
Which deployment model is expanding the fastest?
Hybrid architectures lead with an 8.46% CAGR as firms balance cloud economics with data-sovereignty rules.
Why is Healthcare the quickest-growing vertical?
Interoperability mandates under the 21st Century Cures Act compel healthcare providers to expose patient data via standardized APIs, driving an 8.67% CAGR.
Which region shows the highest growth rate?
Asia-Pacific records the fastest expansion at an 8.74% CAGR due to large-scale government digitization projects.
How are vendors addressing the integration skills shortage?
Platforms embed AI-guided flow builders, low-code tooling, and consumption pricing to reduce technical barriers and attract citizen developers.
What strategic moves define competition in this market?
Investments in generative AI for integration design, acquisitions that fold data-integration and API-management assets into unified suites, and open-source releases optimized for Kubernetes are reshaping competitive dynamics.
Page last updated on:


