
Enterprise Application Integration Market Size and Share
Market Overview
| Study Period | 2020 - 2031 |
|---|---|
| Market Size (2026) | USD 20.39 Billion |
| Market Size (2031) | USD 41.79 Billion |
| Growth Rate (2026 - 2031) | 15.42 % |
| Fastest Growing Market | North America |
| Largest Market | North America |
| Market Concentration | Medium |
Major Players *Disclaimer: Major Players sorted in no particular order Image © Mordor Intelligence. Reuse requires attribution under CC BY 4.0. | |
Enterprise Application Integration Market Analysis by Mordor Intelligence
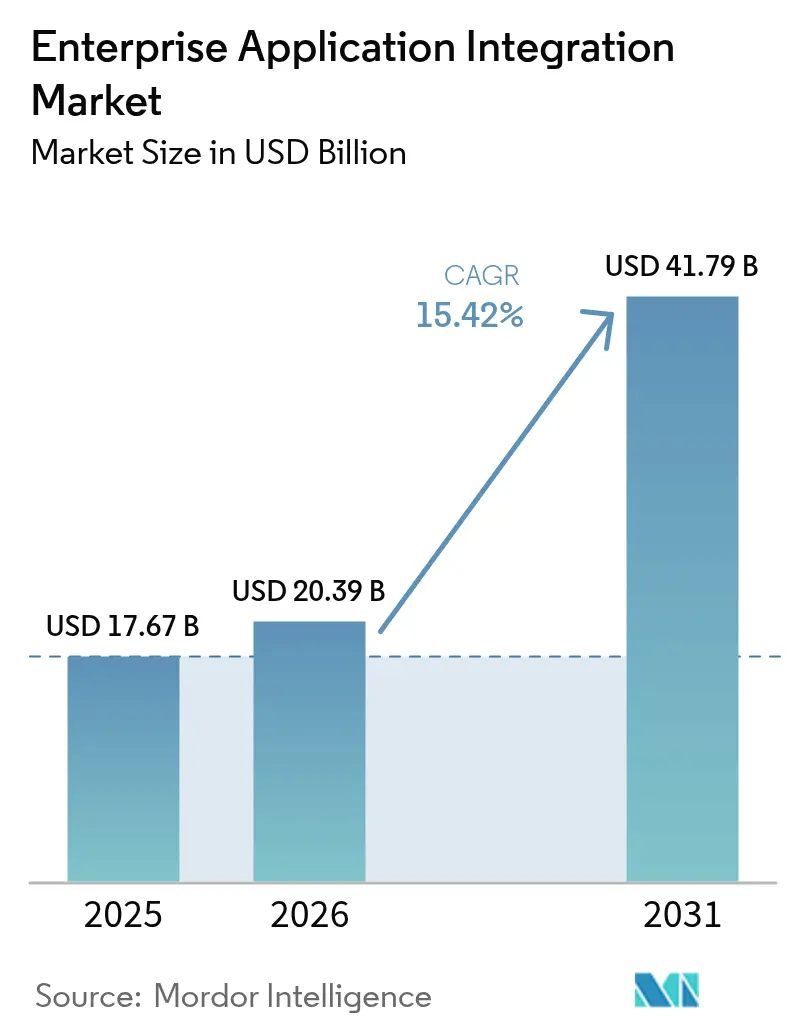
The enterprise application integration market size in 2026 is estimated at USD 20.39 billion, growing from 2025 value of USD 17.67 billion with 2031 projections showing USD 41.79 billion, growing at 15.42% CAGR over 2026-2031. The expansion is fueled by enterprises that now treat seamless data flow and application interoperability as critical competitive utilities. North America retains its leadership position because of large cloud budgets and mature API-first cultures, which accelerate adoption. At the same time, the Asia-Pacific region delivers the fastest gains as organizations leapfrog legacy systems and implement multi-cloud programs that demand event-driven and API-led integration patterns. A growing preference for low-code, self-service deployment is widening the user base beyond traditional IT departments, while AI-assisted mapping engines are compressing project timelines and redirecting scarce integration talent toward higher-value tasks. Heightened data-sovereignty regulations in Europe and carbon-aware workload routing mandates are also influencing platform selection, cementing hybrid architectures as the default for global roll-outs.
Key Report Takeaways
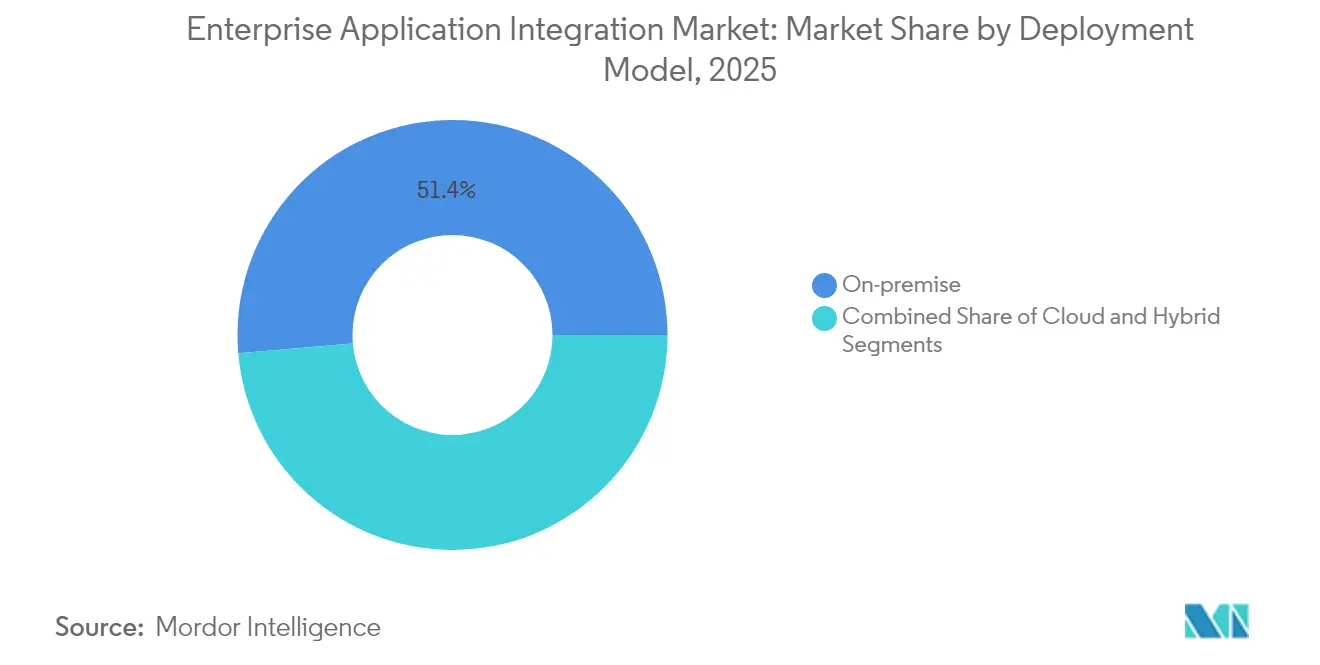
- By deployment model, on-premises held 51.35% share of the enterprise application integration market size in 2025, whereas hybrid deployments are forecast to expand at 17.78% CAGR through 2031.
- By platform type, iPaaS accounted for 33.10% share of the enterprise application integration market size in 2025, while cloud-native iPaaS is projected to register a 24.95% CAGR to 2031.
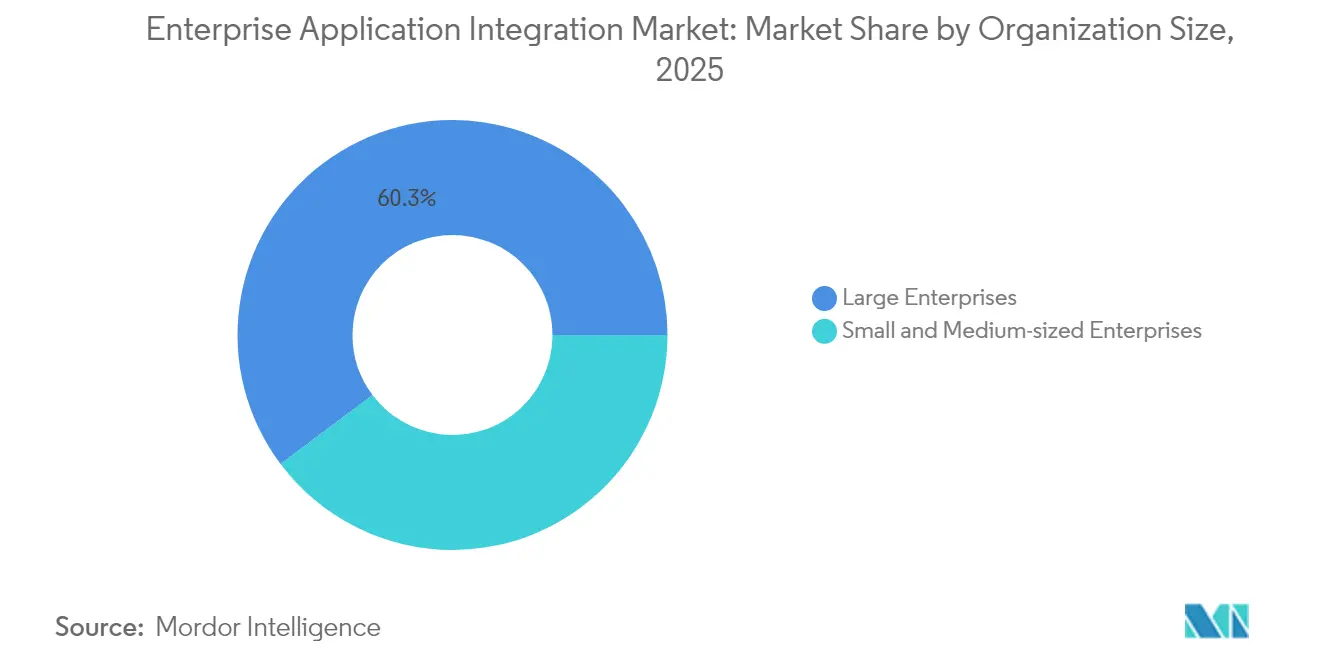
- By organization size, large enterprises generated 60.25% share of the enterprise application integration market size in 2025, however, small and medium enterprises are poised for the fastest growth, with a 21.65% CAGR through 2031.
- By application area, CRM integration led with a 28.30% share of the enterprise application integration market size in 2025, whereas business intelligence and analytics integration is projected to advance at a 23.35% CAGR to 2031.
- By end-user industry, BFSI led with a 53.20% share of the enterprise application integration market size in 2025, whereas the healthcare sector is projected to advance at a 16.88% CAGR from 2025 to 2031.
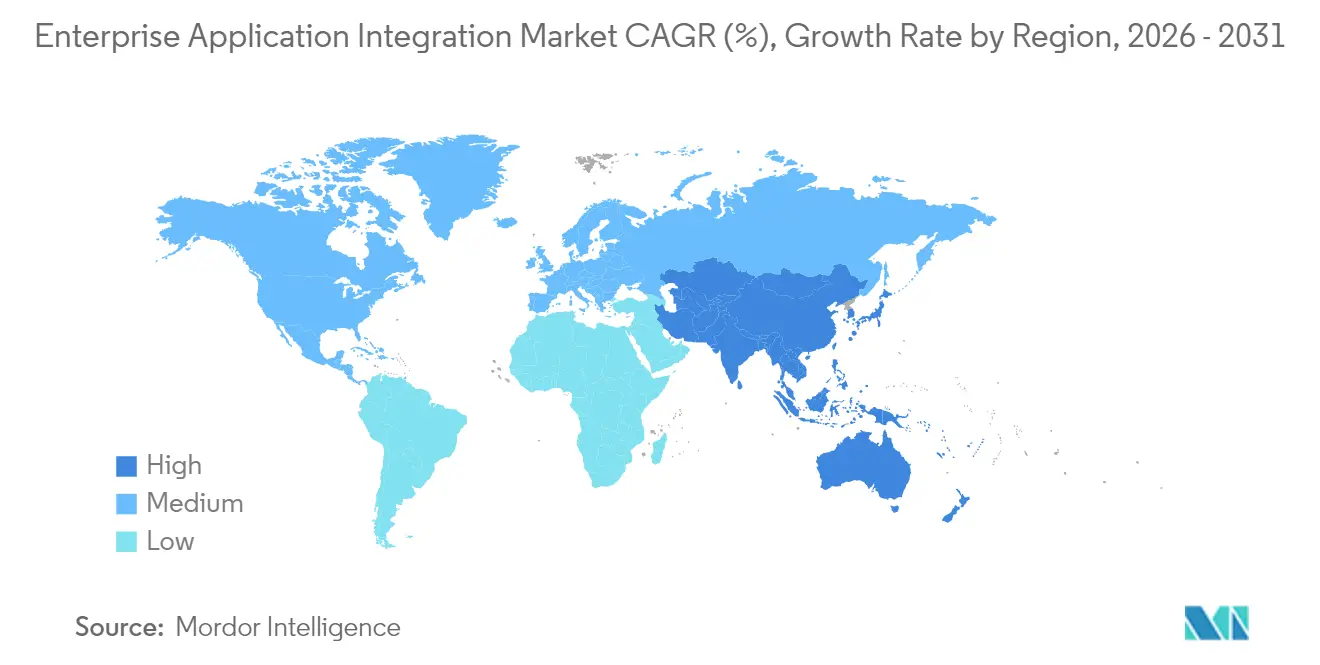
- By geography, North America accounted for 37.60% share of the enterprise application integration market size in 2025, the Asia-Pacific region is anticipated to post the fastest CAGR of 16.05% during the forecast period.
Note: Market size and forecast figures in this report are generated using Mordor Intelligence’s proprietary estimation framework, updated with the latest available data and insights as of 2026.
Market Trends and Insights
Drivers Impact Analysis of Enterprise Application Integration Market*
| Driver | (~) % Impact on CAGR Forecast | Geographic Relevance | Impact Timeline |
|---|---|---|---|
| API-led connectivity accelerating SaaS adoption | +3.20% | Global, with concentration in North America and Europe | Medium term (2-4 years) |
| Cloud-native iPaaS as de-facto integration backbone | +4.10% | Global, strongest in Asia-Pacific and North America | Long term (≥ 4 years) |
| Event-driven architectures enabling real-time analytics | +2.80% | Global, early adoption in BFSI and IT sectors | Medium term (2-4 years) |
| Generative-AI–assisted mapping and testing tools | +1.90% | North America and Europe, expanding to Asia-Pacific | Short term (≤ 2 years) |
| Carbon-aware workload routing mandates | +1.40% | Europe leading, North America following | Long term (≥ 4 years) |
| Vendor-agnostic integration marketplaces for micro-SaaS | +1.10% | Global, concentrated in mature markets | Medium term (2-4 years) |
| Source: Mordor Intelligence | |||


API-led Connectivity Accelerating SaaS Adoption
Reusable API assets now serve as strategic building blocks, shortening release cycles and reducing maintenance overhead. Enterprises adopting the model routinely report integration timeline cuts of 40-60%, which frees budget for incremental digital services. MuleSoft’s growth inside the Salesforce portfolio, combined with Microsoft’s expanding API gateway footprint, illustrates how large vendors are pivoting toward composable integration fabrics.[1]Salesforce, “MuleSoft Announces Latest API-led Innovations,” salesforce.com
Cloud-native iPaaS as De-facto Integration Backbone
Containerized microservices, serverless runtime engines, and automated elasticity enable cloud-native iPaaS platforms to deliver up to 70% total cost of ownership (TCO) savings compared to traditional middleware, as highlighted by Oracle in its recent cloud revenue disclosures.[2]Oracle Investor Relations, “Q1 FY 2025 Results,” oracle.com These economics, coupled with built-in observability and policy enforcement, are steering even risk-averse enterprises toward multi-cloud integration fabrics.
Event-Driven Architectures Enabling Real-time Analytics
Streaming brokers and durable queues let systems respond to business events in milliseconds, supporting real-time fraud detection, supply-chain reprioritization, and instant personalization. Banks deploying Kafka-based architectures confirm measurable drops in fraud losses and gains in customer satisfaction when paired with machine learning pipelines.
Generative-AI-Assisted Mapping and Testing Tools
Integration teams now leverage large language models that read source and target schemas, auto-generate transformation logic, and create test harnesses. IBM’s recent incorporation of HashiCorp assets underscores the strategy of wrapping AI around infrastructure-as-code to shrink build cycles and uplift data quality.[3]IBM Newsroom, “StreamSets Joins IBM Data and AI,” ibm.com Early adopters cite 30-50% reductions in development effort.
Restraints Impact Analysis of Enterprise Application Integration Market*
| Restraint | (~) % Impact on CAGR Forecast | Geographic Relevance | Impact Timeline |
|---|---|---|---|
| Open-source ESB alternatives eroding licence revenue | -2.10% | Global, strongest impact in cost-sensitive markets | Medium term (2-4 years) |
| Shortage of integration-skill talent inflating project costs | -1.80% | Global, acute in North America and Europe | Long term (≥ 4 years) |
| Hidden egress-fee economics in hyperscale clouds | -1.30% | Global, particularly affecting multi-cloud strategies | Short term (≤ 2 years) |
| Legacy technical-debt penalties on API security posture | -1.10% | Global, concentrated in established enterprises | Long term (≥ 4 years) |
| Source: Mordor Intelligence | |||
Open-source ESB Alternatives Eroding License Revenue
Apache Camel, WSO2, and similar frameworks offer robust integration without licensing costs, appealing to organizations with capable internal engineering teams. Commercial platforms, therefore, emphasize differentiated AI orchestration, managed services, and security certifications in order to justify premium tiers.[4]WSO2 Press Center, “WSO2 Integration Platform Milestones,” wso2.com
Shortage of Integration-Skill Talent Inflating Project Costs
A limited pool of professionals who understand cloud-native architecture, event streaming, and zero-trust security drives consulting rates up and lengthens projects. Vendors counter this by embedding low-code tooling and guided wizards that enable citizen integrators to build flows and enforce policies, as seen in Microsoft’s Power Platform enhancements.
*Our forecasts treat driver/restraint impacts as directional, not additive. The impact forecasts reflect baseline growth, mix effects, and variable interactions.
Enterprise Application Integration Market Segment Analysis
By Deployment Model:
Hybrid Solutions Bridge Legacy-Cloud DivideHybrid environments accounted for 17.78% CAGR, evidencing the architectural sweet spot between on-premise control and cloud agility. The enterprise application integration market size tied to hybrid roll-outs will likely surpass on-premise outlays after 2027, as migration risk is mitigated while cloud services continue to improve their economics. Banks and regulated healthcare providers integrate mainframes with SaaS by dropping lightweight connectors into private clouds and linking them via secure VPN or SD-WAN tunnels. Deployment toolkits that bundle policy-driven routing, encryption, and real-time observability reduce operational friction, making hybrid integration attractive for continuous regulatory reporting. IBM bundled its recently acquired HashiCorp Terraform modules to automate cluster provisioning across clouds, which simplifies governance for global corporations.
Despite ongoing dominance, on-premise implementations are evolving rather than fading. Organizations migrate their foundational message buses toward container platforms on internal Kubernetes clusters, refreshing hardware only where latency or sovereignty requirements necessitate local processing. This incremental modernization prevents wholesale rip-and-replace projects, lowers capex surprises, and maintains continuity for mission-critical workflows that cannot risk outage windows longer than a few seconds. For global manufacturers, local integration appliances in factories offer deterministic latency while cloud event hubs aggregate data for predictive analytics models.


By Integration Platform Type:
iPaaS Dominance Accelerates Cloud-Native TransitioniPaaS generated 33.10% revenue in 2025 and sits at the center of enterprise blueprints that prioritize subscription economics over perpetual licenses. The segment’s 24.95% CAGR is underpinned by continuous connector library expansion, managed runtime patches, and SLA-bound uptime commitments that free customers from the burdens of middleware patching. Microsoft, Oracle, SAP, and Salesforce deliver bundled iPaaS capability directly in their cloud suites, reducing procurement steps and providing consistent identity models across application layers.
Conversely, ESB platforms retain hold in complex hub-and-spoke topologies within telecom carriers and defense contractors. Vendors supporting these estates now ship containerized runtimes that run inside Kubernetes, thereby easing the lift-and-shift to private clouds when a data center exit is mandated. Data integration tools with pushdown ELT pipelines also claim relevance by feeding lakehouse architectures that demand high-throughput batch ingestion.
By Organization Size:
SME Adoption Democratizes Integration CapabilitiesCRM synchronization produced the greatest contribution to the enterprise application integration market size in 2025, as sales, service, and marketing teams unify customer profiles for omnichannel engagement. However, BI and analytics integration will witness the quickest expansion at a 23.35% CAGR, as leadership teams demand unified data pipelines that feed dashboards, predictive models, and generative AI assistants in near real-time. Data mesh principles proliferate when domain teams publish governed data products through APIs. Integration platforms provide policy engines that enforce lineage, quality, and access, ensuring that analytics conclusions remain trustworthy.
Supply-chain and logistics integration ranks high on the priority list due to geopolitical disruptions that expose visibility gaps. Retailers connect warehouse robots, transportation management, and inventory/ordering modules to rebalance stock in hours rather than weeks. ERP and finance connectors enforce dual entries across legacy general ledger systems and modern SaaS billing, reducing reconciliation cycles from days to minutes. HR integration gains ground as remote work enlarges compliance footprints across multiple countries, compelling automated payroll and benefits data handoffs.
By End-user Industry:
BFSI Leads Digital Transformation InvestmentBFSI dominates spending because real-time risk assessment, open-banking APIs, and anti-money-laundering compliance demand performant integration. The enterprise application integration market share attributed to BFSI is expected to remain prominent through 2031 as payment modernization and ISO 20022 migrations intensify. Financial institutions embed event streaming for instant settlement, feeding downstream fraud models that trigger within seconds. API management layers enable monetization of banking APIs for partners while ensuring throttling and consent management remain compliant.
Healthcare accelerates adoption as telemedicine, electronic health record data exchange, and updated HIPAA guidelines require secure interoperability. Providers are increasingly deploying FHIR-compliant APIs, mapped through iPaaS, to ensure that prescription data flows to pharmacies in real-time. Retail, e-commerce, and manufacturing follow closely, aiming for hyper-personalized shopper journeys and smart factory rollouts that rely on bidirectional integration between operational technology and IT systems. Government digital-service agendas push agencies to expose reusable APIs, often guided by zero-trust security architectures mandated by regulatory frameworks.
Geography Analysis
North America Enterprise Application Integration Market
North America maintained a 37.60% revenue share in 2025, anchored by the United States, where hyperscale cloud regions, venture capital-funded SaaS ecosystems, and robust API economy cultures converge. Federal and state agencies also allocate funds to modernize procurement, taxation, and benefit systems, generating prolonged demand for secure integration gateways. Canada exhibits similar momentum but places a stronger emphasis on data residency, prompting the usage of local-region cloud zones and hybrid edge appliances. Mexico sits at an earlier stage yet climbs swiftly as enterprises modernize ERP and payment rails, often leveraging near-shore service providers that deliver integration services from bilingual talent hubs.
Broader European Markets
Europe represents a sizable opportunity, as the GDPR, the Digital Operational Resilience Act, and emerging carbon footprint disclosures guide platform audits. Germany’s automotive and industrial clusters deploy edge-to-cloud connectors that transport machine telemetry into predictive maintenance models. The United Kingdom finances open-banking roadmaps that enlarge the addressable pool for API management suites. France backs sovereign-cloud initiatives that favor European vendors bundling comprehensive compliance artefacts. Nordic countries, already mature in cloud adoption, pioneer carbon-aware routing where integration engines shift compute to regions with renewable energy availability during peak windows.
APAC Enterprise Application Integration Market
The Asia-Pacific region demonstrates the fastest growth, with a 16.05% CAGR through 2031, as enterprises skip legacy ESB generations and consume iPaaS directly. China invests in large-scale industrial Internet projects and AI acceleration chips that stream vast amounts of telemetry, requiring high-throughput integration fabrics. India’s digital-public-infrastructure stack, including Aadhaar and Unified Payments Interface, normalizes API consumption for millions of citizens and drives local SI firms to specialize in secure, high-volume connectors. Japan and South Korea are investing resources in smart factory initiatives, where edge brokers synchronize robots with ERP systems in real-time. Southeast Asian nations utilize cloud-first regulatory sandboxes to jump-start fintech innovation, creating niches for lightweight integration runtimes.

Regulatory Landscape
Enterprise application integration platforms operate under expanding privacy, operational resilience, and interoperability rules that directly affect API management, logging, and third-party controls. In the EU, the Interoperable Europe Act (Regulation (EU) 2024/903) introduces mandatory interoperability assessments into the lifecycle of trans-European digital public services, steering public-sector procurement toward documented integration patterns, reusable APIs, and standardized interfaces. Separately, DORA (Regulation (EU) 2022/2554) requires financial entities to maintain registers of ICT third-party contractual arrangements, which raises the need for auditable integration flows and centralized inventories of vendors, APIs, and data exchanges.
In the United States, healthcare interoperability requirements under the 21st Century Cures Act and related ONC rules continue to reinforce FHIR-based API exchange, so secure API gateways and governed data sharing remain a compliance requirement for many providers and payers. For BFSI, Financial Data Transparency Act (FDTA) implementation is progressing through joint regulator activity, with agencies finalizing data standards and interoperability approaches on a defined timeline. As AI-assisted mapping and testing tools become more common in integration programs, the EU AI Act adds documentation expectations (including annexes covering technical documentation and system integration context), increasing the importance of traceable, controlled integration changes around AI-enabled workflows.
Value Chain Analysis
The value chain starts with infrastructure and runtime foundations (cloud, containers, identity, and networking) and then moves into integration platform layers such as iPaaS, ESB runtimes, API gateways, event streaming, and data movement tools (ETL/ELT). Vendors package these capabilities into platforms with connector marketplaces, policy enforcement, observability, and developer tooling, delivering through direct enterprise sales, hyperscaler marketplaces, and channel partners. Systems integrators and managed service providers implement architecture, migration, and governance (API lifecycle, security, and operating models), while independent software vendors and SaaS providers support the ecosystem through certified connectors and templates.
Downstream, enterprise buyers operationalize integration through centers of excellence and citizen-integration programs, with deployment spanning on-premises, cloud, and hybrid footprints that must meet sector requirements (BFSI, government, and healthcare). B2B and multi-enterprise integration is a distinct chain segment where EDI, APIs, and managed file transfer converge into network-style onboarding, reflecting a shift from point-to-point projects to reusable, multi-party exchange models. Standards and frameworks shape this segment, including ISO/IEC 15944-1:2025 (Open-EDI business-operational requirements) and e-invoicing interoperability models such as Peppol-based approaches promoted by industry associations, which drive demand for canonical data models, partner onboarding automation, and compliance-grade message traceability. Legacy data silos, partner heterogeneity, and real-time visibility needs remain common bottlenecks, increasing the value of event-driven integration, prebuilt industry templates, and managed connectivity services.
Competitive Landscape
The landscape shows moderate fragmentation. IBM, Microsoft, Oracle, and SAP integrate their capabilities with adjacent products, such as analytics, security, and developer clouds, offering a bundled value proposition that minimizes vendor sprawl. IBM’s USD 6.4 billion purchase of HashiCorp extends its automation control plane, making multi-cloud provisioning and policy enforcement native functions within its integration suite. Microsoft amplifies the reach of the Power Platform by embedding Copilot-generated connectors, enabling business users to automate tasks without code while benefiting from Azure’s security posture.
Specialists like MuleSoft, Workato, SnapLogic, Celigo, and Jitterbit differentiate through rapid connector release cycles, intuitive UIs, and aggressive marketplace ecosystem expansion. They fill white spaces where customers require best-of-breed depth or industry templates that generalized mega-suites do not yet address. SnapLogic’s SOC 3 certification and ongoing FedRAMP efforts illustrate how challengers close compliance gaps to compete for regulated workloads. Meanwhile, private-equity-backed roll-ups, such as TIBCO and Talend, accelerate cross-selling into existing data-integration bases, forming mid-tier players with significant scale.
Blue Yonder’s acquisition of One Network Enterprises for USD 839 million foreshadows domain-specific integration packages that link supply-chain execution with planning suites. Systems integrators like NTT DATA supplement advisory arms through acquisitions of MuleSoft and analytics specialists, building service capacity to implement complex roadmaps.
Enterprise Application Integration Industry Leaders
IBM Corporation
Fujitsu Limited
Microsoft Corporation
MuleSoft LLC (Salesforce Inc.)
Oracle Corporation
- *Disclaimer: Major Players sorted in no particular order

Enterprise Application Integration Market Companies Covered in this Report
- IBM Corporation
- Microsoft Corporation
- Oracle Corporation
- SAP SE
- Salesforce Inc. (MuleSoft LLC)
- Software AG
- TIBCO Software Inc.
- Fujitsu Ltd.
- iTransition Group
- Dell Boomi LLC
- Informatica LLC
- SnapLogic Inc.
- Workato Inc.
- Celigo Inc.
- Jitterbit Inc.
- Talend S.A.
- Red Hat Inc.
- WSO2 Inc.
- Cleo Communications Inc.
- OpenLegacy Inc.

Market Opportunities and Future Outlook
A major opportunity area is standards-driven interoperability in regulated and public-infrastructure ecosystems, where machine-readable APIs, catalogs, and gateway-to-gateway trust become procurement and operational requirements. For example, Logius published Federated Service Connectivity (FSC) Core 2.0.0 in April 2026 to standardize automated, secure API-gateway interaction, creating whitespace for integration vendors and SIs to package compliant gateway automation, policy-as-code, and audit-ready traffic governance for government and adjacent regulated sectors.
Manufacturing and industrial data exchange is another expanding whitespace as operational technology and enterprise systems converge and require consistent semantics across suppliers, plants, and analytics stacks. CESMII released Industrial Information Interoperability eXchange (i3X) 1.0 in June 2026 as a production-ready API specification for manufacturing interoperability, reinforcing demand for connectors and mediation that map industrial data into ERP, supply-chain, and analytics applications. Across industries, the shift from basic connectivity to orchestration for AI-assisted and agent-style workflows raises demand for platforms that combine event-driven integration, API management, and governed data access, while keeping hybrid deployment viable for sovereignty, resilience, and latency constraints already visible in Europe-focused compliance drivers and BFSI-grade operational requirements.
Recent Industry Developments in Enterprise Application Integration Market
- July 2026: IBM introduced IBM DataPower Interact Gateway to govern AI interactions across APIs, applications, and data. The release extends API gateway roles into AI-era controls such as policy enforcement and oversight for governed interactions, which strengthens integration security and compliance positioning for regulated enterprises.
- August 2025: Oracle announced it will offer Google Gemini models to customers, extending access to third-party foundation models within Oracle environments. This move aligns AI consumption with existing Oracle data and integration stacks, supporting enterprises that want AI-enabled workflows without rebuilding integration patterns across clouds.
- July 2024: IBM completed its acquisition of StreamSets and webMethods, adding data ingestion and iPaaS capabilities to its automation, data, and AI portfolios. The combination broadened IBM's integration footprint across batch and streaming pipelines and increased competitive pressure on standalone integration vendors through more bundled platform offerings.


Enterprise Application Integration Market Report Scope and Research Methodology
Market Definition and Coverage
This market is defined as the revenue generated from enterprise application integration software and platforms that connect business applications and data so processes can run across systems, whether they are hosted on-premise, in cloud environments, or in hybrid setups.
Scope exclusions: We exclude general IT outsourcing and custom application development that do not primarily deliver integration software or integration platform functionality.
Segments Covered in This Report
- By Deployment Model
- On-premise
- Cloud
- Hybrid
- By Integration Platform Type
- Enterprise Service Bus (ESB)
- Integration Platform-as-a-Service (iPaaS)
- API-Gateway / Management Suites
- Data and ETL/ELT Tools
- By Organization Size
- Large Enterprises
- Small and Medium-sized Enterprises
- By Application Area
- CRM Integration
- ERP and Finance Integration
- Supply-Chain / Logistics Integration
- HR and Workforce Integration
- Business Intelligence and Analytics Integration
- By End-user Industry
- BFSI
- IT and Telecom
- Healthcare
- Retail and E-commerce
- Government
- Manufacturing
- Other End-user Industry
- By Geography
- North America
- United States
- Canada
- Mexico
- Europe
- Germany
- United Kingdom
- France
- Spain
- Italy
- Rest of Europe
- Asia-Pacific
- China
- Japan
- India
- South Korea
- Rest of Asia-Pacific
- South America
- Brazil
- Argentina
- Rest of South America
- Middle East and Africa
- Middle East
- Israel
- Saudi Arabia
- United Arab Emirates
- Turkey
- Rest of Middle East
- Africa
- South Africa
- Egypt
- Rest of Africa
- Middle East
- North America
Data Sources, Market Sizing, and Validation
Desk Research
To set the scope and build the first set of assumptions, we used public information that helps explain enterprise software adoption and integration demand. Sources used include items such as the US Bureau of Labor Statistics and US Census for IT spending signals, the International Telecommunication Union for connectivity indicators, the OECD for digital economy statistics, and standards bodies such as IETF and W3C to understand protocol and API direction that affects integration patterns.
We also reviewed company annual reports, investor presentations, product documentation, job postings, and reputable press coverage to understand pricing approaches (subscription versus license) and how deployments are shifting to cloud and hybrid. When needed, our analysts referenced paid subscriptions for company financials and intelligence, news and financials, and patent databases to cross-check product positioning and timing of new releases. These desk sources are not exhaustive, and many other public references were used for additional data collection, validation, and clarification.
Primary Interviews and Surveys
Primary work was used to test the desk assumptions and fill gaps that are not clearly stated in public sources, especially around typical contract sizing, deployment mix, and how buyers define integration versus adjacent software. We spoke with a mix of platform providers, system implementers, channel partners, and enterprise IT teams across APAC, EMEA, and the Americas so inputs reflect different buying cycles and regulatory environments.
Distribution of primary research fieldwork respondents
| Company type | Respondent position | Region |
|---|---|---|
| Top tier: 35% | CXOs: 14% | APAC: 43% |
| Mid tier: 45% | Functional/Unit leaders: 29% | EMEA: 32% |
| Smaller Players: 20% | Managers: 57% | Americas: 25% |
Market-Sizing & Forecasting
Sizing started with a top-down reconstruction of the addressable spend by linking enterprise software footprints and cloud adoption indicators to the share typically allocated to integration and interoperability needs. Once that demand pool was built, we corroborated it with selective bottom-up checks using sampled supplier revenues, channel checks on typical annual contract values, and volume approximations using customer counts by firm size, which were then used to adjust outliers.
Key model inputs included the share of enterprises running multi-cloud or hybrid environments, API management and middleware adoption rates, typical license or subscription price bands by deployment, integration workload intensity by industry, and implementation and maintenance attach rates that follow platform rollouts. Where bottom-up signals were incomplete for smaller geographies, gaps were handled through ratio-based scaling using regional enterprise counts and IT spending direction, followed by expert review to keep assumptions realistic.
For forecasting, scenario analysis was used and then anchored through a multivariate regression that linked growth to cloud migration pace, SaaS application growth, and compliance-driven integration needs. Assumptions were reviewed with primary respondents so the trajectory reflects practical constraints such as integration talent availability and longer replacement cycles for legacy middleware.
Data Validation & Update Cycle
Each output is checked against independent signals, such as enterprise software spending direction, cloud infrastructure growth, and the observed mix shift from on-premise to cloud and hybrid deployments. Large variances are investigated by revisiting scope fit, pricing assumptions, and regional allocation logic, and then the model is reviewed in multiple analyst passes before sign-off.
The report is refreshed annually, and interim updates are triggered when material events occur, such as major pricing changes, large platform launches, or regulatory shifts that alter integration demand. Before delivery, a final review pass is performed so the numbers reflect the latest available public indicators and validated interview feedback.
Mordor Intelligence's Enterprise Application Integration Market Sizing Compared With Other Published Estimates
Different published market values often move apart because they do not count the same products, and they also use different assumptions for cloud pricing progression and services attach rates. Some estimates also update currency conversion timing and base year assumptions differently, which can shift the starting value even if the long-term trend looks similar.
Some external totals blend adjacent categories like broader application integration services and general middleware revenues, which can lift the current-year figure. In Mordor Intelligence's model, revenue is counted only when it is tied to enterprise application integration software or platforms used to orchestrate workflows across applications and data stores, and pure services without that integration software core are left out.
Benchmark comparison
| Source | Market Size | Gaps in Research Methodology |
|---|---|---|
| Mordor Intelligence | USD 17.67 B (2025) | |
| Global Consultancy A | USD 17.94 B (2025) | Uses a similar year but tends to include a broader interpretation of integration that can pull in more API management and platform services, and the pricing curve appears to be smoothed over a longer forecast window. |
| Industry Publisher B | USD 23.01 B (2025) | A wider revenue net is applied that can capture additional middleware and integration-related services, and the regional growth mix assumptions are less transparent, which can push up the starting market value. |
Taken together, the spread is mainly explained by how tightly the scope is kept around integration platform revenues and how pricing and attach rates are handled for cloud deployments. By keeping the model tied to observable enterprise adoption indicators and then re-checking totals with practical contract and deployment inputs, the final number stays traceable and repeatable.


Key Questions Answered in the Report
What is the current value of the enterprise integration platform market and its expected growth?
The market is valued at USD 20.39 billion in 2026 and is forecast to reach USD 41.79 billion by 2031, reflecting a 15.42% CAGR.
Which platform type holds the largest revenue share?
Integration Platform-as-a-Service (iPaaS) leads with a 33.10% share in 2025 and maintains a strong growth trajectory.
Why are hybrid deployment models gaining momentum?
Hybrid architectures let enterprises retain on-premises governance while tapping cloud scalability, driving an 17.78% CAGR for hybrid roll-outs through 2031.
Which region is growing the fastest?
Asia-Pacific shows the quickest expansion, projected at 16.05% CAGR as organizations adopt cloud-native integration to bypass legacy constraints.
Page last updated on:





