Energy Ingredients Market Size and Share
Market Overview
| Study Period | 2021 - 2031 |
|---|---|
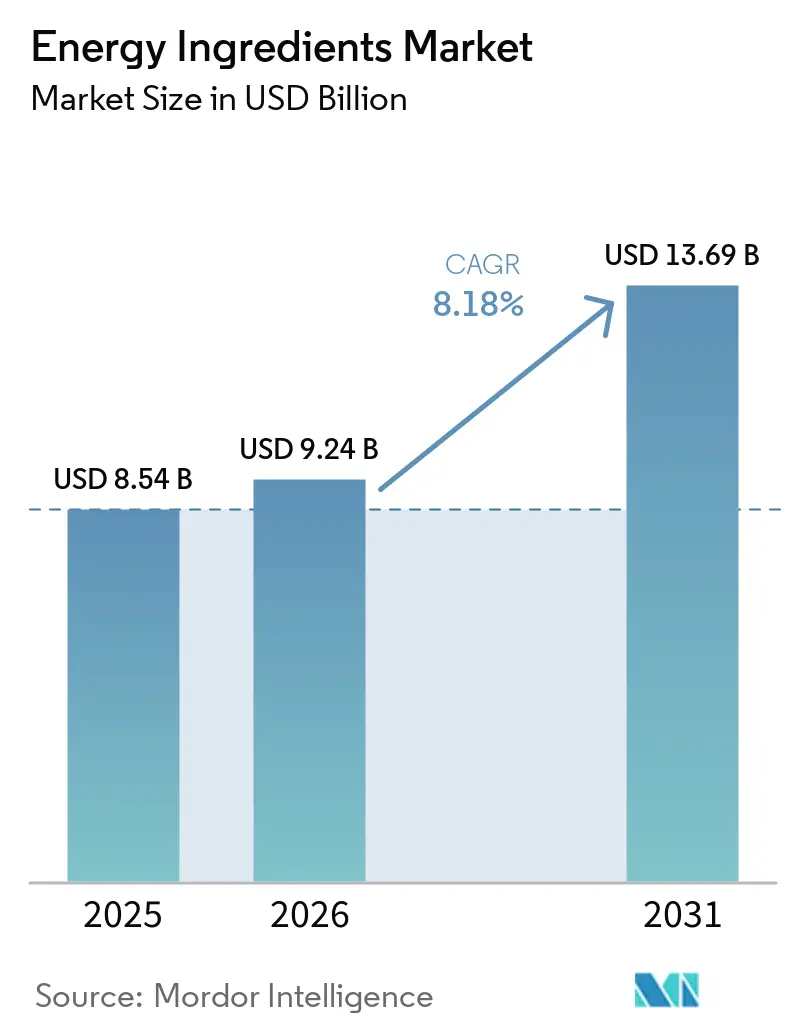
| Market Size (2026) | USD 9.24 Billion |
| Market Size (2031) | USD 13.69 Billion |
| Growth Rate (2026 - 2031) | 8.18% CAGR |
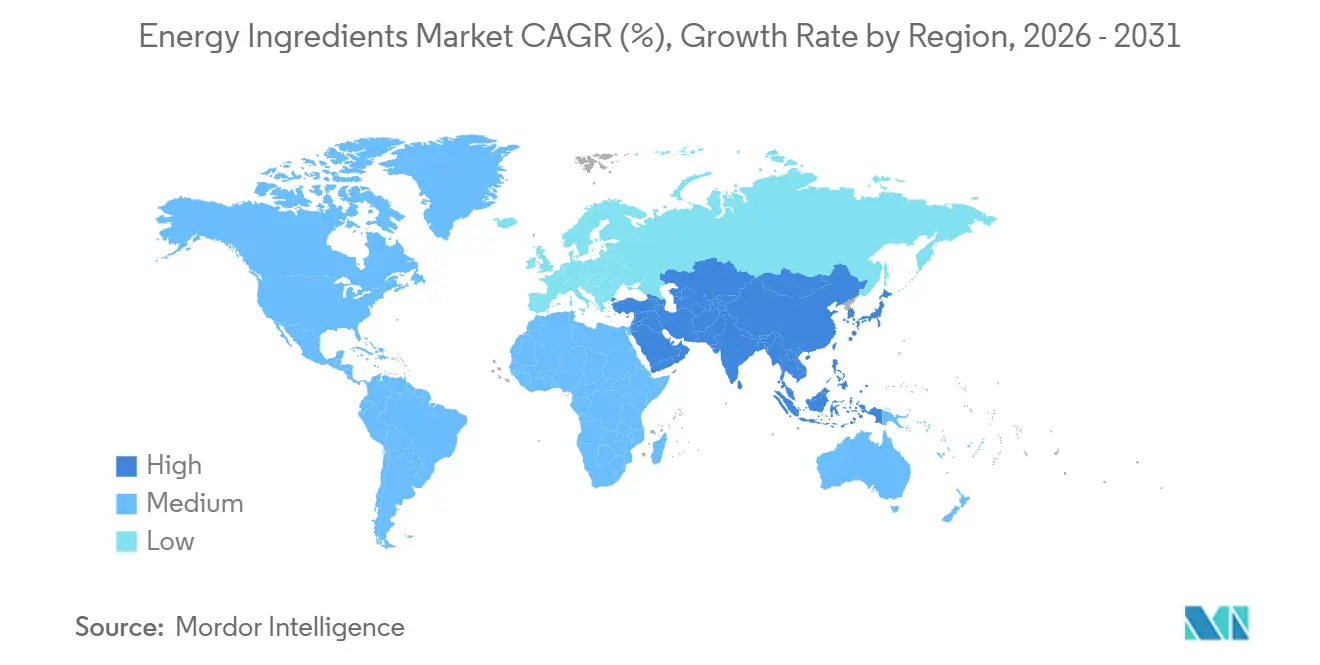
| Fastest Growing Market | Asia Pacific |
| Largest Market | North America |
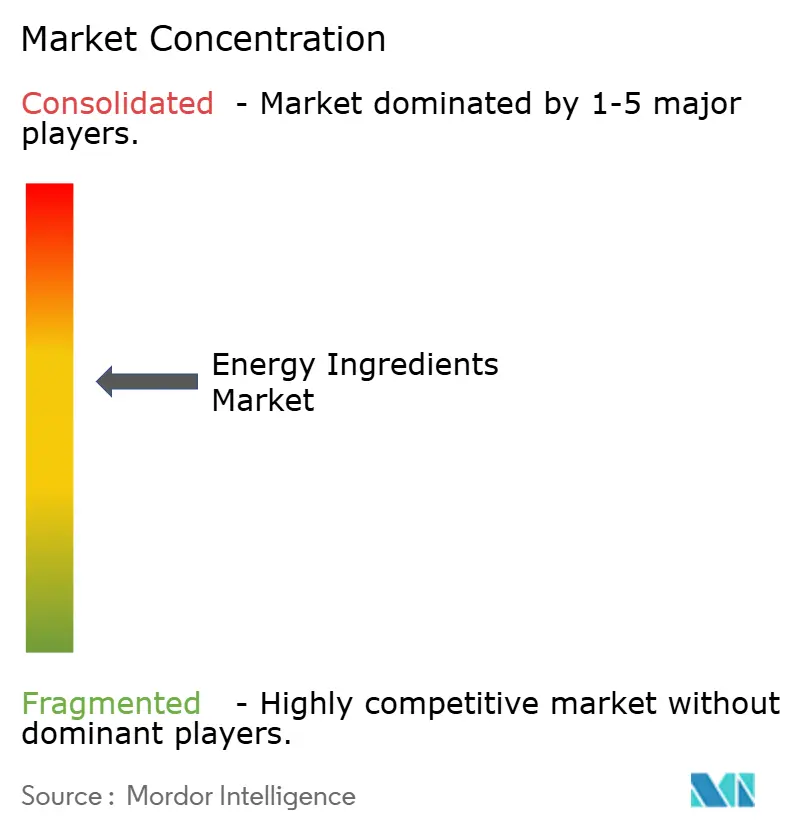
| Market Concentration | Medium |
Major Players *Disclaimer: Major Players sorted in no particular order Image © Mordor Intelligence. Reuse requires attribution under CC BY 4.0. | |
Energy Ingredients Market Analysis by Mordor Intelligence
The energy ingredients market size expanded from USD 8.54 billion in 2025 to USD 9.24 billion in 2026 and is forecast to reach USD 13.69 billion by 2031, advancing at a CAGR of 8.18% over 2026-2031. Rising demand for multifunctional beverages, ingredient diversification beyond commodity caffeine, and steady product launches in functional foods highlight a structural change in how consumers source daily vitality. The energy ingredients market continues to benefit from consumer preference for clean-label, natural stimulants and amino acids that deliver sustained alertness while minimizing jitters. Intensifying regulatory focus on stimulant dosing is nudging formulators toward botanicals with supportive clinical data. Manufacturers are redesigning supply chains to secure resilient access to coffee, tea, guarana, and specialty amino acids after 2025 climate shocks raised raw-material costs. Competitive strategies now emphasize portfolio breadth such as caffeine, taurine, adaptogens, and amino acids in modular blends allowing brands to meet the broadening spectrum of performance and wellness occasions.
Key Report Takeaways
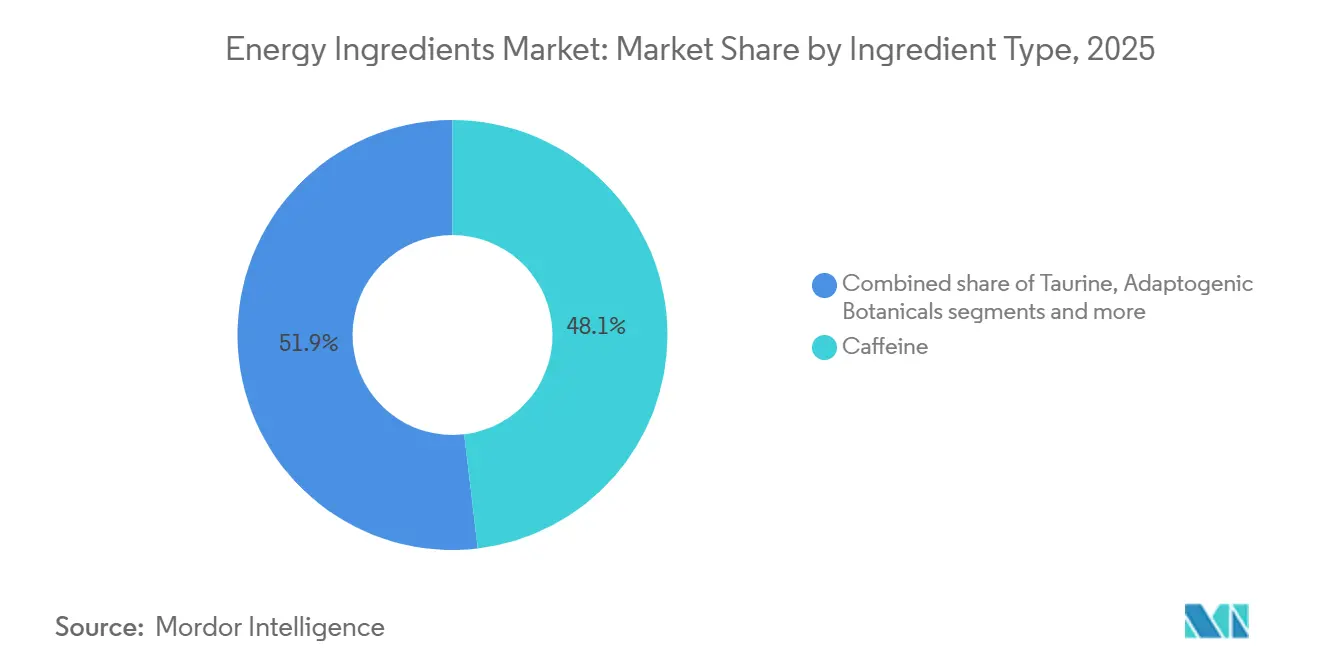
- By ingredient type, caffeine held 48.13% of the ingredient-type segment in 2025, while adaptogenic botanicals are advancing at a 9.84% CAGR through 2031.
- By source, natural ingredients captured 66.94% energy ingredients market share in 2025 and are projected to grow at a 9.56% CAGR over 2026-2031.
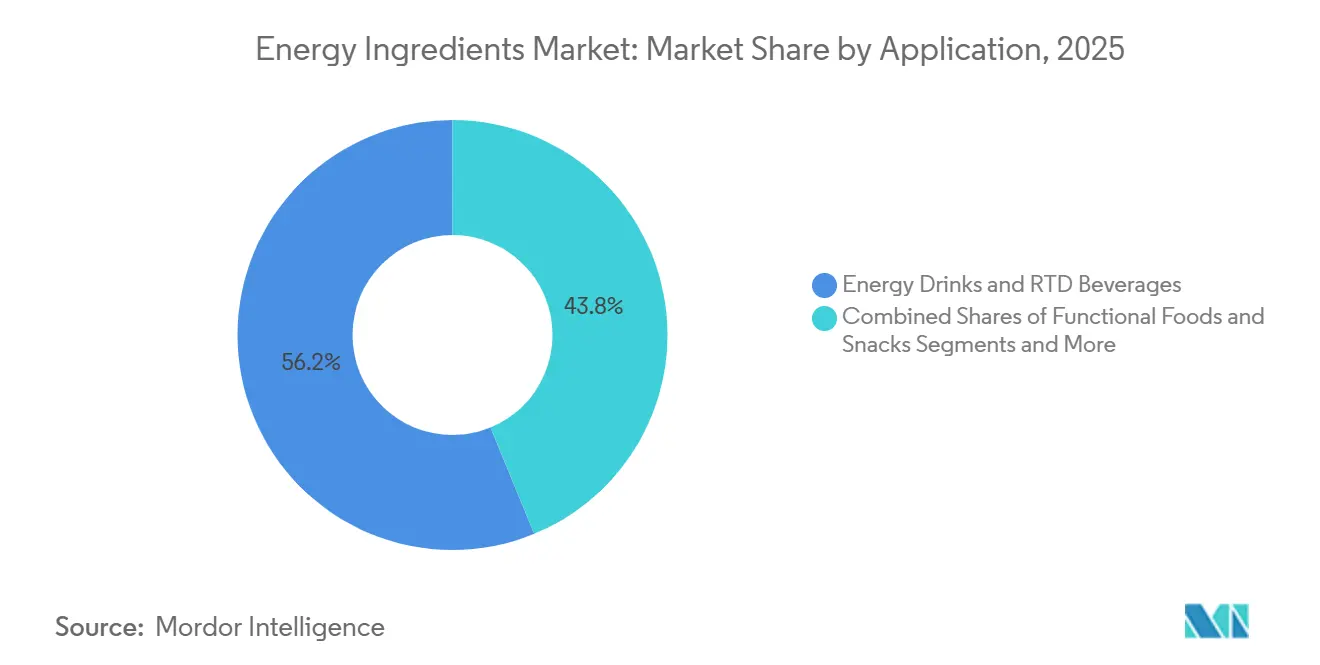
- By application, energy drinks and RTD beverages accounted for 56.21% of demand in 2025; functional foods and snacks form the fastest-growing application, moving at a 9.37% CAGR to 2031.
- By geography, North America retained 33.86% share in 2025, yet Asia-Pacific is set to expand at a 9.73% CAGR, the quickest regional advance.
Note: Market size and forecast figures in this report are generated using Mordor Intelligence’s proprietary estimation framework, updated with the latest available data and insights as of January 2026.
Global Energy Ingredients Market Trends and Insights
Drivers Impact Analysis*
| Driver | (~) % Impact on CAGR Forecast | Geographic Relevance | Impact Timeline |
|---|---|---|---|
| Rising demand for energy drinks and functional beverages | +2.1% | Global, with concentration in North America, Europe, and urban Asia-Pacific (China, India, Japan, South Korea) | Short term (≤ 2 years) |
| Growing focus on physical performance and mental alertness | +1.8% | Global, particularly North America, Europe, and Asia-Pacific fitness hubs (Thailand, Australia, Singapore) | Medium term (2-4 years) |
| Expansion of sports nutrition and active lifestyle trends | +1.5% | North America, Europe, Asia-Pacific (Thailand, India, Australia), with spillover to Middle East (UAE, Saudi Arabia) | Medium term (2-4 years) |
| Increasing adoption of natural and plant-based energy ingredients | +1.9% | Global, with early adoption in North America and Western Europe, accelerating in Asia-Pacific and South America | Medium term (2-4 years) |
| Surging consumption among young consumers and professionals | +1.6% | Global, with highest intensity in North America (Gen Z, millennials) and Asia-Pacific urban centers | Short term (≤ 2 years) |
| Product innovation including sugar-free formulations | +1.4% | Global, led by North America and Europe, expanding to Asia-Pacific and Middle East | Short term (≤ 2 years) |
| Source: Mordor Intelligence | |||
Rising demand for energy drinks and functional beverages
The increasing consumption of energy drinks and functional beverages is significantly driving growth in the energy ingredients market. Consumers are seeking convenient beverage options that provide quick energy, improved concentration, and enhanced physical performance, particularly in fast-paced urban environments. This has led to rising demand for ready-to-drink energy beverages, fortified coffees, functional teas, and energy shots formulated with ingredients such as caffeine, taurine, guarana, and B-vitamins. Additionally, younger demographics and fitness-oriented consumers are increasingly incorporating these beverages into daily routines to support active lifestyles. Manufacturers are also introducing low-sugar, zero-calorie, and plant-based formulations, which further expands the use of natural energy ingredients. The growing popularity of cold brew coffee, sports drinks, and performance beverages is strengthening product innovation across the category. Wide availability in convenience stores, supermarkets, gyms, and online retail platforms is further accelerating consumption.
Growing focus on physical performance and mental alertness
Growing focus on physical performance and mental alertness is a significant driver of the energy ingredients market, as consumers increasingly prioritize productivity, endurance, and cognitive well-being in their daily lives. Rising academic pressure, demanding work environments, and active lifestyle trends are encouraging greater consumption of products that support sustained energy and improved focus. This has led to strong demand for energy drinks, functional beverages, and dietary supplements containing ingredients such as caffeine, taurine, ginseng, and B-vitamins. Fitness enthusiasts and athletes are also incorporating energy-boosting formulations to enhance workout performance and recovery. Additionally, the growing popularity of gaming and extended screen-time activities has increased demand for cognitive-enhancing energy products. Manufacturers are responding by developing advanced formulations targeting both physical stamina and mental clarity. Clean-label and natural energy ingredients, including adaptogenic botanicals, are further gaining traction among health-conscious consumers. According to research by CBI ministry of foreign affairs, clean-label products are projected to constitute over 70% of portfolios in 2025 and 2026, increasing from 52% in 2021[1]Source: CBI Ministry of Foreign Affairs, “Which trends offer opportunities”, cbi.eu. Overall, the emphasis on improving both physical and mental performance continues to accelerate demand for energy ingredients across multiple end-use sectors.
Expansion of sports nutrition and active lifestyle trends
Expansion of sports nutrition and active lifestyle trends is a key driver of the energy ingredients market, supported by the increasing global focus on fitness, wellness, and preventive health. Consumers are actively engaging in gym workouts, endurance sports, and recreational fitness activities, which has significantly boosted demand for performance-enhancing nutrition products. This has led to rising consumption of energy drinks, protein bars, pre-workout supplements, and recovery formulations that contain ingredients such as caffeine, amino acids, creatine, and B-vitamins. The growing popularity of fitness influencers and health awareness campaigns has further encouraged individuals to adopt structured nutrition and supplement routines. Additionally, the integration of energy ingredients into sports nutrition products helps improve stamina, reduce fatigue, and enhance muscle performance. Manufacturers are also innovating with clean-label and plant-based formulations to cater to health-conscious athletes and active consumers.
Increasing adoption of natural and plant-based energy ingredients
The increasing shift toward natural and plant-based energy ingredients is acting as a strong growth driver for the energy ingredients market, as consumers increasingly prefer healthier and cleaner formulations. There is a noticeable decline in demand for synthetic stimulants, with greater interest in botanical and naturally derived energy sources that offer balanced and sustained stimulation. Ingredients such as guarana, ginseng, green tea extract, maca, and various adaptogenic herbs are being widely incorporated into energy drinks, functional beverages, and supplements. This trend is reinforced by rising consumer awareness around product transparency, ingredient sourcing, and long-term wellness benefits. Manufacturers are responding by reformulating products to include natural alternatives and reduce artificial additives in energy-focused products. The preference for plant-based nutrition is especially strong among younger consumers who associate such products with healthier and more sustainable lifestyles.
Restraints Impact Analysis*
| Restraint | (~) % Impact on CAGR Forecast | Geographic Relevance | Impact Timeline |
|---|---|---|---|
| Stringent regulatory compliance and approval processes | -1.2% | Global, with highest intensity in EU (EFSA), North America (FDA, Health Canada), and Asia-Pacific (FSSAI, CFDA, FSANZ) | Medium term (2-4 years) |
| Health concerns related to excessive caffeine and sugar consumption affecting demand | -0.9% | Global, particularly North America and Europe where health literacy is high | Short term (≤ 2 years) |
| Shift toward low-stimulant or non-caffeinated alternatives limiting growth | -0.7% | North America and Europe, with emerging signals in Asia-Pacific urban centers | Medium term (2-4 years) |
| Supply chain disruptions and price volatility affecting profitability | -1.1% | Global, with acute impact on coffee-dependent formulations (North America, Europe, South America) | Short term (≤ 2 years) |
| Source: Mordor Intelligence | |||
Stringent regulatory compliance and approval processes
The FDA's decision to potentially eliminate self-affirmed GRAS pathways has significantly tightened the regulatory landscape. Manufacturers must now actively submit detailed safety data and secure FDA notification before introducing new ingredients to the market[2]Source: U.S. Department of Health and Human Services, “FDA to Review Self-Affirmation Process for Food Ingredient Safety Assessment,” hhs.gov. Recent FDA data reveals a sharp decline in GRAS approvals, as only a small number of submissions have received "no questions" letters. This trend highlights the FDA's shift towards a more rigorous and thorough review process. Similarly, the European Food Safety Authority (EFSA) has intensified its regulatory oversight[3]Source: European Food Safety Authority, “Novel food,” efsa.europa.eu. EFSA's recent quarterly approvals have primarily focused on modifying existing authorizations, with fewer approvals granted for new ingredients. These regulatory changes have driven companies to allocate more resources and increase their compliance budgets to meet the heightened requirements. As a result, many manufacturers are strategically targeting markets with clearer and more transparent regulatory frameworks, avoiding the complexities of pursuing simultaneous approvals across multiple global regions.
Health concerns related to excessive caffeine and sugar consumption affecting demand
Health concerns associated with excessive caffeine and sugar consumption are acting as a key restraint on the energy ingredients market. Increasing awareness of adverse effects such as insomnia, increased heart rate, anxiety, and dehydration has led consumers to limit intake of traditional energy drinks. High sugar content in many energy beverages is also linked to obesity, diabetes, and other metabolic disorders, prompting greater scrutiny from health authorities and consumers. This has resulted in a gradual shift away from high-sugar, high-stimulant formulations toward healthier alternatives. Regulatory bodies in several regions have introduced sugar taxes and labeling requirements, further impacting product demand. As a result, manufacturers are under pressure to reformulate products with reduced caffeine and sugar levels. However, such reformulations can increase production costs and affect taste profiles, creating challenges for market growth.
*Our forecasts treat driver/restraint impacts as directional, not additive. The impact forecasts reflect baseline growth, mix effects, and variable interactions.
Segment Analysis
By Ingredient Type: Adaptogens Challenge Caffeine's Dominance
Caffeine accounted for 48.13% of the ingredient-type segment in 2025, making it the largest contributor to the energy ingredients market. Its dominance is primarily attributed to widespread usage across energy drinks, ready-to-drink coffee, functional beverages, and dietary supplements. Manufacturers prefer caffeine due to its well-established efficacy in improving alertness, enhancing mental focus, and boosting physical performance. The ingredient is also highly versatile, allowing incorporation into multiple product formats such as powders, capsules, shots, and beverages. Additionally, the strong consumer familiarity with caffeine-based products supports continued demand, particularly among working professionals, athletes, and students. The expansion of energy drink brands and RTD coffee consumption across developed and emerging markets further reinforces caffeine’s leading position.
Adaptogenic botanicals are projected to register the fastest growth, advancing at a CAGR of 9.84% through 2031. This growth is driven by increasing consumer preference for natural and plant-based energy solutions that offer sustained energy without the crash associated with traditional stimulants. Adaptogens such as ashwagandha, ginseng, rhodiola, and maca are gaining popularity due to their perceived benefits in stress management, endurance enhancement, and cognitive support. Beverage manufacturers are increasingly incorporating these ingredients into functional drinks, herbal energy beverages, and clean-label supplements. The trend toward holistic wellness and preventive health is also accelerating adoption of adaptogenic ingredients among health-conscious consumers. Additionally, demand for low-caffeine and caffeine-free energy formulations is encouraging brands to explore botanical alternatives.


By Source: Natural Ingredients Command Premium Growth
In 2025, natural sources held a dominant 66.94% market share and are projected to sustain strong growth with a 9.56% CAGR through 2031. This significant market position highlights a clear consumer shift toward natural ingredients, driven by increasing health awareness and stricter regulatory scrutiny on synthetic alternatives. Consumers increasingly view natural ingredients as safer and more aligned with their wellness goals, even though many synthetic ingredients offer comparable safety profiles.
The transition to natural sources has introduced complexities in supply chain management. Seasonal availability, quality fluctuations, and stringent traceability requirements pose significant challenges for natural ingredients, unlike synthetic alternatives that typically avoid such issues. Despite these obstacles, synthetic sources continue to play a critical role, particularly in pharmaceuticals and clinical nutrition, where maintaining consistent quality and ensuring precise dosing are essential. Regulatory authorities are actively refining safety guidelines for botanical ingredients while continuing to enforce rigorous approval processes for synthetic compounds, ensuring both categories meet high safety and quality standards.
By Application: Functional Foods Accelerate Past Beverages
Energy drinks and RTD beverages accounted for 56.21% of demand in 2025, making them the largest application segment in the energy ingredients market. The dominance of this segment is primarily driven by strong consumer demand for convenient, ready-to-consume energy solutions that support active and fast-paced lifestyles. Energy drinks, RTD coffees, and functional beverages widely incorporate ingredients such as caffeine, taurine, guarana, and vitamins to enhance alertness and performance. The increasing popularity of on-the-go consumption, particularly among working professionals and younger demographics, continues to strengthen demand within this segment. Additionally, product innovation in low-sugar, zero-calorie, and functional formulations has expanded the consumer base for energy beverages.
Functional foods and snacks represent the fastest-growing application segment, projected to expand at a CAGR of 9.37% through 2031. This growth is driven by rising consumer preference for energy-boosting products integrated into everyday food consumption rather than traditional beverages. Manufacturers are increasingly incorporating energy ingredients into protein bars, fortified snacks, breakfast cereals, and functional bakery products. These products offer sustained energy benefits while aligning with demand for convenient and nutritious snacking options. The trend toward healthier snacking, particularly among fitness-focused and busy consumers, is accelerating adoption of energy-enhanced foods. In addition, clean-label positioning and inclusion of natural energy ingredients such as adaptogens and plant-based extracts are supporting product innovation.
Geography Analysis
North America retained a 33.86% share of the energy ingredients market in 2025, making it the largest regional segment. The region’s dominance is supported by strong consumption of energy drinks, ready-to-drink beverages, and dietary supplements across the United States and Canada. High consumer awareness regarding functional ingredients such as caffeine, taurine, and B-vitamins has encouraged widespread adoption across beverage and nutrition products. Additionally, the presence of leading energy drink manufacturers and ingredient suppliers contributes to continuous product innovation and formulation advancements. The growing demand for performance-enhancing beverages among athletes, fitness enthusiasts, and working professionals further strengthens market growth. Expansion of clean-label and sugar-free energy products also supports sustained demand in the region.
Asia-Pacific is projected to register the fastest growth, expanding at a CAGR of 9.73% during the forecast period. This rapid growth is driven by rising urbanization, increasing disposable income, and growing demand for functional beverages across countries such as China, India, Japan, and South Korea. Consumers in the region are increasingly shifting toward energy drinks, RTD teas, and fortified beverages to support busy lifestyles. Additionally, the expanding youth population and growing fitness awareness are accelerating adoption of energy ingredients in sports nutrition and functional foods. Local manufacturers are introducing region-specific flavors and herbal energy formulations, further driving market penetration. The increasing popularity of plant-based and adaptogenic ingredients is also contributing to strong growth in Asia-Pacific.
Europe represents a mature but steadily growing market, supported by demand for clean-label energy beverages and functional nutrition products. Consumers in countries such as Germany, the United Kingdom, and France are increasingly preferring natural energy ingredients and reduced-sugar formulations. South America is witnessing moderate growth, driven by rising energy drink consumption and increasing availability of affordable RTD beverages, particularly in Brazil and Mexico. Meanwhile, the Middle East and Africa region is experiencing gradual expansion due to growing urban populations, rising tourism, and increasing demand for convenient energy drinks.

Competitive Landscape
The energy ingredients market exhibits moderate fragmentation, with the presence of several global ingredient manufacturers alongside regional and niche suppliers. Large multinational companies compete through extensive product portfolios that include caffeine, taurine, guarana, vitamins, amino acids, and botanical extracts. At the same time, smaller players focus on specialized offerings such as natural caffeine, adaptogenic botanicals, and clean-label energy ingredients. This competitive structure encourages continuous innovation, particularly in functional beverages, sports nutrition, and dietary supplements. Companies are differentiating themselves through ingredient purity, formulation support, and application-specific solutions. In addition, strategic collaborations with beverage manufacturers are becoming common to strengthen long-term supply agreements.
Leading players are actively investing in research and development to introduce advanced and differentiated ingredient solutions. Innovation efforts are focused on sustained-release caffeine, natural energy blends, and ingredients that support cognitive performance and endurance. Companies are also emphasizing clean-label positioning, non-GMO sourcing, and organic certifications to meet evolving consumer preferences. Strategic product launches and portfolio expansion are commonly used to address demand across energy drinks, RTD beverages, and functional foods. In addition, manufacturers are enhancing production capabilities and strengthening global distribution networks to maintain competitiveness.
Mergers, acquisitions, and geographic expansion initiatives are also shaping the competitive landscape of the energy ingredients market. Companies are acquiring smaller ingredient suppliers to gain access to proprietary technologies and botanical sourcing capabilities. Expansion into emerging markets such as Asia-Pacific and South America is another key focus, driven by rising demand for energy beverages. Additionally, firms are strengthening supply chains to ensure consistent raw material availability, particularly for natural caffeine and plant-based ingredients. Marketing strategies increasingly emphasize functionality, performance benefits, and sustainability credentials.
Energy Ingredients Industry Leaders
Ajinomoto Co., Inc.
BASF SE
Glanbia plc
Cargill, Incorporated
DSM-Firmenich AG
- *Disclaimer: Major Players sorted in no particular order

Recent Industry Developments
- April 2026: NAI launched CarnoSyn 4X beta-alanine, which delivered fourfold the bioavailability of its standard counterpart. This advancement allowed formulators to cut down on dosages without sacrificing performance benefits in sports nutrition and energy products, all while catering to the rising demand for cleaner labels with fewer ingredients.
- April 2025: TRI-K Industries, Inc. introduced TRICare CG, a multifunctional ingredient derived from amino acids, which bolstered skin microbiome health and enhanced skin barrier function. This launch underscored TRI-K's dedication to sustainable, biotechnology-led cosmetic actives that promised heightened efficacy and sensory appeal.
- October 2024: Evonik reshaped its Health Care division, focusing on pivotal growth sectors. During this transformative phase, the company contemplated strategic avenues, which included partnerships or divestitures, particularly concerning its keto and pharma amino acid production facilities in Ham and Wuming.


Global Energy Ingredients Market Report Scope
Energy ingredients are functional substances added to foods, beverages, and dietary supplements to enhance physical energy, mental alertness, and overall performance. The energy ingredients market is segmented by ingredient type, source, application and geography. Based on ingredient type, the market is segmented into caffeine, taurine, adaptogenic botanicals, amino acids and others. By source, the market is segmented into natural and synthetic. By application, the market is segmented into energy drinks and RTD beverages, functional foods and snacks, dietary supplements, sports nutrition products, pharmaceutical and clinical nutrition and others. By geography, the market is segmented into North America, Europe, Asia-Pacific, South America, and Middle-East and Africa. For each segment, the market sizing and forecasting have been done in value terms (USD million).
| Caffeine |
| Taurine |
| Adaptogenic Botanicals |
| Amino Acids |
| Others |
| Natural |
| Synthetic |
| Energy Drinks and RTD Beverages |
| Functional Foods and Snacks |
| Dietary Supplements |
| Sports Nutrition Products |
| Pharmaceutical and Clinical Nutrition |
| Others |
| North America | United States |
| Canada | |
| Mexico | |
| Rest of North America | |
| Europe | Germany |
| United Kingdom | |
| Italy | |
| France | |
| Spain | |
| Netherlands | |
| Poland | |
| Belgium | |
| Sweden | |
| Rest of Europe | |
| Asia-Pacific | China |
| India | |
| Japan | |
| Australia | |
| Indonesia | |
| South Korea | |
| Thailand | |
| Singapore | |
| Rest of Asia-Pacific | |
| South America | Brazil |
| Argentina | |
| Colombia | |
| Chile | |
| Peru | |
| Rest of South America | |
| Middle East and Africa | South Africa |
| Saudi Arabia | |
| United Arab Emirates | |
| Nigeria | |
| Egypt | |
| Morocco | |
| Turkey |
| By Ingredient Type | Caffeine | |
| Taurine | ||
| Adaptogenic Botanicals | ||
| Amino Acids | ||
| Others | ||
| By Source | Natural | |
| Synthetic | ||
| By Application | Energy Drinks and RTD Beverages | |
| Functional Foods and Snacks | ||
| Dietary Supplements | ||
| Sports Nutrition Products | ||
| Pharmaceutical and Clinical Nutrition | ||
| Others | ||
| By Geography | North America | United States |
| Canada | ||
| Mexico | ||
| Rest of North America | ||
| Europe | Germany | |
| United Kingdom | ||
| Italy | ||
| France | ||
| Spain | ||
| Netherlands | ||
| Poland | ||
| Belgium | ||
| Sweden | ||
| Rest of Europe | ||
| Asia-Pacific | China | |
| India | ||
| Japan | ||
| Australia | ||
| Indonesia | ||
| South Korea | ||
| Thailand | ||
| Singapore | ||
| Rest of Asia-Pacific | ||
| South America | Brazil | |
| Argentina | ||
| Colombia | ||
| Chile | ||
| Peru | ||
| Rest of South America | ||
| Middle East and Africa | South Africa | |
| Saudi Arabia | ||
| United Arab Emirates | ||
| Nigeria | ||
| Egypt | ||
| Morocco | ||
| Turkey | ||


Key Questions Answered in the Report
How large is the energy ingredients market today and how fast is it set to grow?
The energy ingredients market size reached USD 9.24 billion in 2026 and is projected to climb to USD 13.69 billion by 2031, advancing at an 8.18% CAGR over 2026-2031.
Which ingredient category is gaining share the fastest?
Adaptogenic botanicals such as ashwagandha and rhodiola are the quickest climbers, registering a 9.84% CAGR through 2031.
Are natural sources really outperforming synthetic caffeine?
Yes, natural-source ingredients held 66.94% share in 2025 and are forecast to expand at a 9.56% CAGR, outpacing synthetic alternatives as clean-label demand rises.
Which region will add the most incremental sales by 2031?
Asia-Pacific is expected to deliver the fastest regional expansion at a 9.73% CAGR thanks to regulatory modernization and growing sports-nutrition uptake.
What application is moving ahead of drinks in growth terms?
Functional foods and snacks are set to grow 9.37% per year to 2031, surpassing beverage growth as brands roll out energy bites, bars, and chews.
Page last updated on:


