
Market Overview
| Study Period | 2021 - 2031 |
|---|---|
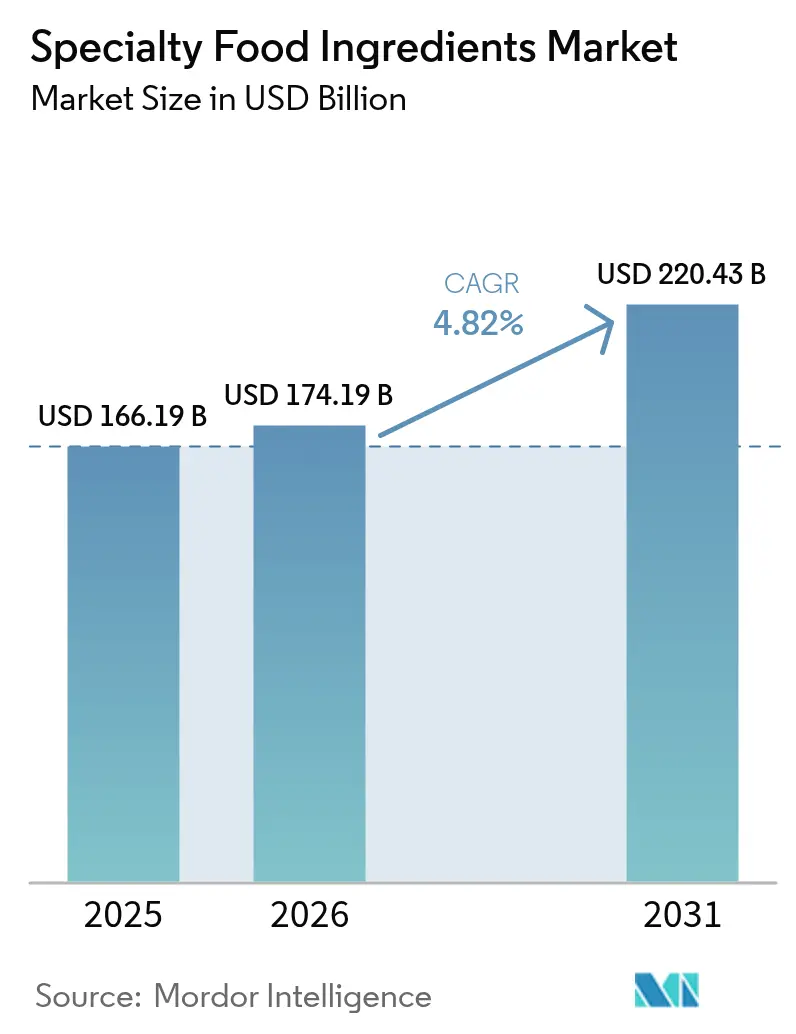
| Market Size (2026) | USD 174.19 Billion |
| Market Size (2031) | USD 220.43 Billion |
| Growth Rate (2026 - 2031) | 4.82 % |
| Fastest Growing Market | Asia Pacific |
| Largest Market | North America |
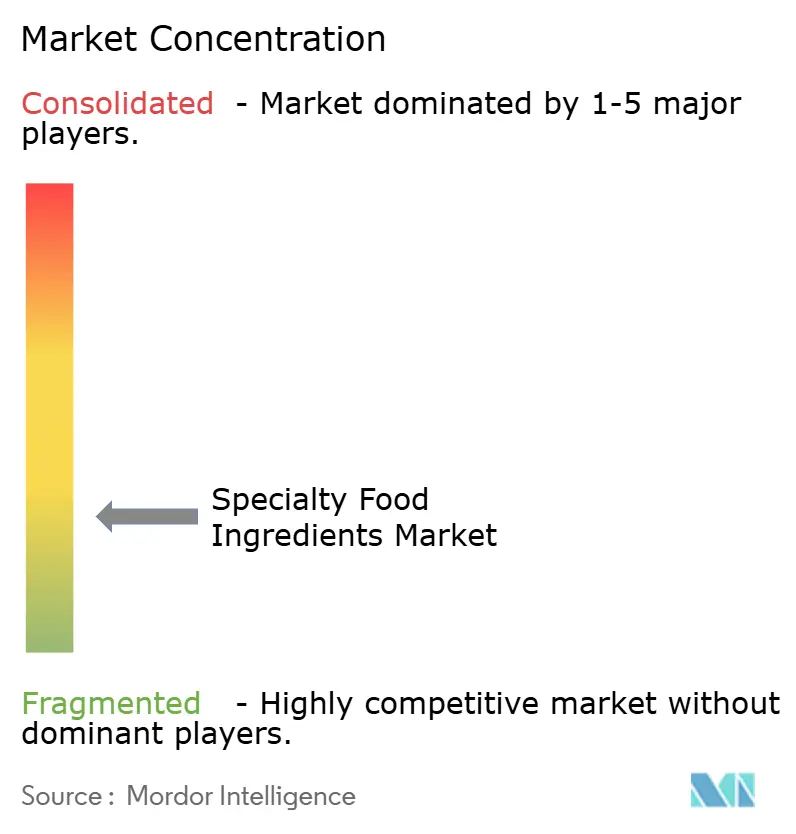
| Market Concentration | Low |
Major Players
*Disclaimer: Major Players sorted in no particular order Image © Mordor Intelligence. Reuse requires attribution under CC BY 4.0. |
|
Specialty Food Ingredients Market Analysis by Mordor Intelligence
The global specialty food ingredients market size is steadily expanding, growing from USD 166.19 billion in 2025 to USD 174.19 billion in 2026, and is projected to reach USD 220.43 billion by 2031, with a CAGR of 4.82% during 2026–2031. This growth is primarily driven by the transformation of the food industry from providing basic nourishment to offering value-added, performance-oriented products. Consumers are increasingly examining ingredient lists and opting for foods that align with health management, preventive nutrition, and specific dietary preferences. This trend is boosting the demand for functional fibers, natural preservatives, plant-based colorants, alternative sweeteners, and bioactive fortification components. Additionally, rapid product innovation cycles and frequent new product launches are prompting companies to utilize specialty ingredients to ensure consistency, stability, and sensory appeal in large-scale production.
Key Report Takeaways
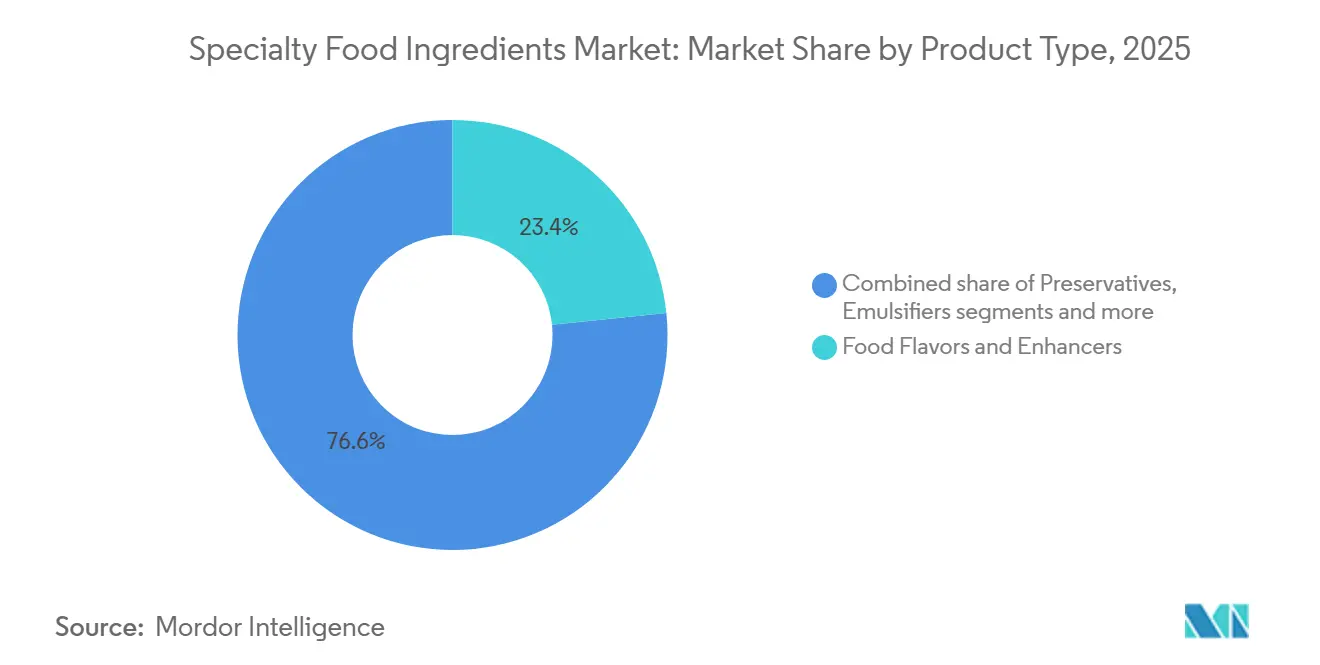
- By product type, Food Flavors and Enhancers led with 23.26% of the specialty food ingredients market share in 2025, and Functional Food Ingredients are projected to post the fastest 4.91% CAGR through 2031.
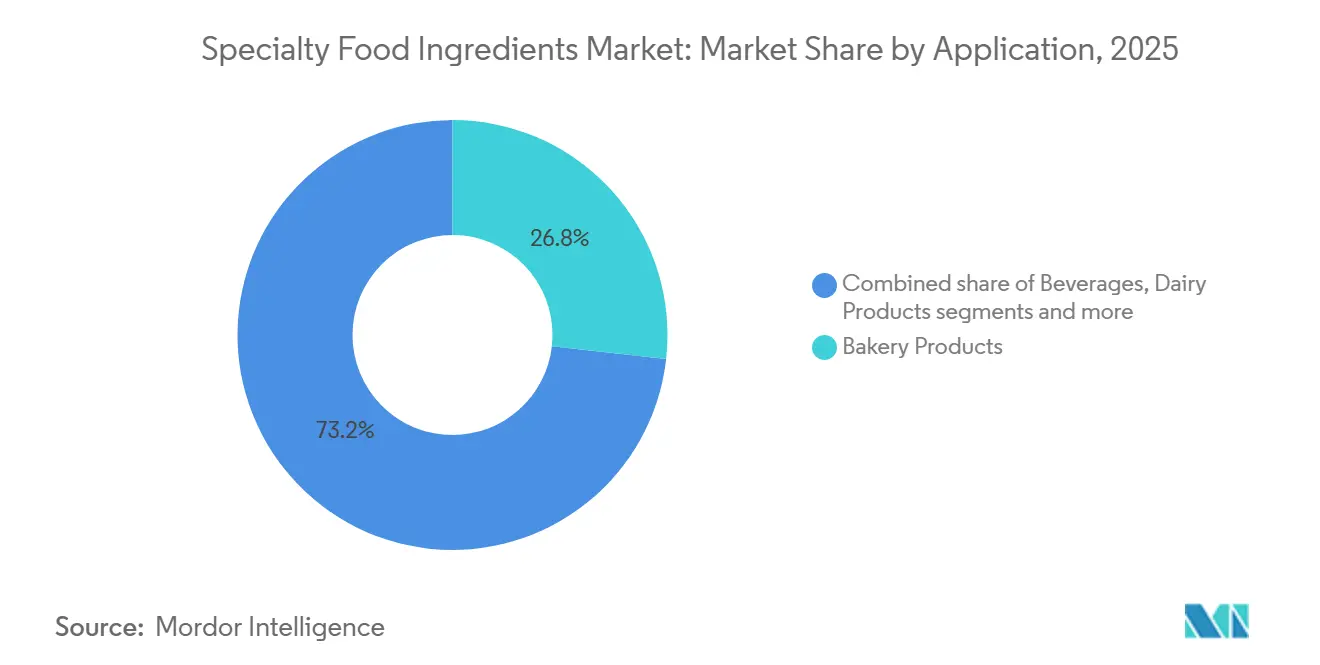
- By application, Bakery Products accounted for 26.78% of the specialty food ingredients market size in 2025, and Plant-based Food and Beverage is forecast to advance at a 5.86% CAGR between 2026 and 2031.
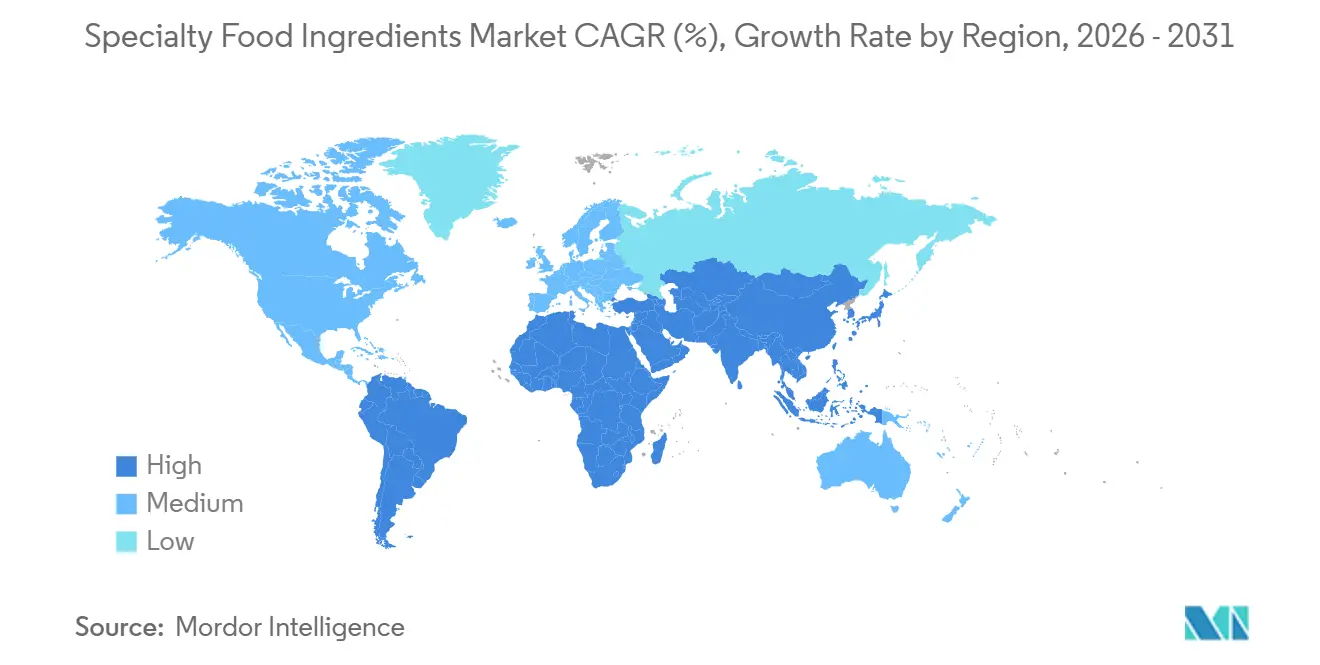
- By geography, North America dominated with 31.04% revenue share in 2025, and Asia-Pacific is poised to grow the quickest at a 5.61% CAGR through 2031.
Note: Market size and forecast figures in this report are generated using Mordor Intelligence’s proprietary estimation framework, updated with the latest available data and insights as of 2026.
Market Trends and Insights
Drivers Impact Analysis of Specialty Food Ingredients Market*
| Driver | (~) % Impact on CAGR Forecast | Geographic Relevance | Impact Timeline |
|---|---|---|---|
| Health and wellness awareness | +0.9% | Global, with pronounced effects in North America and Western Europe | Medium term (2-4 years) |
| Consumer demand for clean-label ingredients | +0.8% | North America and Europe core, expanding to Asia-Pacific urban centers | Short term (≤ 2 years) |
| Expansion of vegan, vegetarian, and plant-forward diets | +0.7% | Asia-Pacific core, North America, and Northern Europe | Medium term (2-4 years) |
| Ethical sourcing and sustainable farming practices | +0.6% | Europe and North America, with spillover to Latin America | Long term (≥ 4 years) |
| Technological advancements in food processing | +0.5% | Global, led by North America and Asia-Pacific manufacturing hubs | Medium term (2-4 years) |
| Growth in processed and packaged foods | +0.4% | Asia-Pacific and Middle East, with mature but stable demand in North America | Short term (≤ 2 years) |
| Source: Mordor Intelligence | |||
Health and wellness awareness
Health and wellness awareness is a key driver of the specialty food ingredients market, as the increasing prevalence of chronic diseases influences consumer expectations regarding everyday foods. Consumers are progressively linking diet to long-term health outcomes and are opting for products designed to support metabolic balance, weight management, digestive health, and immunity. This trend is prompting manufacturers to reformulate products using functional fibers, low-glycemic sweeteners, plant proteins, probiotics, omega fatty acids, and micronutrient fortification. For example, the International Diabetes Federation reports that as of 2024, approximately 589 million adults aged 20–79 are living with diabetes globally, highlighting growing concerns about blood sugar management and dietary quality [1]Source: International Diabetes Federation, "The Diabetes Atlas", idf.org. As a result, food manufacturers are increasingly relying on specialty ingredients to reduce sugar content, enhance nutritional functionality, and align with health-focused product positioning, thereby driving significant growth in the specialty food ingredients market.
Consumer demand for clean-label ingredients
Increasing consumer demand for clean-label products is driving growth in the global specialty food ingredients market. Shoppers are prioritizing foods with recognizable, minimally processed, and transparent ingredient lists. This trend has led to a decline in the use of artificial preservatives, synthetic colors, and chemical-sounding additives, prompting manufacturers to reformulate products with natural flavors, plant-based colorants, fermentation-derived preservatives, and functional fibers. However, this shift presents technical challenges, as removing traditional additives can impact product stability, taste, texture, and shelf life. To address these issues, food producers rely on specialty ingredients such as natural antioxidants, enzyme systems, hydrocolloids, and botanical extracts to replicate the functionality of conventional additives while maintaining clean-label standards. Additionally, clean-label demands emphasize shorter ingredient lists and allergen-free formulations, increasing the need for advanced ingredient solutions that provide preservation, emulsification, and sensory quality simultaneously.
Expansion of vegan, vegetarian, and plant-forward diets
The growing adoption of vegan, vegetarian, and plant-based eating patterns is driving significant growth in the global specialty food ingredients market. As consumers increasingly reduce their consumption of animal-derived foods for health, ethical, and environmental reasons, food manufacturers face the challenge of replicating the sensory and nutritional properties traditionally provided by meat, eggs, and dairy. Plant-based raw materials alone often cannot naturally deliver comparable structure, emulsification, juiciness, binding, or flavor complexity, making advanced ingredient systems crucial. For example, according to the International Food Information Council (IFIC), approximately 55% of Americans in 2024 reported following a vegan, vegetarian, or plant-based eating pattern for health reasons, highlighting a notable shift in dietary preferences [2]Source: International Food Information Council (IFIC), "2024 IFIC Food & Health SURVEY", ific.org. As plant-based diets transition from niche to mainstream, manufacturers are required to continuously improve taste, appearance, and functionality, thereby driving increased demand for specialty food ingredients and supporting sustained market growth.
Ethical sourcing and sustainable farming practices
The growing focus on ethical sourcing and sustainable farming practices is a significant driver in the specialty food ingredients market. Consumers and food manufacturers are increasingly prioritizing environmental responsibility and supply chain transparency. Food brands face rising pressure to ensure traceability, responsible land use, and minimized environmental impact, leading to a shift toward sustainably produced raw materials. These include responsibly cultivated botanicals, certified cocoa and vanilla, non-deforestation oils, and fermentation-derived alternatives. To address these demands, manufacturers are incorporating specialty ingredients with sustainability certifications, derived from renewable resources, or produced using biotechnology processes that reduce water, land, and chemical usage. Sustainable sourcing also enhances brand trust and ensures compliance with retailer procurement standards, making certified and traceable ingredients commercially advantageous.
Restraints Impact Analysis of Specialty Food Ingredients Market*
| Restraint | (~) % Impact on CAGR Forecast | Geographic Relevance | Impact Timeline |
|---|---|---|---|
| High production costs for natural and organic specialty ingredients | -0.6% | Global, most acute in price-sensitive emerging markets | Short term (≤ 2 years) |
| Varying food safety and labeling standards | -0.5% | Global, with fragmentation between North America, Europe, and Asia-Pacific | Medium term (2-4 years) |
| Ingredient stability and limited shelf life | -0.4% | Global, particularly challenging in tropical and subtropical regions | Medium term (2-4 years) |
| Technical challenges in formulation | -0.3% | Global, with higher impact in plant-based and functional food applications | Short term (≤ 2 years) |
| Source: Mordor Intelligence | |||
High production costs for natural and organic specialty ingredients
High production costs associated with natural and organic specialty ingredients serve as a significant restraint on the global specialty food ingredients market. Unlike conventional additives, naturally derived ingredients often require controlled cultivation, certified farming practices, selective harvesting, and complex extraction or purification processes, all of which contribute to higher manufacturing expenses. Additionally, organic certification standards impose compliance, traceability, and auditing requirements, further increasing operational costs and limiting scalability. Natural ingredients also tend to have lower yields, greater seasonal variability, and stricter storage conditions, which drive up processing and quality-assurance costs. These elevated input costs are passed on to food manufacturers, making clean-label or organic products more expensive to produce and challenging to price competitively in cost-sensitive market segments.
Varying food safety and labeling standards
Variations in food safety regulations and labeling requirements across countries serve as a significant restraint on the global specialty food ingredients market. Regulatory authorities in different regions have distinct approval processes, usage limits, and rules for substantiating claims related to additives, bioactive compounds, and functional ingredients. Consequently, an ingredient approved in one region may require additional testing, reformulation, or re-registration before it can be commercialized in another. This results in extended approval timelines, higher documentation costs, and increased compliance challenges for manufacturers and suppliers. Companies must modify formulations, labeling, and health claims to align with local standards, complicating global product launches and delaying innovation cycles. Smaller ingredient producers are particularly affected, as they often lack the regulatory expertise and resources needed to navigate these complexities.
*Our forecasts treat driver/restraint impacts as directional, not additive. The impact forecasts reflect baseline growth, mix effects, and variable interactions.
Specialty Food Ingredients Market Segment Analysis
By Product Type:
Functional Ingredients Lead InnovationThe food flavors and enhancers segment is projected to account for 23.26% of the specialty food ingredients market in 2025, making it a significant contributor. Modern food innovation increasingly emphasizes sensory experiences over traditional focuses like nutrition or preservation. In packaged foods, beverages, plant-based products, and reformulated better-for-you offerings, manufacturers depend on flavors and taste-modulating ingredients to maintain consumer acceptance. As food companies reduce sugar, salt, and fat to align with clean-label and health trends, products often lose palatability. Flavor enhancers play a critical role in restoring mouthfeel and overall taste, enabling reformulation without compromising consumer satisfaction.
The functional food ingredients segment is expected to grow at a CAGR of 4.91% during 2026–2031, significantly driving the specialty food ingredients market. This growth is fueled by a structural shift in consumer perception of food, moving from basic nourishment to a focus on preventive health and daily wellness management. Rising awareness of immunity, digestive health, metabolic balance, and long-term disease prevention has led consumers to scrutinize ingredient lists and prefer products containing scientifically validated bioactive components. Consequently, manufacturers are incorporating nutrients such as probiotics, prebiotics, dietary fibers, plant sterols, omega fatty acids, protein isolates, vitamins, and mineral fortifiers to enhance nutritional value and support credible health claims.



By Application:
Plant-Based Drives Formulation ComplexityThe bakery products segment accounted for 26.78% of the application share in 2025, dominating the specialty food ingredients market. This dominance is attributed to the critical role of functional performance ingredients in bakery formulations, which are essential for achieving structure, texture, shelf stability, and sensory quality. Unlike other food categories, bakery systems are highly sensitive to formulation balance, necessitating the use of enzymes, emulsifiers, leavening systems, dough conditioners, flavors, sweeteners, and hydrocolloids. These ingredients ensure consistent volume, crumb softness, moisture retention, and extended freshness. Additionally, growing reformulation trends, such as sugar reduction, fat replacement, gluten modification, and clean-label development, have increased the reliance on specialty ingredients.
The plant-based food and beverage segment, projected to grow at a CAGR of 5.86% through 2031, is emerging as a highly innovation-intensive application area for specialty food ingredients. Alternative formulations in this segment must replicate the sensory, nutritional, and functional properties traditionally provided by animal-derived components. Unlike conventional products, plant-based matrices often lack inherent structure, binding capacity, emulsification behavior, and characteristic taste. To address these challenges, complex ingredient systems are required, including plant proteins, stabilizers, hydrocolloids, emulsifiers, natural flavors, color solutions, and texture-modifying enzymes. For example, according to the Good Food Institute (GFI), the global plant-based industry was valued at approximately USD 8.1 billion in 2024, reflecting a strong consumer shift toward alternative protein sources [3]Source: Good Food Institute (GFI), "The plant-based food industry is evolving", gfi.org. This sustained adoption drives food manufacturers to continuously refine product texture, stability, and taste, which are achievable only through the use of specialized ingredient systems.
Geography Analysis
North America Specialty Food Ingredients Market
In 2025, North America accounted for 31.04% of the global specialty food ingredients market share, driven by its mature and innovation-focused food manufacturing sector. The region benefits from strong consumer demand for premium, clean-label, and functionally enhanced formulations, prompting food companies to adopt advanced ingredient systems instead of basic commodity additives. Manufacturers are actively reformulating products to reduce artificial components, enhance nutritional profiles, and introduce differentiated sensory characteristics. This has increased reliance on enzymes, natural flavors, bioactive fortification ingredients, and texture modifiers. Clear labeling, product differentiation, and the presence of large multinational ingredient suppliers support ongoing research and commercialization of novel specialty ingredients, strengthening the region’s leading market position.
APAC Specialty Food Ingredients Market
The Asia-Pacific region is projected to grow at a CAGR of 5.61% during 2026–2031, emerging as the fastest-expanding market for specialty food ingredients. Factors such as rising middle-class incomes, rapid urbanization, and the gradual Westernization of dietary habits are driving increased consumption of packaged, processed, and convenience foods that require stabilization, preservation, and sensory optimization. Simultaneously, growing health awareness is encouraging manufacturers to fortify foods and enhance ingredient quality, leading to greater adoption of functional additives, natural colorants, and clean-label solutions. The expansion of domestic food processing industries and the rapid pace of product innovation in developing economies are further pushing ingredient suppliers to scale operations, positioning the region as a key growth driver for the specialty food ingredients market.
EMEA and South America Specialty Food Ingredients Market
Europe, South America, and the Middle East and Africa represent significant but structurally distinct markets for specialty food ingredients. Europe’s stringent regulatory standards and detailed ingredient approval processes shape product formulations toward high-quality, safe, and traceable specialty ingredients. This encourages the adoption of certified natural additives and advanced enzyme systems. In South America, led by Brazil, Argentina, and Colombia, the modernization of the processed food sector is driving steady uptake of specialty ingredients, as manufacturers seek improved shelf stability and product consistency across expanding retail channels. Meanwhile, the Middle East and Africa are experiencing growing demand driven by expanding food manufacturing capacity, enhanced retail infrastructure, and rising interest in packaged foods with longer shelf lives and stable quality. This has led to increased use of preservation, texture, and flavor-enhancing ingredient solutions across the region.

Regulatory Landscape
Regulation for specialty food ingredients is shaped by region-specific food additive, color additive, and labeling regimes, which creates compliance fragmentation for global product launches. In the European Union, Commission Regulation (EU) 2026/196 (January 2026) amended specifications for several widely used hydrocolloids and texturants (including locust bean gum, guar gum, gum arabic, xanthan gum, pectins, and starch sodium octenyl succinate), with transition provisions that run through 2026 and affect inventory, supplier qualification, and documentation updates.
In the United States, FDA actions on color additives and ongoing Foods Program rulemaking influence reformulation pathways for clean-label colorants and taste systems. In February 2026, FDA approved expanded uses of spirulina extract as a color additive (21 CFR 73.530), and the agency also indicated faster review momentum for natural color alternatives such as gardenia (genipin) blue, along with encouragement for phase-out of legacy synthetic dyes. For emerging ingredient technologies, FAO has noted that many markets still route oversight through existing food law and novel food safety governance rather than dedicated standalone frameworks, keeping dossiers, claims substantiation, and cross-border commercialization requirements highly dependent on jurisdiction.
Value Chain Analysis
The specialty food ingredients value chain starts with agricultural and bio-based feedstocks (cereals, oilseeds, pulses, dairy streams, botanicals) and fermentation inputs, then moves through extraction, refining, and enzymatic or fermentation processing, followed by blending and application-specific formulation support. Ingredients ultimately feed into food and beverage manufacturers and multi-tier distribution channels.
Large suppliers typically differentiate through global sourcing networks, scale manufacturing, and technical service via application labs. Niche innovators more often commercialize through licensing, contract manufacturing, and strategic partnerships, which helps them serve multiple geographies without building full in-house capacity. Recent moves point to tighter control of inputs and more resilient, regionalized supply: Tate & Lyle partnered with Manus (January 2025) to secure vertically integrated supply of high-purity Reb M stevia, spanning cultivation in Peru and processing in Augusta, Georgia, to reduce tariff and geopolitical exposure. In proteins and fibers, Ingredion and Lantmannen (November 2024) partnered around a pea protein isolate facility in Sweden, and Dohler formed a citrus fiber joint venture with FGF Trapani (November 2024) anchored in Sicilian lemon sourcing to strengthen quality and continuity. For natural colorants, Michroma partnered with CJ CheilJedang (September 2025) to scale commercial manufacturing using CJ CheilJedang's operational footprint across multiple countries, reflecting the sector's reliance on distributed production and established industrial platforms for faster scale-up.
Competitive Landscape
The global specialty food ingredients market is characterized by a moderately fragmented competitive structure, comprising a mix of multinational ingredient conglomerates and specialized, technology-driven suppliers. Key players in the market include Archer Daniels Midland Company, Cargill, Incorporated, Kerry Group plc, International Flavors & Fragrances Inc., and Tate & Lyle PLC. These companies compete on various fronts, including pricing, formulation expertise, regulatory compliance capabilities, application laboratory support, and global supply chain reliability. Larger firms leverage extensive raw-material sourcing networks and technical service teams to assist food manufacturers in reformulating products, while mid-sized companies often focus on niche technologies such as fermentation, enzyme engineering, or botanical extraction.
Competitive strategies in the market generally fall into two distinct categories. Scale-oriented companies prioritize vertical integration, encompassing agricultural sourcing, processing, ingredient manufacturing, and application development. This approach ensures supply security, cost efficiency, and the ability to deliver customized solutions to major food brands. Conversely, focused innovators act as technology specialists, developing high-value functional compounds, precision-fermentation ingredients, or proprietary taste-modulation systems. These innovations are commercialized through licensing agreements, joint development initiatives, or strategic co-formulation partnerships with food manufacturers.
Significant opportunities are arising in next-generation food innovation. Ingredient companies are increasingly exploring scaffolding and structural biomaterials essential for cultivated meat production, as well as personalized nutrition solutions that utilize bioactive ingredients tailored to individual metabolic or genetic profiles. Additionally, upcycled ingredients derived from food processing side streams, such as fiber concentrates, natural color extracts, and functional proteins, are gaining traction as sustainability becomes a higher priority. These emerging areas are fostering collaborations among biotechnology firms, food manufacturers, and ingredient suppliers.
Specialty Food Ingredients Industry Leaders
-
Archer Daniels Midland Company
-
Cargill, Incorporated
-
Kerry Group plc
-
International Flavors & Fragrances Inc.
-
Tate & Lyle PLC
- *Disclaimer: Major Players sorted in no particular order
Specialty Food Ingredients Market Companies Covered in this Report
- Archer Daniels Midland Company
- Cargill, Incorporated
- Kerry Group plc
- DSM-Firmenich AG
- International Flavors & Fragrances Inc.
- Tate & Lyle PLC
- Ingredion Incorporated
- Givaudan SA
- Associated British Foods plc
- Sensient Technologies Corporation
- Symrise AG
- Novozymes A/S
- AAK AB
- Corbion N.V.
- Lonza Group AG
- Glanbia plc
- Roquette Freres S.A.
- Sudzucker AG
- Celanese Corporation
- Tereos Group

Market Opportunities and Future Outlook
Clean-label reformulation and functional nutrition continue to create room for specialty ingredients that maintain performance while keeping ingredient perception straightforward, particularly across plant-based foods and beverages where formulation complexity is high. Regulatory activity around color additives and additive specifications is also tightening the requirements for natural colors, stabilizers, and texture systems, which increases the emphasis on documentation and version control for multi-market labels.
Recent capacity additions and localization investments provide clearer directional evidence of where suppliers are placing near-term focus across flavors and functional nutrition. FrieslandCampina Ingredients completed an expansion of its Borculo facility in the Netherlands in March 2026, doubling capacity for whey protein isolate (WPI) and milk fat globule membrane (MFGM) ingredients, supporting higher-throughput supply for performance nutrition and fortified foods. In flavors, PepsiCo India inaugurated a flavor manufacturing facility in Ujjain in July 2026 backed by an INR 1,266 crore investment, and Givaudan inaugurated a 24,000 square meter production facility in Cikarang, Indonesia in 2026 to manufacture savory, sweet, and snack flavor powders, reinforcing the move toward in-region production and quicker turnaround for localized taste and application needs. On innovation infrastructure, Edlong announced a USD 10 million investment in June 2026 and began construction of a 35,000 sq ft operations center at its Elk Grove Village campus to advance dairy taste technology, supporting continued differentiation in dairy and dairy-alternative flavor systems.
Recent Industry Developments in Specialty Food Ingredients Market
- June 2026: ADM inaugurated a 7,500 square-meter premix and feed additives production facility in Apucarana, Brazil, with an annual capacity of 40,000 tons. The project expands ADM's regional manufacturing footprint and supports shorter lead times for customers that rely on performance ingredient blends across food and nutrition adjacencies.
- May 2026: ADM launched eight new soy and pea protein ingredient solutions across North America and Europe. The additions broadened its plant-based protein portfolio for formulation-driven applications where solubility, texture, and nutritional positioning influence product acceptance.
- November 2024: Ingredion formed a long-term collaboration with Lantmannen to develop a state-of-the-art pea protein isolate factory in Sweden. The partnership strengthens European supply optionality for plant-based formulations and adds upstream integration via an agricultural cooperative model.


Specialty Food Ingredients Market Report Scope and Research Methodology
Market Definition and Coverage
For this study, the specialty food ingredients market covers higher-value ingredients added to food and beverage formulations to improve taste, texture, stability, appearance, shelf life, or nutrition, and it is measured as ingredient sales value at the global level.
Scope exclusions: We exclude finished packaged foods and beverages, foodservice sales, and non-food industrial uses where the ingredient is not supplied for edible applications.
Segments Covered in This Report
-
By Product Type
- Functional Food Ingredient
- Speciality Starch and Texturants
- Sweetener
- Food Flavors and Enhancers
- Acidulants
- Preservatives
- Emulsifiers
- Colorants
- Enzymes
- Proteins
- Speciality Fats and Oils
- Food Hydrocolloids and Polysaccharides
- Anti-Caking Agents
- Others
-
ByApplication
- Bakery Products
- Beverages
- Meat, Poultry, and Seafood
- Dairy Products
- Confectionery
- Fats and Oils
- Dressings/Condiments/Sauces/Marinade
- Pasta, Soup and Noodles
- Prepared Food
- Plant-based Food and Beverage
- Other Applications
-
By Geography
-
North America
- United States
- Canada
- Mexico
- Rest of North America
-
Europe
- Germany
- United Kingdom
- Italy
- France
- Spain
- Netherlands
- Poland
- Belgium
- Sweden
- Rest of Europe
-
Asia-Pacific
- China
- India
- Japan
- Australia
- Indonesia
- South Korea
- Thailand
- Singapore
- Rest of Asia-Pacific
-
South America
- Brazil
- Argentina
- Colombia
- Chile
- Peru
- Rest of South America
-
Middle East and Africa
- South Africa
- Saudi Arabia
- United Arab Emirates
- Nigeria
- Egypt
- Morocco
- Turkey
- Rest of Middle East and Africa
-
North America
Data Sources, Market Sizing, and Validation
Desk Research
Desk work started with building a clear map of what counts as specialty ingredients and where demand shows up in real sourcing. Public sources were used to ground the model, including USDA and FAO food balance and production data, UN Comtrade trade flows for key ingredient groups, Codex and FDA guidance on food additives, and EFSA opinions for regulated ingredient categories.
We also reviewed annual reports and investor presentations of ingredient suppliers, trade association updates, and reputable press coverage on formulation shifts such as clean label, sugar reduction, and plant-based launches. For gaps in company-level revenue splits and product mix, we used paid subscriptions for company financials and intelligence, patent databases, and shipment-level trade datasets to confirm directional movements and to avoid double counting between closely related ingredient lines. This list is illustrative only, and many other public sources were also checked to collect data points, validate assumptions, and clarify definitions.
Primary Interviews and Surveys
Primary work focused on cross-checking how demand is formed across each major region and how pricing is moving for common specialty ingredient baskets. We spoke with ingredient suppliers, distributors, and food and beverage formulators, along with technical specialists, and then used these inputs to confirm inclusion boundaries, typical use rates, and how ASPs are applied across applications.
To keep the model realistic, respondent coverage was balanced across geographies and job roles, pairing strategic views with operational details on procurement, reformulation timing, and substitution behavior.
Distribution of primary research fieldwork respondents
| Company type | Respondent position | Region |
|---|---|---|
| Top tier: 34% | CXOs: 18% | APAC: 41% |
| Mid tier: 45% | Functional/Unit leaders: 32% | EMEA: 33% |
| Smaller Players: 21% | Managers: 50% | Americas: 26% |
Market-Sizing & Forecasting
Sizing was built using a mix of top-down and bottom-up logic, using global and regional food production, processed food output, and trade signals to reconstruct the demand pool for specialty ingredients, then applying application-level splits. After setting the demand pool, we used ingredient intensity ranges and pricing bands to translate volume signals into value, and then checked outcomes against supplier revenue exposure and channel feedback.
Key inputs that moved the model included packaged food and beverage output trends, reformulation activity such as sugar and salt reduction, clean-label adoption rates, plant-based product launches, and typical pass-through timing from raw material costs into ingredient ASPs. Forecasts were developed with scenario analysis, where base, faster reformulation, and slower consumption cases were discussed with industry experts and applied to the same demand indicators, so growth does not rely on a single assumption. Where bottom-up data was thin for smaller ingredient lines, gaps were handled through ratio-based extrapolation from comparable applications and then adjusted after interview checks.
Data Validation & Update Cycle
Outputs were validated through triangulation across independent signals, including food production and trade series, supplier commentary, and application-level demand checks from interviews. When a segment showed an unusual jump, we re-tested the driver by reviewing underlying inputs first, and then re-contacting respondents if the variance could not be explained by seasonality, price swings, or a definition mismatch.
Before sign-off, the model is reviewed in steps, including peer checks on assumptions, unit consistency, and currency treatment, followed by a final analyst pass to confirm the latest market events are captured. Reports are refreshed annually, with interim updates made when material events occur that can shift pricing, supply availability, or regional demand patterns.
Mordor Intelligence's Global Specialty Food Ingredients Market Market Size Versus Other Published Estimates
It is normal to see different market sizes for specialty food ingredients because publishers draw the market boundary in different ways and also pick different starting years. Differences also come from whether the estimate is built from demand indicators in food applications, or from supplier reported sales, which can mix food and adjacent end uses.
By tracking application-level demand signals and refresh-cadence inputs, Mordor Intelligence keeps the total tied to specialty ingredient use in food and beverage manufacturing, which helps avoid inflating the number with finished food sales or loosely related ingredient categories.
Benchmark comparison
| Source | Market Size | Gaps in Research Methodology |
|---|---|---|
| Mordor Intelligence | USD 174.19 B (2026) | |
| Global Consultancy A | USD 115.27 B (2025) | Uses a different base year and a narrower product boundary in its headline, which can exclude several specialty ingredient groups that are counted when they are sold into mainstream food applications. |
| Industry Publisher B | USD 128.35 B (2024) | Anchors the estimate on a 2024 base with a broad additive style definition, and the conversion from volume to value can differ due to currency timing and how average pricing is applied across regions and channels. |
The spread across the three values mainly comes from base-year choice and how wide the ingredient basket is drawn at the headline level. Our approach stays repeatable by tying value to clear demand pools by application and then cross-checking with supplier exposure and regional pricing logic, which helps keep the estimate stable when assumptions are updated.


Key Questions Answered in the Report
What is the projected value of the specialty food ingredients market by 2031?
The market is forecast to reach USD 220.43 billion by 2031 at a 4.82% CAGR.
Which product category is expected to expand fastest through 2031?
Functional Food Ingredients are projected to grow at a 4.91% CAGR as brands add probiotics, fibers, and plant sterols to mainstream foods.
Why is Asia-Pacific considered the most attractive growth region?
Rising disposable income, urbanization, and Westernization of diets are driving a 5.61% CAGR, outpacing all other regions in absolute growth.
How will upcoming FDA front-of-pack rules affect ingredient demand?
Rules mandating prominent added-sugar and sodium disclosures will accelerate adoption of natural sweeteners and low-sodium flavor systems.
Page last updated on:


 Your data is secure and never sold or shared.



