
Omega Ingredients Market Size and Share
Market Overview
| Study Period | 2021 - 2031 |
|---|---|
| Market Size (2026) | USD 4.12 Billion |
| Market Size (2031) | USD 5.95 Billion |
| Growth Rate (2026 - 2031) | 7.62 % |
| Fastest Growing Market | Asia Pacific |
| Largest Market | Asia Pacific |
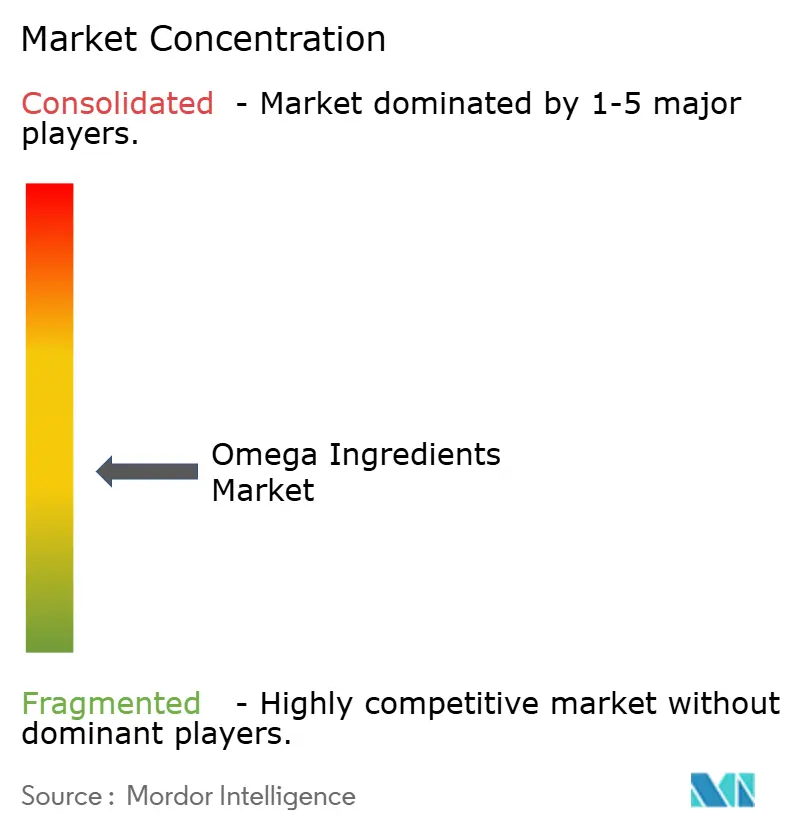
| Market Concentration | Medium |
Major Players
*Disclaimer: Major Players sorted in no particular order Image © Mordor Intelligence. Reuse requires attribution under CC BY 4.0. |
|
Omega Ingredients Market Analysis by Mordor Intelligence
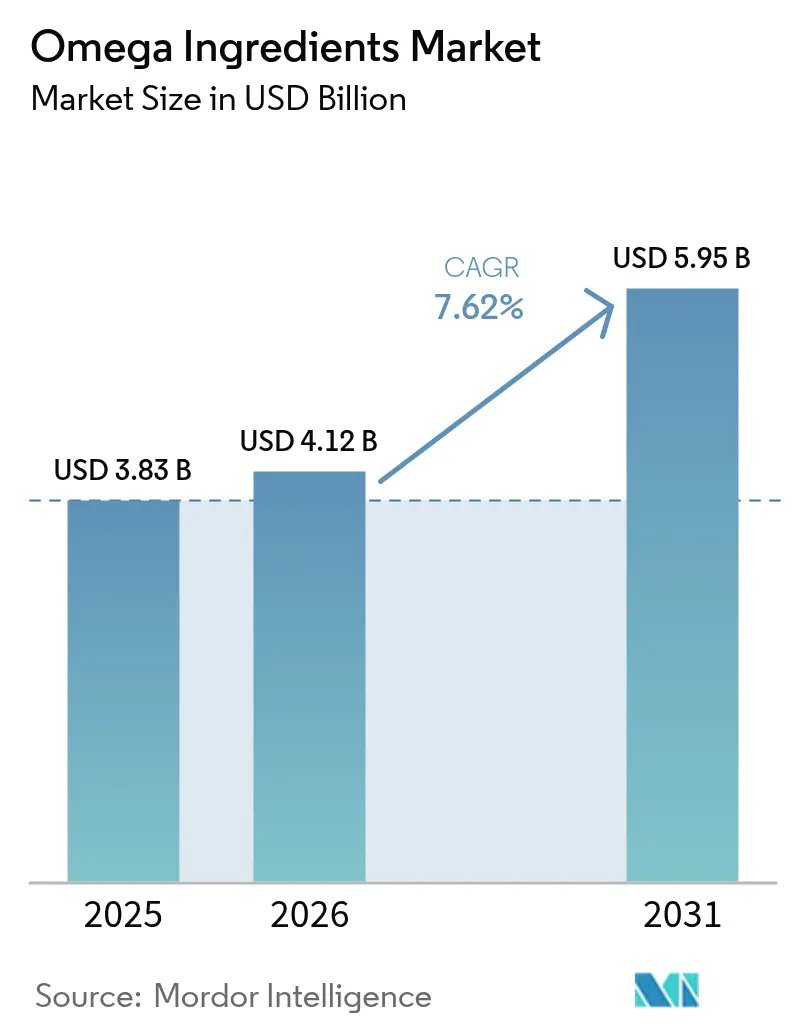
The Omega ingredients market size was valued at USD 3.83 billion in 2025 and estimated to grow from USD 4.12 billion in 2026 to reach USD 5.95 billion by 2031, at a CAGR of 7.62% during the forecast period (2026-2031). This growth reflects a robust compound annual growth rate (CAGR) of 8.29% during the forecast period. The market's expansion is primarily driven by increasing consumer awareness of the numerous health benefits associated with Omega ingredients, such as improved cardiovascular health, enhanced brain function, and anti-inflammatory properties. The rising incorporation of Omega ingredients in functional foods, dietary supplements, and pharmaceuticals is further propelling demand. Additionally, the growing preference for natural and sustainable ingredients across various industries, including personal care and animal nutrition, is contributing to market growth. Technological advancements in extraction methods, such as microencapsulation and fermentation, are enabling the development of innovative Omega-based products, which are expected to attract a broader consumer base.
Key Report Takeaways
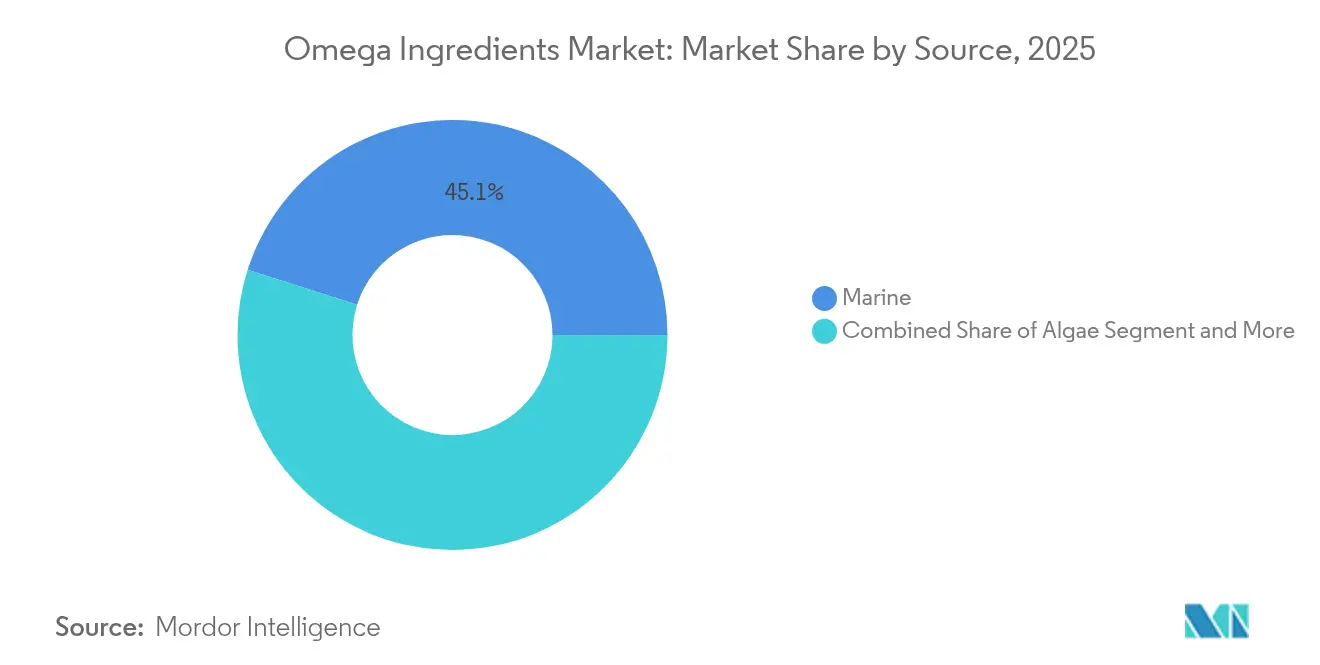
- By source, marine ingredients retained 45.10% of Omega ingredients market share in 2025, while algae-based alternatives are projected to grow at a 11.33% CAGR through 2031.
- By product type, omega-3 formulations led with 81.32% revenue share in 2025; the sub-segment is advancing at an 8.12% CAGR to 2031.
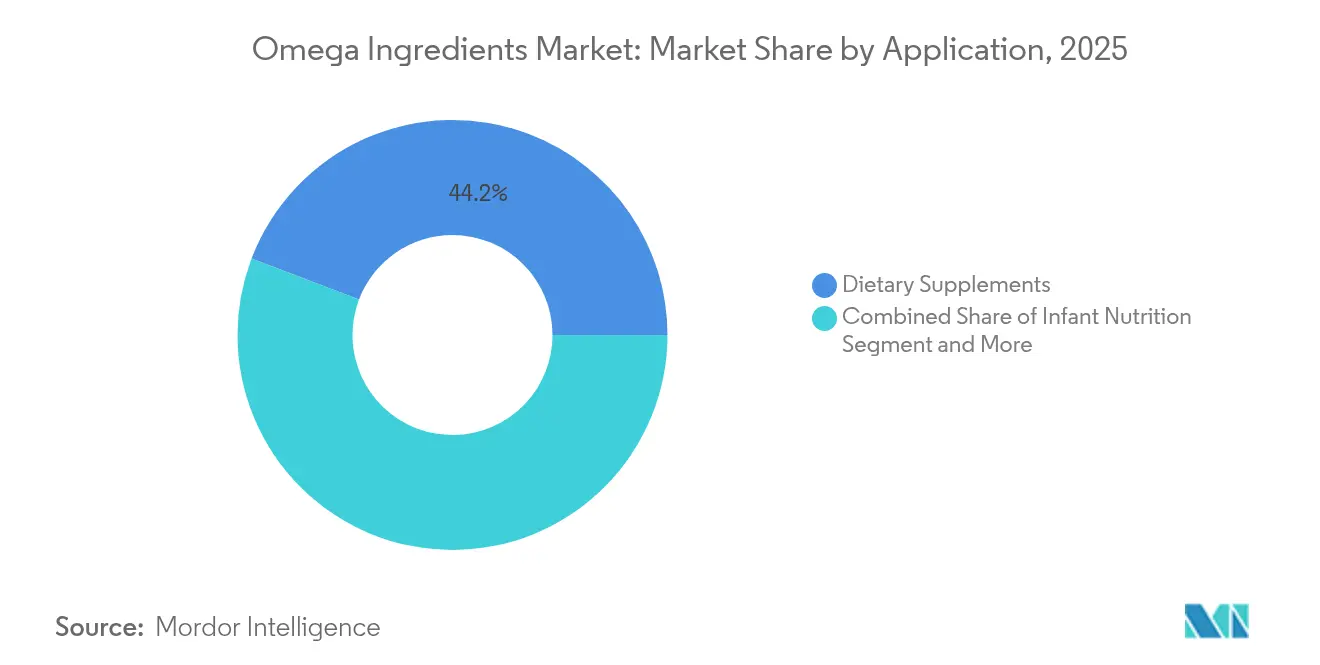
- By application, dietary supplements accounted for 44.21% of the Omega ingredients market size in 2025, while infant-formula applications are expanding at a 11.85% CAGR.
- By geography, Asia-Pacific commanded 48.20% revenue share of the Omega ingredients market in 2025 and is forecast to rise at a 12.78% CAGR through 2031.
Note: Market size and forecast figures in this report are generated using Mordor Intelligence’s proprietary estimation framework, updated with the latest available data and insights as of 2026.
Market Trends and Insights
Drivers Impact Analysis of Omega Ingredients Market*
| Driver | (~) % Impact on CAGR Forecast | Geographic Relevance | Impact Timeline |
|---|---|---|---|
| Increased Awareness of Omega-3's role in Heart, Brain, and Eye Health | +1.8% | Global, with premium markets leading adoption | Medium term (2-4 years) |
| Sustainability Concerns Driving Plant-Based Preference | +2.1% | North America and Europe, expanding to Asia-Pacific | Long term (≥ 4 years) |
| Growing Demand for Omega Ingredients in Functional Foods and Beverages | +1.5% | Asia-Pacific core, spill-over to Middle East and Africa | Medium term (2-4 years) |
| Advanced Technologies Enhance Extraction and Processing Efficiency | +1.2% | Global, concentrated in manufacturing hubs | Short term (≤ 2 years) |
| Rising Demand in Infant Nutrition Propelling the Market Growth | +2.3% | Global, regulatory-driven in Europe, expanding to Asia-Pacific | Medium term (2-4 years) |
| Technological Advancements in Production | +1.4% | Global, with innovation centers in US, Europe, Japan | Long term (≥ 4 years) |
| Source: Mordor Intelligence | |||
Increased Awareness of Omega-3's role in Heart, Brain, and Eye Health
Health-conscious consumers are increasingly incorporating omega-3s into mainstream food applications, moving beyond traditional supplements. The FDA's recent update in December 2024 on "healthy" claim criteria has further accelerated this trend, allowing foods with higher healthy fat content while limiting saturated fats. This regulatory change creates significant opportunities for omega-3 fortified products to qualify for the coveted "healthy" label, enhancing their market positioning and appeal to health-conscious consumers [1]Source: Food and Drug Administration, "Food Labeling: Nutrient Content Claims; Definition of Term “Healthy”, www.federalregister.gov. Clinical evidence continues to grow, highlighting omega-3's neuroprotective benefits, as aging populations actively seek solutions to support cognitive health and overall well-being. Research from institutions like Niigata University demonstrates the potential of engineered yeast to produce EPA with an impressive 85% lipid content, suggesting that advancements in bioavailability will further amplify the effectiveness of health messaging and consumer adoption. Regulatory backing and scientific validation are working in tandem, driving health awareness to translate into market premiums and shifting omega-3 products away from commodity pricing into higher-value segments. Meanwhile, plant-based beverage fortification addresses both health and sustainability concerns. This approach aligns with the preferences of environmentally conscious consumers and captures the growing flexitarian demographic, which seeks versatile and nutritious dietary options.
Sustainability Concerns Driving Plant-Based Preference
The increasing focus on sustainability is significantly driving the demand for plant-based alternatives in the global omega ingredients market. Consumers are becoming more aware of the environmental impact associated with traditional omega ingredient sources, such as fish oil, which often involve overfishing, habitat destruction, and high carbon emissions during production and transportation. This awareness has led to a growing preference for plant-based omega ingredients, which are perceived as more environmentally friendly and sustainable. Additionally, plant-based options, such as those derived from algae, flaxseed, chia seeds, and hemp, offer a viable alternative without compromising on nutritional benefits, including essential fatty acids like omega-3 and omega-6. The shift towards plant-based omega ingredients aligns with broader consumer trends favoring eco-conscious and ethically sourced products, further propelling market growth. Governments and regulatory bodies worldwide are also promoting sustainable practices, which indirectly support the adoption of plant-based omega ingredients. For instance, initiatives aimed at reducing overfishing and encouraging sustainable aquaculture practices have highlighted the need for alternative sources of omega ingredients. Moreover, advancements in technology and research have enabled the development of high-quality plant-based omega ingredients that can match or even surpass the efficacy of traditional sources. These innovations have made plant-based options more accessible and appealing to a wider consumer base, including vegetarians, vegans, and individuals with dietary restrictions.
Growing Demand for Omega Ingredients in Functional Foods and Beverages
Functional food applications expand beyond traditional supplements as food manufacturers integrate omega-3s into mainstream products, driven by consumer demand for convenient nutrition delivery and regulatory support for health claims. The fortification of plant-based beverages represents a strategic convergence, addressing both the omega-3 gap in plant-based diets and the growing flexitarian market segment. Nano-encapsulation technologies solve historical challenges of omega-3 integration, including oxidation susceptibility and taste masking, enabling incorporation into previously incompatible food matrices. The WIC program's 2024 revisions, which added canned fish to food packages for children and pregnant participants, signal institutional recognition of omega-3's nutritional importance and create precedent for broader food fortification initiatives [2]Source: Food and Nutrition Service (FNS), Department of Agriculture (USDA), "Special Supplemental Nutrition Program for Women, Infants, and Children (WIC): Revisions in the WIC Food Packages", www.federalregister.gov. Asian markets lead adoption with regulatory frameworks that accommodate functional food innovation, particularly as China's health food registration system expands to include candy and beverage formats with specific omega-3 content requirements. This regulatory flexibility creates first-mover advantages for companies that establish omega-3 functional food platforms in high-growth Asian markets.
Advanced Technologies Enhance Extraction and Processing Efficiency
Precision fermentation and metabolic engineering technologies reduce omega-3 production costs while improving yield consistency, creating competitive advantages for early adopters and enabling market expansion into price-sensitive applications. These technologies play a crucial role in addressing the challenges associated with traditional omega-3 production methods, such as high costs, inconsistent yields, and environmental concerns. By leveraging precision fermentation, manufacturers can produce omega-3 ingredients more sustainably and efficiently, reducing dependency on marine sources like fish oil. Metabolic engineering further optimizes the production process by modifying microbial strains to maximize output and quality. This combination not only lowers production expenses but also ensures a steady supply of high-quality omega-3 ingredients, making them more accessible for applications in food, beverages, dietary supplements, and pharmaceuticals. As a result, the adoption of these technologies is driving the expansion of the global omega ingredients market, particularly in regions and industries where cost sensitivity is a significant factor.
Restraints Impact Analysis of Omega Ingredients Market*
| Restraint | (~) % Impact on CAGR Forecast | Geographic Relevance | Impact Timeline |
|---|---|---|---|
| Limited Consumer Awareness in Emerging Economies | -1.2% | Asia-Pacific emerging markets, Middle East and Africa, South America | Medium term (2-4 years) |
| Challenges in Product Stability and Shelf-Life Management | -0.8% | Global, particularly in hot climates | Short term (≤ 2 years) |
| Supply Chain and Raw Material Constraints | -1.1% | Global, concentrated in marine-dependent regions | Medium term (2-4 years) |
| Lack of Standardized Recommended Daily Intake | -0.7% | Global, regulatory fragmentation across regions | Long term (≥ 4 years) |
| Source: Mordor Intelligence | |||
Challenges in Product Stability and Shelf-Life Management
Product stability and shelf-life management remain significant restraints in the global omega ingredients market. Ensuring the stability of omega ingredients, particularly omega-3 and omega-6 fatty acids, is challenging due to their susceptibility to oxidation, which can lead to reduced efficacy and shorter shelf life. According to the Food and Agriculture Organization (FAO), improper storage conditions and exposure to light, heat, and oxygen are primary factors contributing to the degradation of omega ingredients. Additionally, the Global Organization for EPA and DHA Omega-3s (GOED) highlights that maintaining the quality of omega ingredients during transportation and storage is a critical concern for manufacturers. The United States Food and Drug Administration (FDA) has also emphasized the importance of adhering to Good Manufacturing Practices to mitigate stability issues. Furthermore, the European Food Safety Authority (EFSA) has issued guidelines on the safe handling and storage of omega ingredients to preserve their nutritional value [3]Source: European Food Safety Authority, "EFSA assesses safety of long-chain omega-3 fatty acids", www.efsa.europa.eu. These challenges necessitate advanced packaging solutions, such as oxygen-impermeable materials and nitrogen flushing, as well as innovative stabilization techniques like microencapsulation. However, implementing these measures can significantly increase production costs, thereby impacting the overall growth of the omega ingredients market.
Limited Consumer Awareness in Emerging Economies
Limited consumer awareness in emerging economies acts as a significant restraint in the global omega ingredients market. Many consumers in these regions lack adequate knowledge about the health benefits and applications of omega ingredients, such as omega-3, omega-6, and omega-9 fatty acids. For instance, in countries like India and Indonesia, a large portion of the population remains unaware of the role omega-3 fatty acids play in improving heart health, brain function, and reducing inflammation. This lack of awareness hinders the adoption of omega-based products, including dietary supplements, functional foods, and pharmaceuticals. Additionally, misconceptions, such as the belief that omega ingredients are only necessary for specific demographics like athletes or the elderly, and limited access to reliable information further exacerbate the issue. For example, in rural areas of Africa, the availability of omega-enriched products is scarce, and consumers often prioritize basic nutritional needs over specialized health supplements. These challenges make it difficult for manufacturers to penetrate these markets effectively. Addressing this restraint requires targeted educational campaigns, such as community health programs and collaborations with healthcare professionals, to inform consumers about the advantages of omega ingredients and their role in promoting overall health and wellness.
*Our forecasts treat driver/restraint impacts as directional, not additive. The impact forecasts reflect baseline growth, mix effects, and variable interactions.
Omega Ingredients Market Segment Analysis
By Source:
Marine Dominance Faces Algae DisruptionIn 2025, marine ingredients held a dominant 45.10% share of the Omega ingredients market, bolstered by established infrastructures in Norway and Peru. Marine ingredients, derived primarily from fish oils and other aquatic sources, have long been the cornerstone of the Omega ingredients market due to their high concentration of essential fatty acids like EPA and DHA. These ingredients are widely used in dietary supplements, functional foods, and pharmaceuticals, driving their sustained demand. Additionally, the abundance of raw materials in regions like Norway and Peru, coupled with well-established supply chains, has ensured a steady production flow. Marine ingredients also benefit from ongoing innovations in extraction and purification technologies, which enhance the quality and bioavailability of Omega fatty acids.
Meanwhile, algae-based sources are making waves, expanding at a robust 11.33% CAGR, a trend set to reshape supply-security dynamics through 2031. Algae-based Omega ingredients are gaining traction as a sustainable and vegetarian alternative to marine sources. They are particularly appealing to consumers seeking plant-based options and to industries aiming to reduce dependency on marine ecosystems. This growth is further supported by advancements in algae cultivation technologies and increasing investments in research and development, which are enhancing production efficiency and cost-effectiveness. The evolving landscape of the Omega ingredients market highlights a shift toward diversification of sources, driven by consumer preferences, sustainability concerns, and supply chain considerations.



By Product Type:
Omega-3 Supremacy Drives InnovationOmega-3 products accounted for 81.32% revenue in 2025, underlining their anchor role within the Omega ingredients market.This segment is projected to grow at an 8.12% CAGR through 2031. The growth is driven by regulatory mandates, such as the EU's DHA floor for infant formulas, and increasing clinical validation of Omega-3's cardiovascular and cognitive health benefits. The rising demand for functional foods and dietary supplements further supports the expansion of this segment. Additionally, consumer awareness regarding the health benefits of Omega-3, including its role in reducing inflammation and supporting overall wellness, continues to fuel market growth. The segment's performance is also influenced by advancements in extraction technologies, ensuring higher purity and sustainability of Omega-3 products.
Furthermore, the growing adoption of Omega-3 in animal nutrition and pet food formulations highlights its expanding application scope within the market. The increasing penetration of Omega-3 in pharmaceutical applications, particularly in the development of prescription drugs targeting cardiovascular diseases, further underscores its critical role in the market. Moreover, the rising trend of plant-based Omega-3 sources, driven by the growing vegan and vegetarian population, is expected to create new growth opportunities. The market is also witnessing strategic collaborations and partnerships among key players to enhance product innovation and expand their global footprint, further propelling the growth of the Omega-3 segment within the Omega Ingredients Market.
By Application:
Supplements Lead While Infant Formula SurgesDietary supplements held 44.21% of the Omega ingredients market size in 2025, leveraging established e-commerce and pharmacy channels. Consumer familiarity with fish-oil capsules continues to sustain volume sales; however, growth is slowing as market penetration reaches saturation in developed economies. Additionally, the growing trend toward plant-based Omega ingredients is influencing the dietary supplements segment, driven by the increasing vegan population and heightened awareness of sustainable sourcing. Advancements in microencapsulation technology are also enhancing the stability and bioavailability of Omega ingredients, further supporting their adoption in dietary supplements.
The demand for infant formula is accelerating, driven by regulatory mandates requiring minimum DHA thresholds. This segment is expected to grow at a robust 11.85% CAGR through 2031, highlighting its critical role in the market's expansion. The inclusion of Omega ingredients in infant nutrition is gaining traction due to their proven benefits in cognitive and visual development. As regulatory bodies continue to emphasize the importance of DHA in infant diets, manufacturers are increasingly incorporating Omega ingredients into their formulations to meet these standards and cater to the growing demand for high-quality infant nutrition products.
Geography Analysis
APAC Omega Ingredients Market
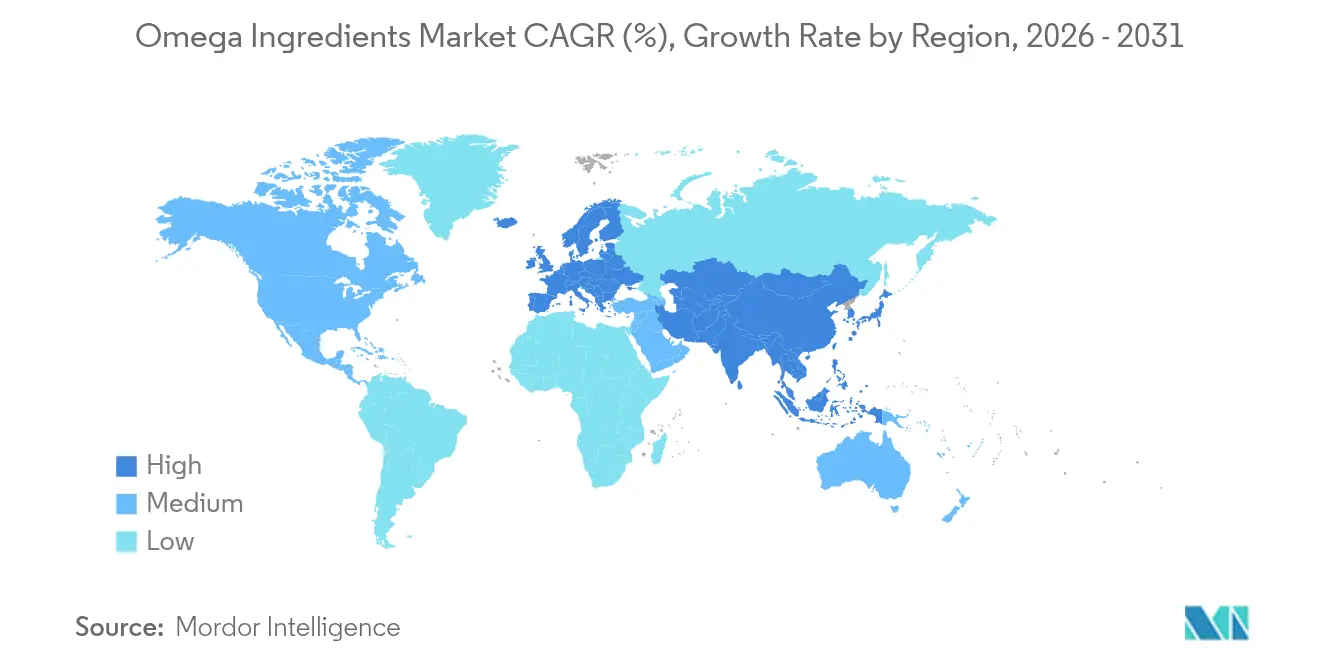
The Asia-Pacific region dominates the global omega ingredients market in 2025, holding a substantial 48.20% market share. It is also projected to achieve the fastest regional growth, with a robust CAGR of 12.78% through 2031. This growth is primarily driven by China's efforts to modernize its regulatory framework, which facilitates the adoption of omega-3 products. Additionally, India's rapidly expanding supplement market is contributing significantly to the region's growth, as consumer awareness regarding health and wellness continues to rise. Japan further strengthens the region's position with its technological advancements in omega-3 production, particularly in refining and innovating production processes to meet global demand efficiently.
North America Omega Ingredients Market
North America remains a key player in the omega ingredients market, supported by well-established supplement consumption patterns and regulatory frameworks that endorse omega-3 health claims. These factors have helped the region maintain a significant market presence. However, the region faces challenges in its supply chain as traditional marine sources of omega-3 encounter sustainability constraints. This has prompted a shift toward alternative sources, such as algae-based omega-3, which are gaining traction due to their environmental benefits and growing consumer preference for sustainable products. The region's ability to adapt to these changes will be critical in sustaining its market position.
EMEA and South America Omega Ingredients Market
Europe continues to lead in regulatory advancements, setting global standards for omega-3 production. The European Union's mandatory DHA requirements in infant formulas and the establishment of precision fermentation guidelines highlight the region's commitment to quality and safety. The European Food Safety Authority (EFSA) has further reinforced this leadership by approving multiple Schizochytrium strains for use in infant formula applications, showcasing confidence in the safety and efficacy of algae-based omega-3. Meanwhile, emerging markets in the Middle East and Africa and South America are showing promising growth potential. Economic development in these regions is driving increased healthcare spending and greater awareness of nutrition. However, fragmented regulatory frameworks pose challenges, necessitating localized market entry strategies to effectively tap into these opportunities.

Regulatory Landscape
Regulation for omega ingredients is shaped by food additive, novel food, labeling, and infant nutrition rules that set formulation limits, permitted sources, and the scope of health and nutrient claims. In the United States, the FDA finalized several color additive updates in February 2026 (including expanded use for spirulina extract and listing beetroot red as exempt from certification), reinforcing the broader shift toward naturally derived ingredients and tighter oversight of food ingredient compliance. Alongside this, FDA program priorities for 2026 include work items that affect how ingredient suppliers manage safety substantiation and submissions.
In Europe, the authorization environment continues to tighten around specifications and evidentiary requirements for ingredients used in foods. The European Commission adopted Regulation (EU) 2026/196 in January 2026, updating specifications for certain food additives, with applicability tied to an August 2026 effective date; these specification changes can affect stabilizers, texturizers, and delivery systems used alongside omega fortification. EFSA also updated its scientific guidance in 2026 on the data required for food additive authorization applications, raising the bar on dossiers and reinforcing the need for standardized analytical and safety data across suppliers serving multi-region customers.
Value Chain Analysis
The omega ingredients value chain starts with upstream raw materials and feedstocks (marine oils from fisheries and aquaculture byproducts, algae biomass, and plant oils such as flax and chia and other oilseeds), followed by intermediate processing that concentrates and refines fatty acid profiles through extraction, purification, concentration, and deodorization. Formulation steps such as stabilization, microencapsulation, and blending are then used to tailor oxidation stability, sensory performance, and dosage formats for downstream customers in dietary supplements, functional foods and beverages, infant nutrition, pharmaceuticals, and animal nutrition.
Distribution typically splits between direct supply to large brand owners and CMOs, and ingredient distributors serving mid-sized manufacturers, with quality documentation and traceability (specs, COAs, allergen statements, and shelf-life management) acting as gating factors. Logistics and availability remain key friction points for globally traded ingredients, and documented maritime disruption patterns, such as Red Sea-related delays reported for ingredient shipments, are reinforcing regionalized sourcing, dual qualification of suppliers, and more digitalized inventory controls. On the supply side, investments in plant-based ingredient capacity, including ADM announcing a capacity investment in April 2026 focused on plant-based production for the UK and Europe, show continued rebalancing toward non-marine inputs and more localized manufacturing footprints.
Competitive Landscape
The global omega ingredients market, characterized by a concentration index of 4 out of 10, demonstrates moderate fragmentation. This market structure creates significant opportunities for both consolidation and the entry of specialized players. As technological barriers continue to decline and regulatory frameworks increasingly favor producers focused on quality, the competitive landscape is evolving. Companies are leveraging these dynamics to establish a foothold in the market. Vertical integration strategies are becoming a key focus for major players. For instance, DSM-Firmenich recently divested its marine lipids operations to KD Pharma Group while retaining its algae-based production capabilities. This strategic move highlights a growing emphasis on sustainable sourcing, aligning with broader industry trends and consumer preferences for environmentally responsible products.
Technological advancements are playing a pivotal role in shaping the omega ingredients market. Companies with expertise in precision fermentation and advanced extraction methods are gaining a competitive edge. Patents related to the metabolic engineering of Yarrowia lipolytica for omega-3 production and the development of oxidatively stable formulations that enhance shelf life exemplify this trend. These innovations not only improve product quality but also address key challenges such as stability and scalability. As a result, technology adoption is becoming a critical factor for market players aiming to differentiate themselves and meet the growing demand for high-quality omega ingredients. The integration of cutting-edge technologies is also enabling producers to achieve greater efficiency and sustainability in their operations.
In the current competitive landscape, differentiation is increasingly driven by factors such as sustainability credentials, supply chain transparency, and regulatory compliance. Traditional cost competition is taking a backseat as consumers and regulatory bodies prioritize ethical and sustainable practices. Companies are focusing on building robust supply chains that ensure traceability and compliance with stringent regulations. This shift reflects a broader industry trend towards value-driven competition, where quality, sustainability, and transparency are paramount. As the market continues to evolve, players that align their strategies with these priorities are likely to gain a stronger foothold and capitalize on emerging opportunities in the global omega ingredients market.
Omega Ingredients Industry Leaders
-
BASF SE
-
Archer Daniels Midland Company
-
Cargill, Incorporated
-
DSM-Firmenich AG
-
Corbion N.V.
- *Disclaimer: Major Players sorted in no particular order
Omega Ingredients Market Companies Covered in this Report
- DSM-Firmenich AG
- BASF SE
- Archer Daniels Midland Company
- Cargill, Incorporated
- Corbion N.V.
- KD Pharma Group
- NU-MEGA Ingredients Pvt.Ltd.
- Polaris Inc.
- Aker BioMarine ASA
- GC Rieber VivoMega
- Golden Omega SA
- Croda International Plc
- Pelagia AS
- Veramaris V.O.F.
- Solutex GC SL
- Fermentalg SA
- Algaecytes Ltd
- Cellana Inc.
- Neptune Wellness Solutions
- Nordic Naturals Inc.

Market Opportunities and Future Outlook
Algae and fermentation-linked omega-3 supply expansion remains a clear whitespace area in a market where marine ingredients held 45.10% share in 2025, while algae-based alternatives are the fastest-growing source segment. The opportunity concentrates in supply security and specification-driven applications, particularly infant formula and premium supplements, where consistent DHA/EPA profiles, contaminant control, and traceability support qualification across multiple regulatory regimes. EFSA approvals for multiple Schizochytrium strains for infant formula use, alongside the continued emphasis on minimum DHA thresholds in infant nutrition, keeps algae-derived DHA positioned as a scalable alternative to fish oil for manufacturers balancing sustainability and compliance requirements.
Functional food and beverage fortification is another active commercialization track, supported by policy and labeling signals. In the United States, the FDA update to the definition of the “healthy” nutrient content claim finalized in December 2024 has encouraged reformulation pathways that accommodate healthier fat profiles, creating space for omega-fortified products that can meet claim criteria. Institutional nutrition programs also reinforce demand signals; USDA’s WIC food package revisions finalized in 2024 that added canned fish for certain participant groups underline omega-3 relevance in public nutrition frameworks. Suppliers are also investing in digital backbone and compliance processes to shorten customer qualification cycles, illustrated by Omega Ingredients implementing BatchMaster ERP in February 2026 to support formula management, inventory controls, and safety documentation workflows.
Recent Industry Developments in Omega Ingredients Market
- May 2026: BASF provided an update on aroma ingredients capacity plans, including world-scale projects for citral, menthol, and linalool at Zhanjiang, China and Ludwigshafen, Germany under 2026-dated development. While not omega actives, these investments signal continued capital deployment into high-volume ingredients and integrated production platforms relevant to broader functional ingredient supply chains.
- February 2026: Omega Ingredients implemented BatchMaster ERP to improve manufacturing execution, formula management, and inventory controls, including shelf-life handling and FIFO/LIFO workflows. Strengthening digital traceability and compliance documentation supports faster customer onboarding and more consistent quality delivery for omega-containing formulations across food, supplements, and adjacent applications.
- November 2025: BASF entered into a binding agreement to sell its global glycinate business to Biochem, with closing targeted for the first quarter of 2026. The transaction reflects ongoing portfolio reshaping in nutrition-related ingredient lines, with implications for supplier concentration and sourcing strategies used by customers formulating across human and animal nutrition.


Omega Ingredients Market Report Scope and Research Methodology
Market Definition and Coverage
In this methodology, the omega ingredients market covers ingredient-grade omega fatty acids supplied from marine, algae, and plant sources for use in food and beverages, dietary supplements, pharmaceuticals, infant formula, and animal nutrition, measured in value terms.
Scope exclusions: Finished consumer products and retail supplement brands are excluded, and only the ingredient value is counted.
Segments Covered in This Report
-
By Source
-
Marine
- Fish
- Krill
- Algae
- Plants
-
Marine
-
By Product Type
-
Omega-3
- Eicosapentaenoic Acid (EPA)
- Docosahexaenoic Acid (DHA)
- Blends
- Omega-6 and Omega 9
-
Omega-3
-
By Application
- Food and Beverages
- Infant Formula
- Dietary Supplements
- Pharmaceuticals
- Animal Nutrition
-
By Geography
-
North America
- United States
- Canada
- Mexico
- Rest of North America
-
Europe
- United Kingdom
- Germany
- Spain
- France
- Italy
- Russia
- Rest of Europe
-
Asia-Pacific
- China
- India
- Japan
- Australia
- Rest of Asia-Pacific
-
South America
- Brazil
- Argentina
- Rest of South America
-
Middle East and Africa
- Saudi Arabia
- South Africa
- Rest of Middle East and Africa
-
North America
Data Sources, Market Sizing, and Validation
Desk Research
Desk research was used to set the market boundary and to collect the basic demand and supply signals that can be checked repeatedly. We reviewed public nutrition and health references and food regulation materials, because these sources often describe where omega fortification is allowed and how claims are presented.
For factual anchoring, we relied on non-paywalled sources such as FAO fisheries and aquaculture statistics, USDA food and agriculture datasets, European Commission food law pages, EFSA opinions, and NIH Office of Dietary Supplements factsheets, along with company filings, investor presentations, reputable press, and association publications. Patent databases were also reviewed to track processing and stabilization trends that can affect pricing. This list is illustrative only, and many other sources were used for collection, validation, and clarification.
Primary Interviews and Surveys
Primary interviews focused on confirming what counts as an omega ingredient sale, how pricing moves across grades, and how demand differs by application. We spoke with stakeholders across ingredient supply, downstream formulation, and procurement, and then reconciled responses across major consuming regions to keep assumptions aligned with observed buying patterns.
Distribution of primary research fieldwork respondents
| Company type | Respondent position | Region |
|---|---|---|
| Top tier: 26% | CXOs: 12% | APAC: 47% |
| Mid tier: 60% | Functional/Unit leaders: 38% | EMEA: 32% |
| Smaller Players: 14% | Managers: 50% | Americas: 21% |
Market-Sizing & Forecasting
The sizing starts with a top-down build where production and trade signals are translated into an addressable ingredient demand pool, and then adjusted for application usage that is supported by expert checks. To keep the totals realistic, we corroborate the result with selective bottom-up approximations such as sampled supplier revenues, application-wise volume splits, and typical price-per-kg ranges by grade.
Inputs used in the model include omega type mix (omega-3, omega-6, omega-9), source mix (marine, algae, plant), application shares, observed price spreads between food-grade, supplement-grade, and pharmaceutical-grade material, and region-level adoption signals linked to infant formula and nutrition labeling rules. When a bottom-up check has gaps, the missing share is filled using conservative ranges from comparable applications and then re-tested with interview feedback.
For forecasting, scenario analysis is used around the core CAGR path, since supply constraints in marine inputs and faster adoption of algae-based omega can shift the mix and the average selling price. Assumptions on mix change and pricing are reviewed with primary respondents so the forecast stays close to how contracts and reformulations tend to happen in practice.
Data Validation & Update Cycle
We cross-check the model output against independent signals such as ingredient trade movement, source-level availability, and application demand direction, and then review any large variances before sign-off. If a country or application shows an unusual jump, the related assumptions are re-opened, and targeted re-contacts are triggered with relevant respondents.
Before delivery, the full workbook goes through a multi-step analyst review so calculation logic, conversions, and year alignment are consistent. Reports are refreshed annually, and interim updates are made when material events occur such as major regulatory changes, supply disruptions, or sharp price movements.
Mordor Intelligence's Omega Ingredients Market Size Versus Other Published Estimates
Published market numbers for omega ingredients can vary widely, even when the topic sounds the same, because scope lines are drawn differently and pricing assumptions do not match. Differences also come from whether the estimate is anchored on ingredient sales versus finished products, and whether application coverage is complete.
The benchmark table shows a spread that is mainly explained by what gets included as revenue and how the base year is chosen. In the Mordor Intelligence model, the value is limited to omega ingredient sales across marine, algae, and plant sources used in food and beverages, supplements, pharmaceuticals, infant formula, and animal nutrition, rather than counting branded end products or broader nutrition blends.
Benchmark comparison
| Source | Market Size | Gaps in Research Methodology |
|---|---|---|
| Mordor Intelligence | USD 3.83 B (2025) | |
| Industry Publisher A | USD 5.83 B (2025) | This estimate appears to use a broader revenue boundary by folding in adjacent nutrition ingredient mixes and, in some cases, finished supplement value, which inflates the comparable base-year total. |
| Trade Data Summary B | USD 4.90 B (2025) | The figure is closer in year but seems to lean on a more aggressive price progression and a narrower validation loop, with less separation between pharmaceutical-grade material and general-use concentrates. |
Looking at the three values together, the main takeaway is that a like-for-like comparison depends on the same ingredient-only boundary and consistent price and mix logic. When scope is kept tied to ingredient sales and checked against multiple demand and supply signals, the resulting market size is easier to trace and repeat in future updates.


Key Questions Answered in the Report
What is the current value of the Omega ingredients market?
The Omega ingredients market size is USD 4.12 billion in 2026 with a 7.62% CAGR outlook to 2031.
Which region leads global demand?
Asia-Pacific holds 48.20% of market revenue and is expanding at a 12.78% CAGR through 2031.
Why are algae-based sources gaining ground?
Algae oils avoid marine-contaminant risks, meet stricter sustainability rules, and now reach cost parity with fish oil.
Is the market fragmented or consolidated?
With a concentration score of 4, the market is moderately fragmented, offering scope for both strategic acquisitions and specialist entries.
Page last updated on:


 Your data is secure and never sold or shared.


