Electric Van Market Size and Share
Market Overview
| Study Period | 2019 - 2030 |
|---|---|
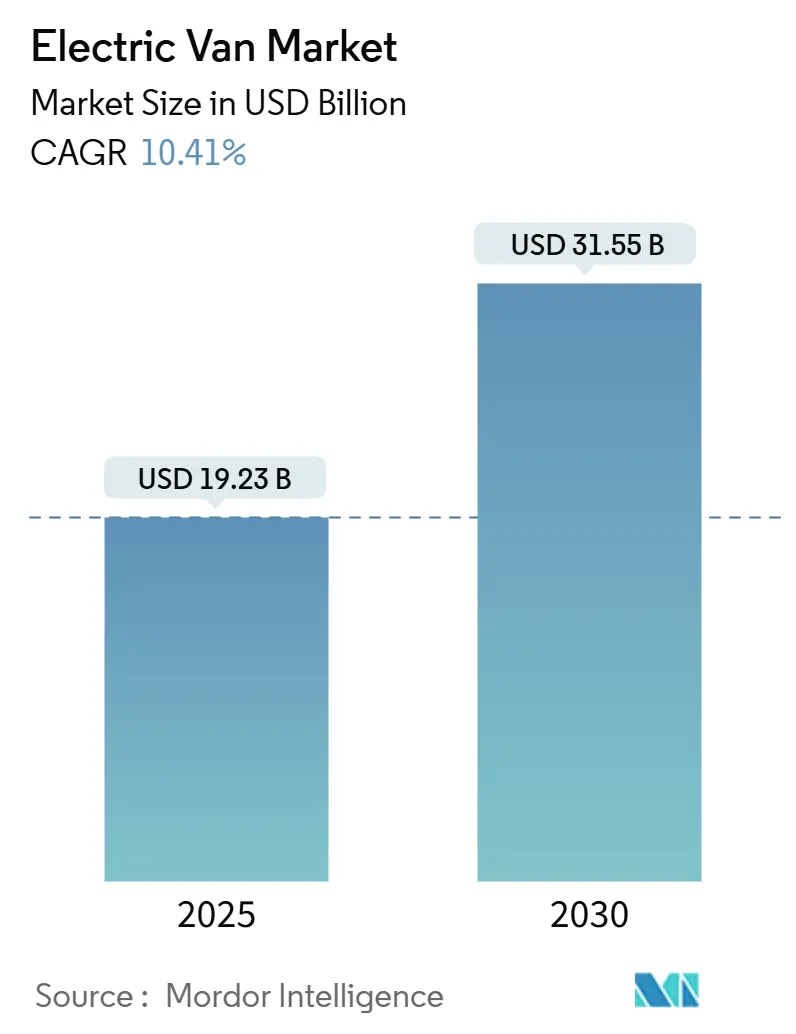
| Market Size (2025) | USD 19.23 Billion |
| Market Size (2030) | USD 31.55 Billion |
| Growth Rate (2025 - 2030) | 10.41% CAGR |
| Fastest Growing Market | Asia Pacific |
| Largest Market | Asia Pacific |
| Market Concentration | Medium |
Major Players
*Disclaimer: Major Players sorted in no particular order Image © Mordor Intelligence. Reuse requires attribution under CC BY 4.0. |
|
Electric Van Market Analysis by Mordor Intelligence
The electric van market size stood at USD 19.23 billion in 2025 and is projected to climb to USD 31.55 billion by 2030, advancing at a 10.41% CAGR over the forecast period. Fleet‐wide decarbonization deadlines, rapid battery cost deflation, and favorable total cost of ownership (TCO) economics combine to keep the electric van market on an upward trajectory. Urban delivery operators face binding zero-emission vehicle (ZEV) quotas that shorten replacement cycles, while second-life battery leasing models lower upfront capital outlays and improve residual value certainty. Meanwhile, skateboard chassis architectures let manufacturers launch multiple body styles from common platforms and accelerate time-to-market. Competitive intensity is rising as Chinese exporters scale aggressively, incumbents double down on integrated service bundles, and startups push drive-by-wire and 800 V charging features that trim braking distance by 10% and boost real-world range by 5%.
Key Report Takeaways
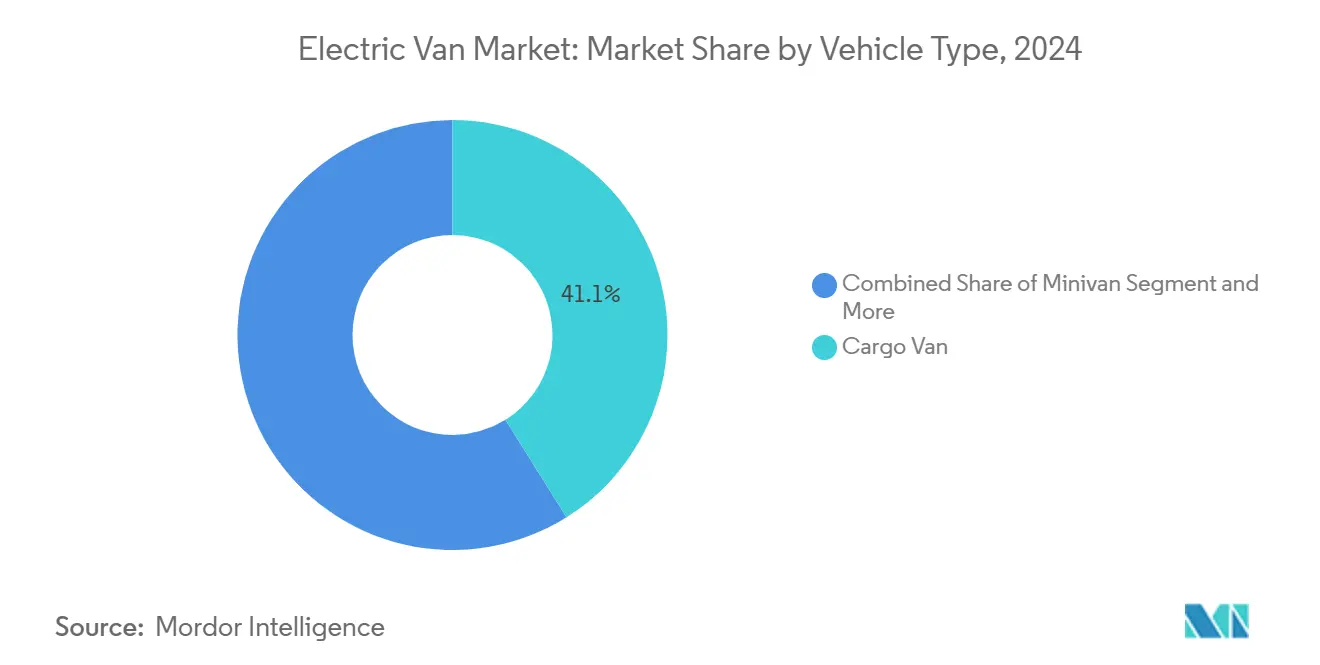
- By vehicle type, cargo vans led with 41.06% revenue share in 2024, whereas panel vans are expanding at a 16.31% CAGR through 2030.
- By propulsion, battery electric vehicles accounted for an 86.61% slice of the electric van market share in 2024, while plug-in hybrid variants posted the fastest 23.12% CAGR.
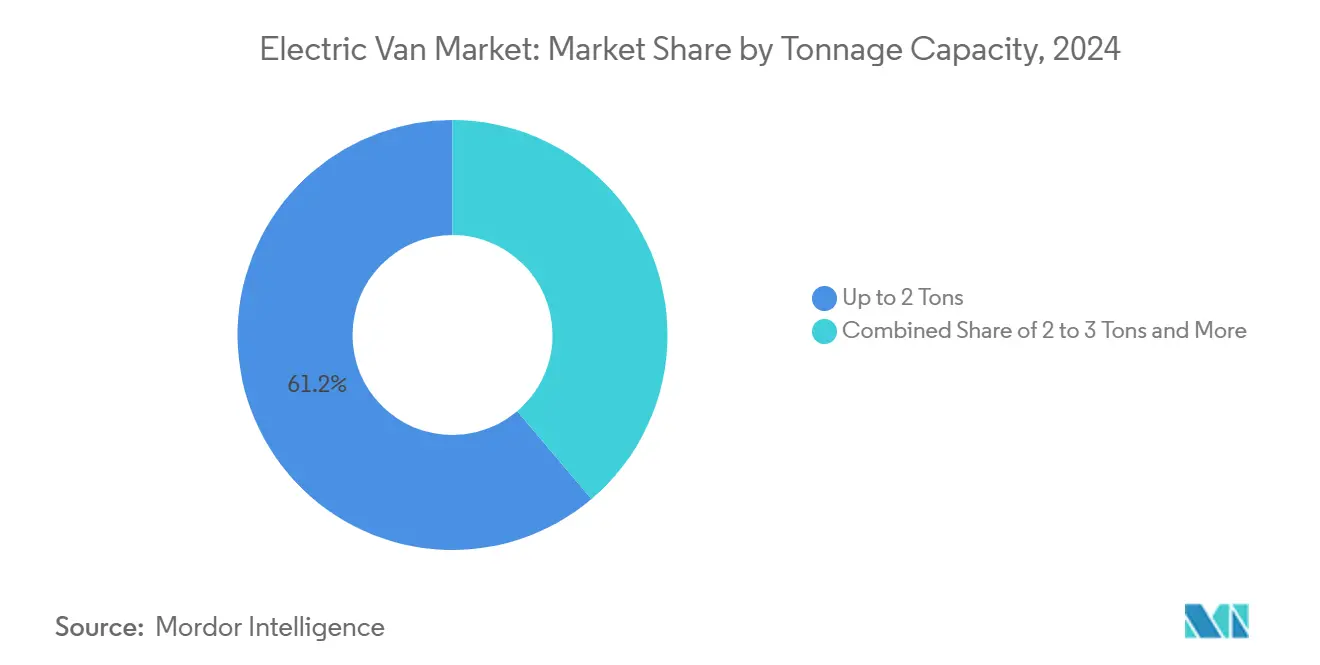
- By tonnage, up to 2 tons captured 61.19% share of the electric van market size in 2024, yet the 3–5.5 tons bracket is growing quickest at 18.78% CAGR.
- By end-use, commercial fleets commanded 91.14% of 2024 sales; personal adoption, though small, is accelerating at an 11.61% CAGR.
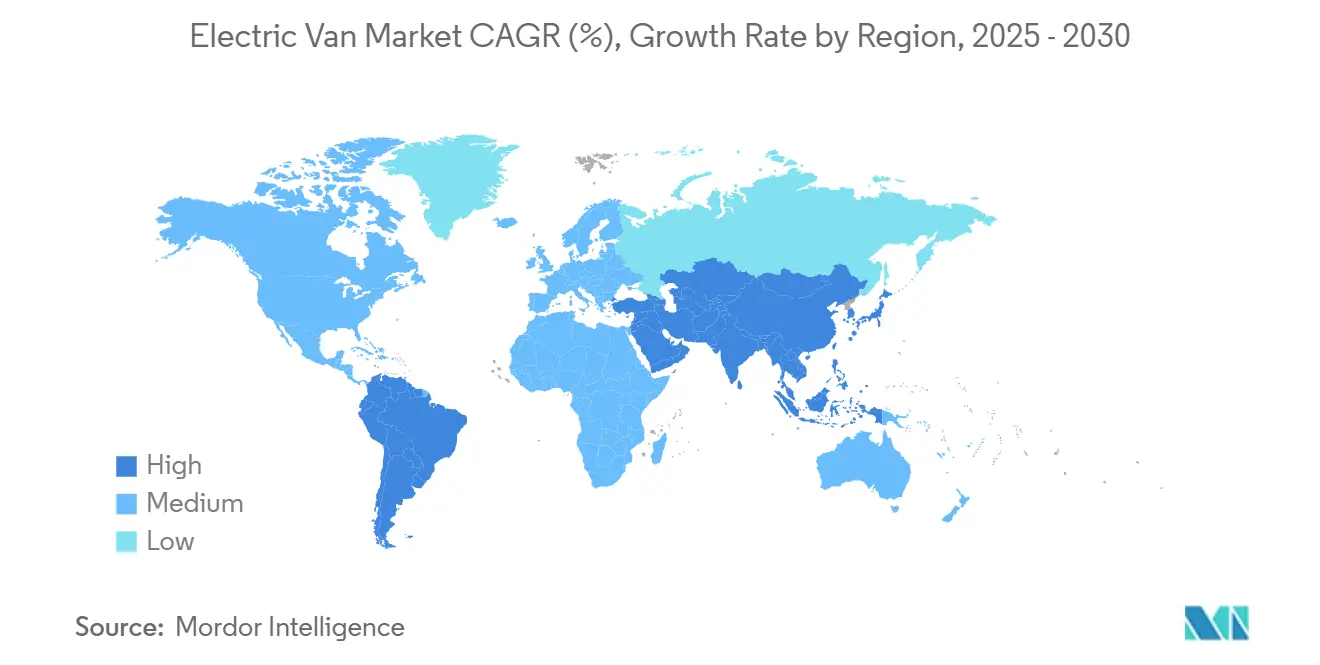
- Asia-Pacific dominated geographic demand, with a 45.72% share of the electric van market in 2024; the region is also forecast to deliver the highest 14.32% CAGR to 2030.
Note: Market size and forecast figures in this report are generated using Mordor Intelligence’s proprietary estimation framework, updated with the latest available data and insights as of January 2026.
Global Electric Van Market Trends and Insights
Drivers Impact Analysis*
| Driver | (~) % Impact on CAGR Forecast | Geographic Relevance | Impact Timeline |
|---|---|---|---|
| Government ZEV Mandates on Urban Delivery Fleets | +2.1 | Europe, North America, Asia-Pacific urban centers | Medium term (2-4 years) |
| Falling TCO from Second-life Battery Leasing Models | +1.8 | Global, with early adoption in Europe and North America | Long term (≥ 4 years) |
| E-commerce Same-day Delivery Pushing Depot Rapid-charge Infrastructure | +1.5 | Global, concentrated in major logistics hubs | Short term (≤ 2 years) |
| EU CO₂ Fleet-average Tightening for Light Commercial Vehicles Post-2025 | +1.2 | Europe, with spillover to other regions adopting similar standards | Medium term (2-4 years) |
| Chinese Export Surge of Low-cost Electric Vans to Emerging Markets | +1.1 | Asia-Pacific and Latin America, expanding to Africa | Short to medium term (≤ 4 years) |
| Development of Modular Skateboard Platforms Enabling Multi-tonnage Variants | +1.0 | Global, with focus in North America, Europe, and Asia-Pacific | Medium term (2-4 years) |
| Source: Mordor Intelligence | |||
Government ZEV Mandates on Urban Delivery Fleets
Regulatory frameworks increasingly target commercial vehicles as the next frontier for emission reductions, with urban delivery fleets facing mandatory electrification timelines that compress traditional fleet replacement cycles. The UK's Zero Emission Vehicle mandate requires 70% of new vans sold to be zero-emission by 2030, while California's Advanced Clean Fleets regulation mandates 100% zero-emission purchases for large fleets by 2024. These mandates create artificial demand spikes that exceed natural fleet turnover rates, forcing accelerated capital deployment. Fleet operators respond by negotiating extended lease terms and seeking guaranteed residual values to mitigate regulatory compliance costs. The regulatory cascade effect emerges as municipal contracts increasingly specify zero-emission requirements, creating secondary demand pressure beyond direct mandates.
Falling TCO from Second-Life Battery Leasing Models
Battery leasing arrangements decouple the highest-cost component from vehicle ownership, fundamentally altering fleet acquisition economics and enabling smaller operators to access electric van technology. Second-life applications for degraded EV batteries in stationary energy storage create residual value streams that reduce effective battery costs by 20-30% over the vehicle lifecycle. Fleet operators benefit from predictable monthly battery costs while avoiding technology obsolescence risks as battery chemistry advances. This model proves particularly attractive for urban delivery applications where daily mileage patterns allow precise battery degradation modeling. The approach enables fleet electrification without large capital commitments, accelerating adoption among cost-sensitive operators who previously viewed electric vans as financially prohibitive.
E-commerce Same-Day Delivery Pushing Depot Rapid-Charge Infrastructure
The proliferation of same-day delivery services creates operational demands that favor electric vans equipped with rapid-charging capabilities over traditional overnight charging models. Prologis developed modular charging platforms supporting up to 1.2 MW capacity with 8 ports per installation, specifically targeting logistics facilities near major ports where land availability constrains expansion[1]"Geely brand Farizon launches electric van in Europe," Electrive, electrive.com.. These depot installations integrate solar generation and battery storage to create microgrids that reduce grid connection costs while providing backup power during outages. The infrastructure investment creates competitive moats for logistics operators while enabling multiple daily delivery cycles that maximize vehicle utilization. Fleet operators increasingly specify rapid-charging capability as a prerequisite for van procurement, driving OEM focus toward 800V architectures and megawatt charging compatibility.
EU CO₂ Fleet-Average Tightening for Light Commercial Vehicles Post-2025
European Union regulations extending CO₂ fleet-average requirements to light commercial vehicles create compliance pressures that favor electric van adoption over incremental internal combustion engine efficiency improvements. The regulatory framework applies penalties for exceeding fleet-average emissions targets, making electric vans essential for manufacturers to avoid substantial financial penalties. This regulation particularly impacts manufacturers with strong commercial vehicle portfolios who must balance passenger car and commercial vehicle emissions across their entire fleet. The compliance timeline coincides with battery cost reduction trajectories, creating a regulatory-economic convergence that accelerates electric van deployment. Manufacturers respond by prioritizing electric van development over diesel efficiency improvements, recognizing that regulatory compliance requires zero-emission solutions rather than incremental improvements.
Restraints Impact Analysis*
| Restraint | (~) % Impact on CAGR Forecast | Geographic Relevance | Impact Timeline |
|---|---|---|---|
| Limited Public Fast-charging Layout for Class-II and III Vans | -1.4 | Global, particularly acute in rural and suburban areas | Medium term (2-4 years) |
| Payload Penalty due to Battery Mass in 3 to 5.5 Ton Segment | -0.9 | Global, with regulatory mitigation in select markets | Short term (≤ 2 years) |
| Upstream Battery-grade Graphite Supply Bottlenecks after 2027 | -0.8 | Global, with strongest impact in Asia-Pacific and resource-constrained regions | Long term (≥ 4 years) |
| Residual Value Uncertainty Depressing Fleet Leasing Uptake | -0.7 | Europe and North America, with growing concerns in Asia-Pacific | Medium term (2-4 years) |
| Source: Mordor Intelligence | |||
Limited Public Fast-Charging Layout for Class-II and III Vans
Public charging infrastructure development prioritizes passenger vehicles over commercial applications, creating operational constraints for electric vans that operate beyond depot-based routes. Class-II and III vans require higher power charging rates and longer dwell times than passenger vehicles, yet most public charging stations lack the 150kW+ capacity needed for efficient commercial vehicle charging. The infrastructure gap proves particularly problematic for inter-city delivery routes where depot charging becomes impractical. Fleet operators report that charging infrastructure availability ranks as the primary constraint on electric van deployment, ahead of vehicle purchase costs or range limitations. The mismatch between infrastructure investment timelines and fleet electrification mandates creates operational risks that delay adoption decisions.
Payload Penalty Due to Battery Mass in 3 to 5.5 Ton Segment
Battery weight reduces available payload capacity in larger electric vans, creating operational inefficiencies that offset fuel cost savings and complicate fleet transition planning. The 3 to 5.5 ton segment experiences the most severe payload penalties, with battery packs typically reducing cargo capacity by 300-500 kg compared to diesel equivalents. Fleet operators must deploy additional vehicles to maintain cargo capacity, increasing total fleet costs and negating some environmental benefits. Regulatory responses vary by market, with the UK raising gross vehicle weight limits to 4.25 tons for electric vans, while other jurisdictions maintain traditional weight restrictions. The payload penalty diminishes as battery energy density improves, yet current technology limitations constrain adoption in weight-sensitive applications.
*Our forecasts treat driver/restraint impacts as directional, not additive. The impact forecasts reflect baseline growth, mix effects, and variable interactions.
Segment Analysis
By Vehicle Type: Panel Vans Lead Growth Trajectory
Panel vans demonstrate the fastest growth at 16.31% CAGR (2025-2030), outpacing the established cargo van segment that maintains the largest market share at 41.06% in 2024. This growth differential reflects panel vans' superior adaptability for specialized conversions, including mobile workshops, refrigerated units, and last-mile delivery applications that require customized interior configurations. Cargo vans retain dominance through established logistics partnerships and standardized fleet procurement processes, while passenger vans serve niche applications in urban shuttle services. Minivans occupy the smallest segment but benefit from personal-use adoption as urban families embrace zero-emission mobility for daily transportation needs.
The segment dynamics reveal a strategic shift toward application-specific vehicle design rather than one-size-fits-all approaches. Mercedes-Benz's VAN.EA architecture, launching in 2026, incorporates 800V electrical systems and 22kW AC charging specifically designed for panel van applications requiring extended stationary periods. This technological differentiation enables manufacturers to command premium pricing for specialized applications while maintaining cost-competitive offerings in high-volume cargo van segments. The trend toward modular platforms allows single production lines to serve multiple vehicle types, reducing manufacturing complexity while enabling rapid market response to emerging applications.


By Propulsion Type: Hybrid Technologies Bridge Infrastructure Gaps
Battery electric vehicles command 86.61% market share in 2024, yet plug-in hybrid electric variants exhibit the fastest growth at 23.12% CAGR as fleet operators hedge against charging infrastructure limitations. This growth pattern reflects pragmatic fleet management strategies that prioritize operational continuity over pure zero-emission operation. Hybrid electric systems occupy a diminishing role as battery costs decline and charging infrastructure expands, while plug-in hybrid configurations provide range assurance for inter-city delivery routes.
The propulsion type segmentation reveals geographic variations in adoption patterns, with battery electric dominance in urban markets contrasting with hybrid preference in rural applications. Fleet operators increasingly specify plug-in hybrid systems for mixed-duty cycles that combine urban delivery with longer-range requirements, enabling single-fleet solutions rather than maintaining separate vehicle types. This operational flexibility proves particularly valuable for smaller fleet operators who lack the scale to justify specialized vehicle assignments. The segment evolution suggests a temporary role for hybrid technologies as charging infrastructure matures and battery energy density improves.
By Tonnage Capacity: Heavier Segments Accelerate Despite Challenges
The up to 2 tons category maintains 61.19% market share in 2024, reflecting established urban delivery applications and favorable economics for battery electric operation. However, the 3 to 5.5 tons segment demonstrates the fastest growth at 18.78% CAGR as payload penalties diminish through regulatory adaptations and improved battery technology. The 2 to 3 tons segment occupies a transitional role, serving applications that require greater capacity than light-duty vans while avoiding the payload constraints of heavier categories.
Weight category growth patterns reflect evolving logistics strategies that favor larger vehicles for route consolidation and operational efficiency. Regulatory frameworks increasingly accommodate electric van weight penalties, with the UK's gross vehicle weight increase to 4.25 tons providing a template for other jurisdictions facing similar payload constraints. The heavier segment acceleration indicates fleet operator confidence in infrastructure development and battery technology improvements that will resolve current operational limitations. This trend creates opportunities for manufacturers developing specialized heavy-duty electric van platforms rather than adapting passenger vehicle architectures.
By End-Use: Personal Adoption Accelerates from Low Base
Commercial applications dominate with 91.14% market share in 2024, reflecting the segment's origins in fleet electrification mandates and total cost of ownership advantages for high-utilization vehicles. Personal use exhibits the fastest growth at 11.61% CAGR despite the small absolute market size, driven by urban consumers seeking zero-emission alternatives for family transportation and recreational activities. This growth trajectory suggests expanding market addressability beyond traditional commercial applications.
Personal adoption patterns concentrate in urban markets with established charging infrastructure and environmental awareness, creating geographic clusters of consumer demand. The segment expansion benefits from commercial vehicle development, which reduces costs and improves reliability through higher production volumes and operational testing. Personal users increasingly value electric vans for their quiet operation, instant torque delivery, and lower maintenance requirements than diesel alternatives. This dual-market development creates economies of scale that benefit commercial and personal segments while expanding the total addressable market for electric van manufacturers.
Geography Analysis
Asia-Pacific leads with 45.72% market share in 2024 and the fastest regional growth at 14.32% CAGR (2025-2030), driven by China's manufacturing dominance and aggressive export strategies targeting emerging markets. Chinese manufacturers like BYD and SAIC leverage domestic scale to offer electric vans priced 2-3 times lower than European competitors, creating competitive pressure that accelerates global adoption[2]"Changan and Ganfeng team up for solid-state batteries,"Electrive, electrive.com.. India emerges as a key growth market with Tata Motors commanding a significant market share in electric commercial vehicles, selling 5,590 units in FY2024 while expanding charging infrastructure through partnerships with Tata Power's 200+ fast charging stations. Thailand positions itself as a regional production hub with 400,000-500,000 EVs annual capacity, serving both domestic demand and export markets across Southeast Asia. The regional growth trajectory reflects government support for electric vehicle manufacturing and rapidly expanding urban logistics networks that favor zero-emission delivery solutions.
Europe maintains significant market presence despite facing competitive pressure from Chinese imports, with regulatory frameworks like the EU's CO₂ fleet-average requirements creating sustained demand for electric commercial vehicles. The region benefits from established automotive manufacturing capabilities and early adoption of zero-emission mandates that create predictable fleet replacement cycles. European manufacturers respond through technological differentiation, with Mercedes-Benz's VAN.EA architecture and Stellantis' 10-year supply agreement with Iveco demonstrate a focus on premium features and integrated service offerings. The competitive landscape intensifies as Chinese brands like Farizon establish European operations, offering drive-by-wire technology and modular platforms that challenge traditional design approaches.
North America experiences steady growth driven by federal incentives and state-level zero-emission mandates, with California's Advanced Clean Fleets regulation creating mandatory adoption timelines for large fleet operators. The region benefits from domestic manufacturing capabilities through General Motors' BrightDrop integration into Chevrolet's dealer network and Ford's E-Transit range improvements that deliver up to 32% additional range for high-roof configurations. Market development focuses on depot-based charging infrastructure and fleet service integration rather than public charging networks, reflecting the commercial-first adoption pattern. South America, the Middle East, and Africa represent emerging opportunities with limited current market presence but growing interest in electric commercial vehicles for urban delivery applications and government fleet modernization programs.

Competitive Landscape
The electric van market exhibits moderate fragmentation with established automotive manufacturers competing against specialized EV startups and aggressive Chinese exporters pursuing global market share. Traditional OEMs leverage existing dealer networks and service capabilities while adapting internal combustion platforms for electric powertrains, creating competitive advantages in fleet service and parts availability. Emerging players focus on purpose-built electric architectures and innovative business models, including battery leasing and integrated charging solutions that address fleet operator concerns about technology obsolescence and operational complexity.
Strategic patterns emphasize platform modularity and vertical integration, with manufacturers developing skateboard architectures that support multiple vehicle configurations from single production lines. Kia's PV5 commercial vehicle launch demonstrates this approach through the E-GMP.S platform that enables rapid variant development, while Renault's merger with Volvo and CMA CGM creates new electric skateboard platforms targeting 2026 production.
White-space opportunities emerge in specialized applications, including refrigerated transport, mobile workshops, and heavy-duty urban delivery, where payload requirements exceed current battery technology capabilities. Technology differentiation focuses on drive-by-wire systems, wireless charging integration, and AI-powered fleet management software that optimize route planning and charging schedules for operational efficiency.
Electric Van Industry Leaders
-
Renault Group
-
Stellantis N.V.
-
Ford Motor Company
-
SAIC Motor Corp. Ltd.
-
Toyota Motor Corporation
- *Disclaimer: Major Players sorted in no particular order

Recent Industry Developments
- March 2025: Workhorse Group received Transport Canada clearance to bring W56 and W750 electric delivery vans to Canadian commercial truck dealers, expanding North American market presence beyond existing FedEx and Pride Group partnerships.
- March 2025: Changan Cars Philippines announced showcase of 4 new-energy vehicles at Manila International Auto Show 2025, including E07 crossover/pickup and Q05 SUV variants from the Changan 101 mid-range EV family, demonstrating Southeast Asian market expansion.


Global Electric Van Market Report Scope
| Cargo Van |
| Passenger Van |
| Minivan |
| Panel Van |
| Up to 2 Tons |
| 2 to 3 Tons |
| 3 to 5.5 Tons |
| Hybrid Electric |
| Plug-in Hybrid Electric |
| Battery Electric |
| Commercial |
| Personal |
| North America | United States |
| Canada | |
| Rest of North America | |
| South America | Brazil |
| Argentina | |
| Rest of South America | |
| Europe | United Kingdom |
| Germany | |
| Spain | |
| Italy | |
| France | |
| Russia | |
| Rest of Europe | |
| Asia-Pacific | India |
| China | |
| Japan | |
| South Korea | |
| Rest of Asia-Pacific | |
| Middle East and Africa | United Arab Emirates |
| Saudi Arabia | |
| Turkey | |
| Egypt | |
| South Africa | |
| Rest of Middle East and Africa |
| By Vehicle Type | Cargo Van | |
| Passenger Van | ||
| Minivan | ||
| Panel Van | ||
| By Tonnage Capacity | Up to 2 Tons | |
| 2 to 3 Tons | ||
| 3 to 5.5 Tons | ||
| By Propulsion Type | Hybrid Electric | |
| Plug-in Hybrid Electric | ||
| Battery Electric | ||
| By End-Use | Commercial | |
| Personal | ||
| By Region | North America | United States |
| Canada | ||
| Rest of North America | ||
| South America | Brazil | |
| Argentina | ||
| Rest of South America | ||
| Europe | United Kingdom | |
| Germany | ||
| Spain | ||
| Italy | ||
| France | ||
| Russia | ||
| Rest of Europe | ||
| Asia-Pacific | India | |
| China | ||
| Japan | ||
| South Korea | ||
| Rest of Asia-Pacific | ||
| Middle East and Africa | United Arab Emirates | |
| Saudi Arabia | ||
| Turkey | ||
| Egypt | ||
| South Africa | ||
| Rest of Middle East and Africa | ||


Key Questions Answered in the Report
What is the 2025 value of the electric van market?
It reached USD 19.23 billion in 2025.
How fast will Asia-Pacific’s electric van demand grow through 2030?
The region is projected to post a 14.32% CAGR, the highest worldwide.
Which propulsion technology is expanding quickest in electric vans?
Plug-in hybrid vans are growing at a 23.12% CAGR as fleets hedge against sparse charging infrastructure.
Which tonnage class will see the fastest expansion?
The 3–5.5 tons bracket is expected to advance at an 18.78% CAGR as weight waivers and better batteries ease payload penalties.
Why do fleet operators favor battery leasing?
Leasing detaches the most expensive component, lowering effective TCO by up to 30% and alleviating technology-obsolescence risks.
What regulatory change in the UK benefits heavier electric vans?
The country raised the weight limit for electric light commercial vehicles from 3.5 tons to 4.25 tons, easing payload constraints.
Page last updated on:


