Market Overview
| Study Period | 2019 - 2031 |
|---|---|
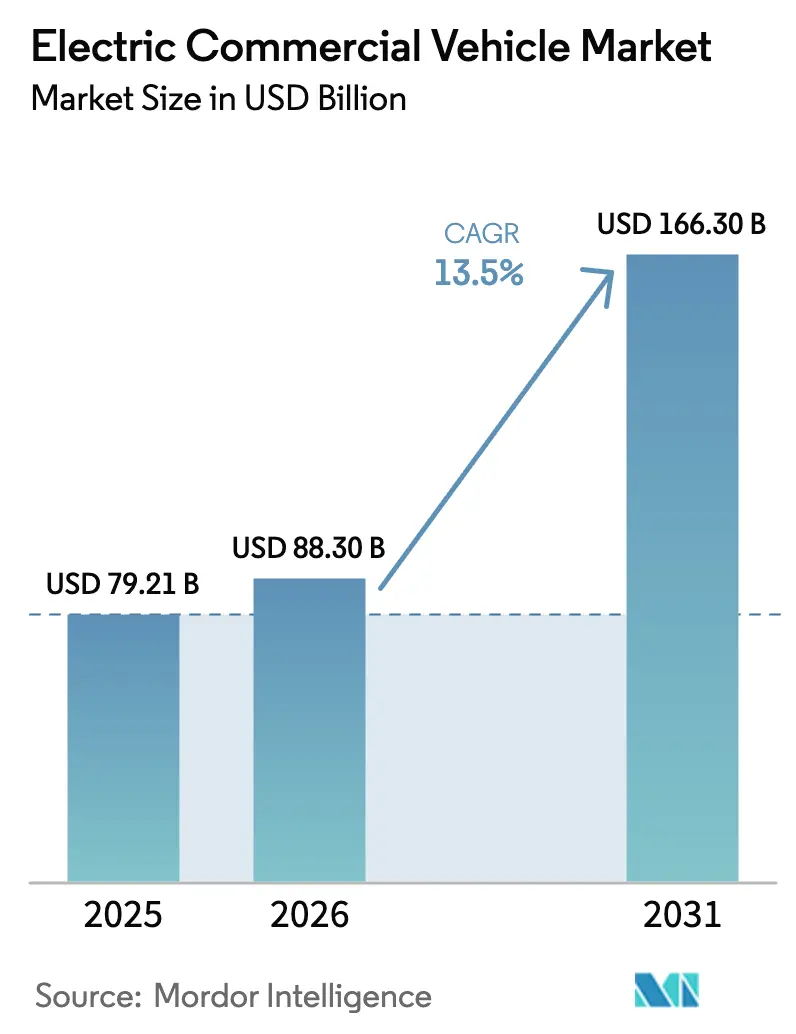
| Market Size (2026) | USD 88.30 Billion |
| Market Size (2031) | USD 166.30 Billion |
| Growth Rate (2026 - 2031) | 13.50% CAGR |
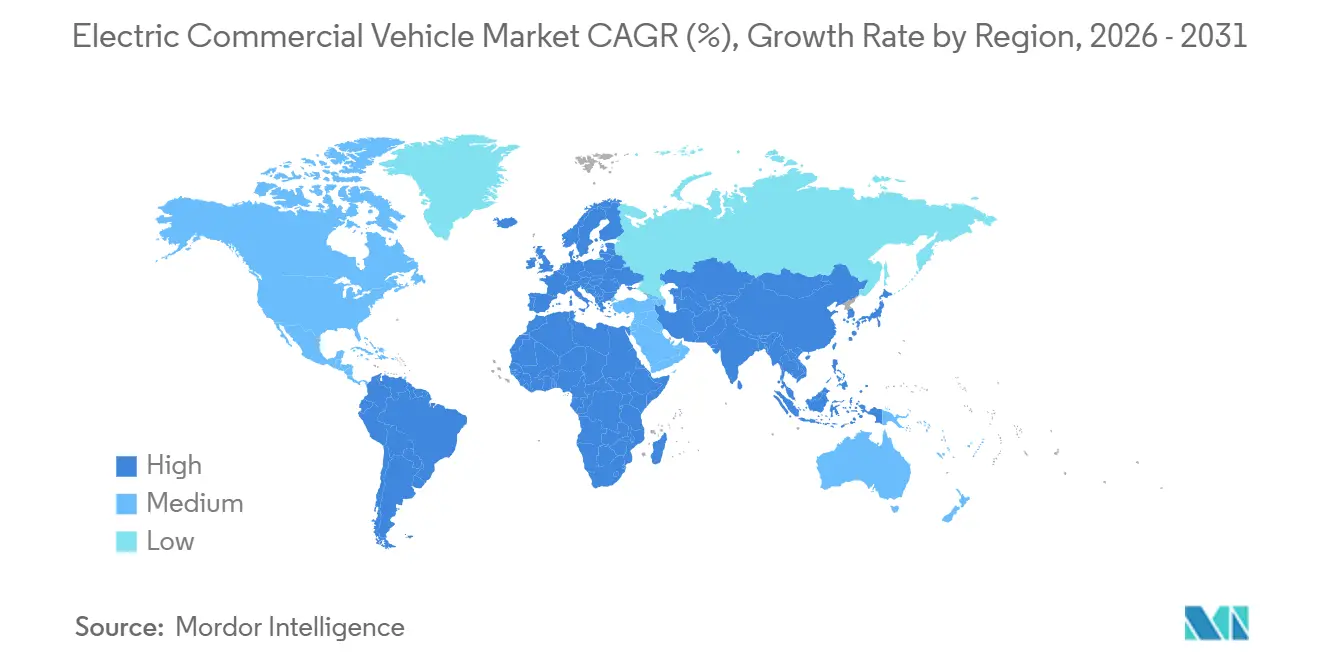
| Fastest Growing Market | Middle East and Africa |
| Largest Market | Asia Pacific |
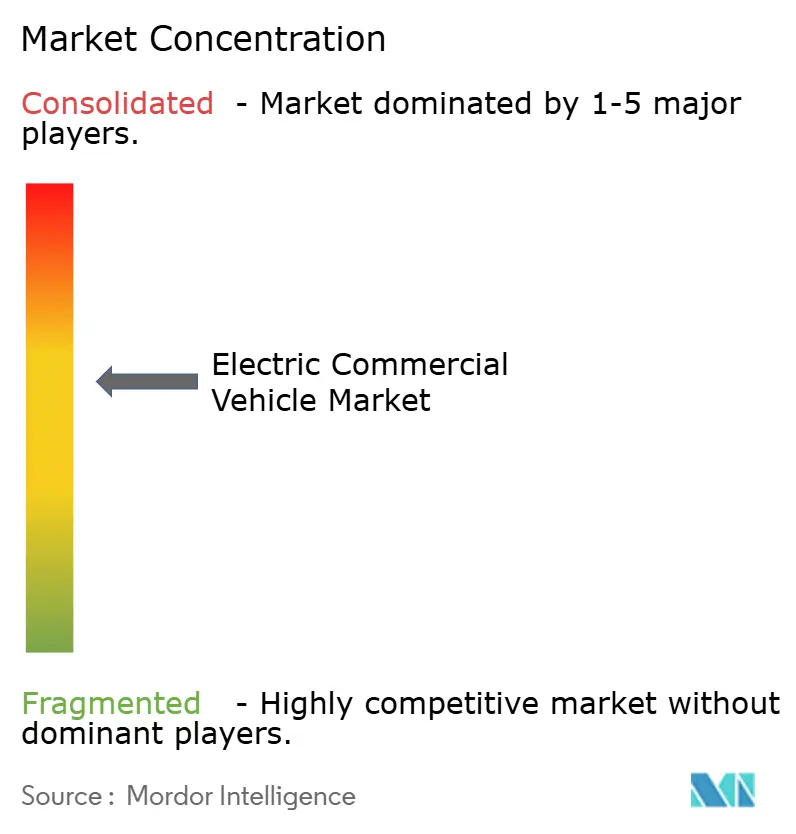
| Market Concentration | Medium |
Major Players
*Disclaimer: Major Players sorted in no particular order Image © Mordor Intelligence. Reuse requires attribution under CC BY 4.0. |
|
Electric Commercial Vehicle Market Analysis by Mordor Intelligence
The electric commercial vehicle market size is expected to increase from USD 79.21 billion in 2025 to USD 88.30 billion in 2026 and reach USD 166.30 billion by 2031, growing at a CAGR of 13.5% over 2026-2031. Declining battery pack prices have pushed total ownership costs to parity with diesel across most urban and regional duty cycles, accelerating private-sector adoption. Regulatory mandates on both sides of the Atlantic are synchronizing supply and demand; the United States Environmental Protection Agency now requires a notable share of new heavy-duty sales to be zero-emission by 2032, while Europe enforces a 45% CO₂ cut for heavy trucks by 2030 [1]“Revised CO₂ Standards for Heavy-Duty Vehicles,” European Commission, europa.eu. China’s NEV development plan targets new energy vehicles reaching 20% of total new car sales by 2025. Together, these forces reshape fleet economics, expand manufacturer product lines, and attract capital into charging and hydrogen infrastructure, positioning the electric commercial vehicle market for sustained double-digit growth through the decade.
Key Report Takeaways
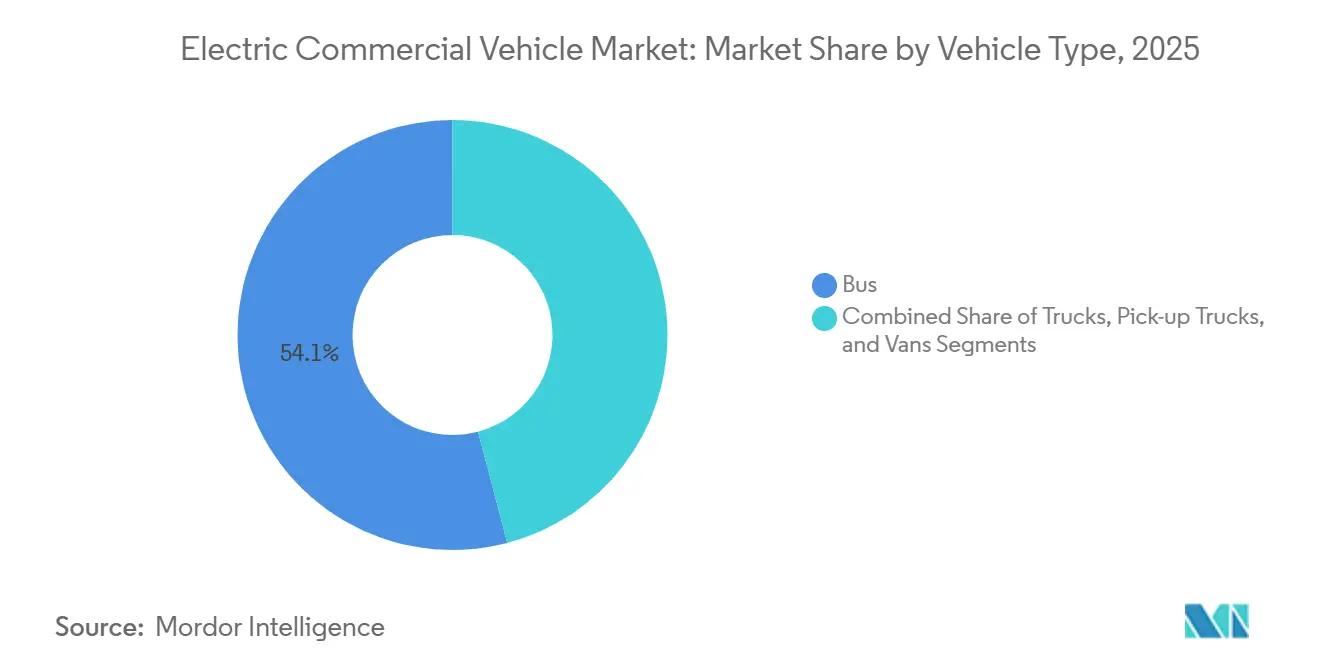
- By vehicle type, buses held 54.12% of the electric commercial vehicle market share in 2025, while trucks are forecast to post a 17.15% CAGR to 2031.
- By propulsion, battery-electric models commanded 82.36% of the electric commercial vehicle market in 2025, and fuel-cell variants are advancing at a 25.01% CAGR through 2031.
- By power output, 150-250 kW held 46.25% share in 2025, while the greater than 250 kW segment will grow at a 15.23% CAGR by 2031.
- By battery capacity, the 100-200 kWh range held a 50.12% share in 2025, while the greater than 200 kWh range is expected to grow at a 14.62% CAGR by 2031.
- By range, vehicles covering 150-300 miles of distance held 48.22% share in 2025, while the greater than 300 miles segment will grow at a 20.13% CAGR by 2031.
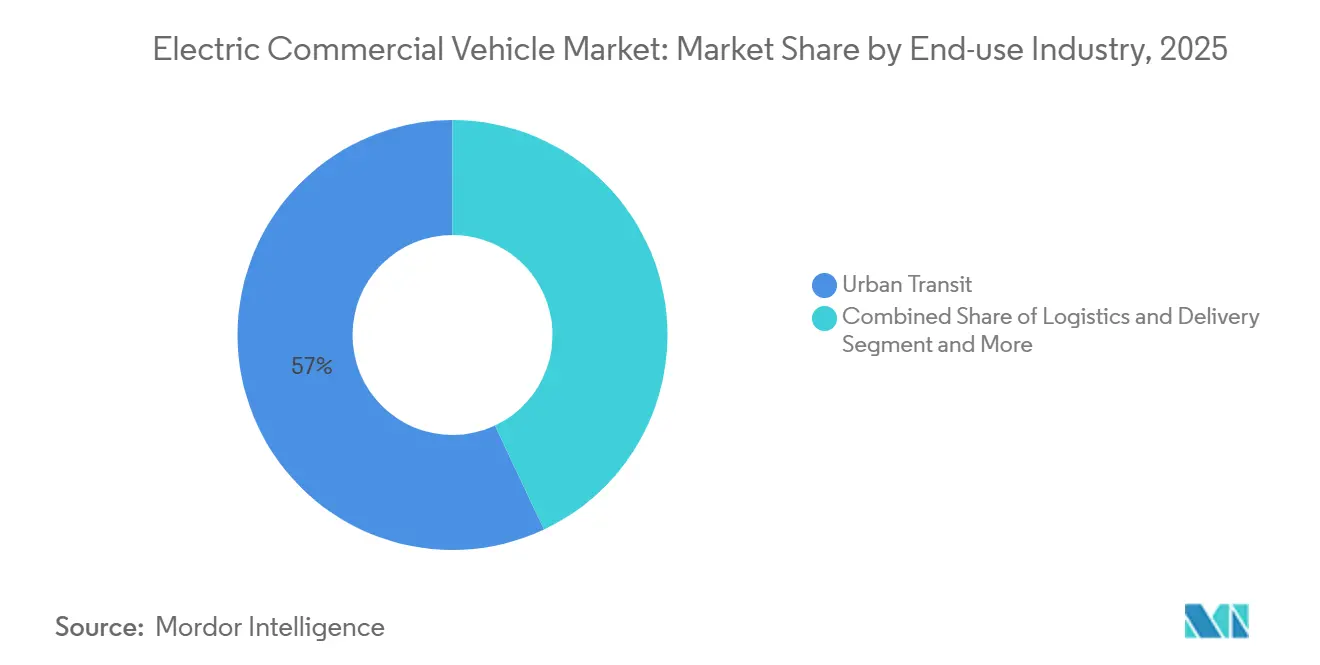
- By end-use industry, urban transit accounted for 57.03% of demand in 2025, and logistics and delivery are growing at a 16.44% CAGR through 2031.
- By charging type, depot AC charging accounted for 68.24% of the market in 2025, while opportunity/en-route DC charging is set to expand at an 18.33% CAGR by 2031.
- By geography, Asia-Pacific accounted for 62.18% of global revenue in 2025; the Middle East and Africa region is expected to expand at a 14.18% CAGR through 2031.
Note: Market size and forecast figures in this report are generated using Mordor Intelligence’s proprietary estimation framework, updated with the latest available data and insights as of January 2026.
Global Electric Commercial Vehicle Market Trends and Insights
Drivers Impact Analysis*
| Driver | (~) % Impact on CAGR Forecast | Geographic Relevance | Impact Timeline |
|---|---|---|---|
| Battery Costs Drive Breakeven | +4.1% | Global | Short term (≤ 2 years) |
| Zero-Emission Fleet Mandates | +3.2% | United States, EU, China, India | Medium term (2-4 years) |
| E-commerce Boosts E-Delivery | +2.8% | North America, Europe, Asia-Pacific | Short term (≤ 2 years) |
| Hydrogen Hubs Fuel Cells | +2.3% | United States, Japan, South Korea, EU | Long term (≥ 4 years) |
| E-Bus Financing Programs | +1.8% | India, Southeast Asia, South America, Africa | Medium term (2-4 years) |
| Noise Regulations Drive E-Freight | +1.5% | Europe, North America | Medium term (2-4 years) |
| Source: Mordor Intelligence | |||


Rapid Battery-Cost Decline Below USD 100/kWh Driving TCO Breakeven
In early 2025, lithium-iron-phosphate cell prices reached a significant milestone, crossing the breakeven threshold for high-mileage trucks. CATL's latest-generation cells offer enhanced energy density and cost efficiency, enabling extended ranges without exceeding axle-weight limits. When considering fuel and maintenance savings, Daimler Trucks' eCascadia demonstrates a notable cost advantage over diesel alternatives on regional routes in California. Reflecting a shift in market dynamics, PACCAR reported that a substantial portion of its 2025 orders were placed without relying on subsidies, highlighting the growing economic feasibility of these technologies. Projections suggest further cost reductions in the coming years, potentially eliminating the need for purchase incentives across most operational scenarios.
Government-funded Zero-Emission Fleet Procurement Mandates
The European Commission’s revised heavy-duty CO₂ standards stipulate a 45% cut by 2030 and a 90% cut by 2040, effectively sunsetting new diesel in medium-duty classes. China’s dual-credit scheme rewards over-compliance, prompting BYD to attribute a significant share of its 2025 domestic commercial sales to the incentive framework. India’s FAME-III allocates substantial funding to electric buses and charging infrastructure, with a particular focus on Delhi, Mumbai, and Bengaluru. Such programs spur bulk procurement, accelerate learning curves, and tighten supply chains faster than organic demand growth alone.
E-commerce-led Surge in Urban Last-Mile Delivery Vehicles
Parcel volumes in leading e-commerce markets increased significantly year over year in 2025, driving demand for battery-electric vans suited to dense routes. Amazon has rolled out more than 30,000 custom electric delivery vans from Rivian across the U.S., cutting per-package emissions compared to diesel and demonstrating the operational fit of electrification in last-mile logistics[2]"Everything you need to know about Amazon’s electric delivery vans from Rivian," Amazon, amazon.com. DHL is investing significantly to electrify its van fleet by the end of the forecast period, leveraging the economic benefits of operating in low-emission zones. London's Ultra Low Emission Zone, now covering all boroughs, imposes daily fees on non-compliant vans. This regulatory framework encourages a shift toward electric vehicles, particularly for routes with higher delivery volumes. Urban operations with frequent usage achieve cost recovery quickly, highlighting the critical role of delivery fleets in driving operational growth.
Hydrogen Hub Investments Accelerating Fuel-cell Trucks
By the end of the decade, the United States Department of Energy aims to introduce a significant number of fuel-cell trucks at California ports, supported by a major hydrogen hub program. Japan is planning to establish numerous refueling stations along key corridors to enhance hydrogen infrastructure. South Korea is focusing on increasing the adoption of fuel-cell trucks by providing substantial subsidies and maintaining affordable hydrogen prices. Hyundai's fleet has demonstrated the efficiency and practicality of fuel-cell technology for long-haul operations with quick refueling times. In Europe, a consortium is working to develop a comprehensive network of heavy-duty refueling stations across the continent. These coordinated efforts collectively strengthen the potential for scaling up fuel-cell technology in the heavy-duty vehicle segment.
Restraints Impact Analysis*
| Restraint | (~) % Impact on CAGR | Geographic Relevance | Impact Timeline |
|---|---|---|---|
| Fast-Charger Grid Constraints | −2.1% | North America, Europe, India | Medium term (2-4 years) |
| Battery Pack Payload Penalties | −1.6% | North America, Europe, China | Medium term (2-4 years) |
| Limited Residual-Value Benchmarking | −1.3% | Global | Long term (≥ 4 years) |
| High-Voltage Technician Scarcity | −1.1% | India, Southeast Asia, LatAm, Africa | Long term (≥ 4 years) |
| Source: Mordor Intelligence | |||
Commercial-grade Fast-Charger Grid Constraints on Highway Freight Corridors
The United States operates a limited number of heavy-duty DC chargers above 350 kW, falling short of corridor requirements. In Europe, interconnection queues are significantly long, delaying site energization and pushing fleets onto regional routes. Electrify America notes that a significant portion of its planned truck sites require substation upgrades, each of which entails substantial costs. Meanwhile, India's National Highways Authority has activated only a fraction of its planned truck-charging plazas, with full commissioning now delayed. These grid bottlenecks hinder the potential for long-haul battery-electric penetration until megawatt charging becomes more prevalent.
Payload Penalties from Large Battery Packs in Long-haul Segments
A large battery pack significantly reduces legal payloads in markets with strict gross weight limits. While exemptions exist in some regions, they are insufficient to fully address the revenue gaps for bulk haulers. Users of electric trucks on weight-sensitive routes face notable revenue losses per trip. Even as battery density improves, the gap will narrow but persist, keeping hydrogen as the favored choice for long-haul freight.
*Our forecasts treat driver/restraint impacts as directional, not additive. The impact forecasts reflect baseline growth, mix effects, and variable interactions.
Segment Analysis
By Vehicle Type: Buses Lead, Trucks Accelerate on Logistics Demand
Buses accounted for 54.12% of 2025 revenue, reflecting long procurement cycles and public subsidies that favor fleet-wide deployment in city transit systems, giving the electric commercial vehicle market size a bus-centred foundation. Trucks, however, are growing at 17.15% CAGR through 2031 as e-commerce giants electrify last-mile and regional routes. In recent years, BYD has delivered a significant number of electric buses globally, with the majority allocated to Chinese municipalities due to air-quality mandates. Meanwhile, Ford has experienced notable growth in the sales of its E-Transit vans across North America. While payload penalties hinder the adoption of battery-electric vehicles in long-haul heavy trucks, they steer near-term growth toward regional hauls within a limited radius. Vans, benefiting from modular battery packaging that maintains cargo volume, have become essential for parcel carriers. Notably, DHL's Streetscooter fleet has expanded substantially in recent years.
Continued municipal funding sustains bus dominance in emerging markets, yet the shorter four- to six-year replacement cycles in logistics fleets position trucks to overtake buses in annual volumes after 2028. Fleet operators such as UPS, Amazon, and JD Logistics are creating a secondary market for lightweight electric chassis, expanding supplier diversity beyond traditional bus-focused OEMs. Meanwhile, waste-management authorities and utilities adopt specialized electric chassis for stop-and-go duty cycles, further broadening truck demand. As supply chains mature and chassis versatility improves, trucks are set to become the volume engine of the electric commercial vehicle market, particularly in high-utilization parcel and municipal service routes.


By Propulsion: BEV Dominance Challenged by FCEV in Heavy-Duty
Battery electric powertrains captured an 82.36% share in 2025, benefiting from mature supply chains and the rapid decline in cell pricing, giving the electric commercial vehicle market a clear technology incumbent. Fuel-cell electric vehicles nonetheless post a 25.01% CAGR through 2031, targeting heavy-duty use cases where battery mass erodes payload economics. Hyundai’s XCIENT trucks have clocked more than 5 million kilometers with refueling, validating the business case for hydrogen in long-haul applications[3]"XCIENT Fuel Cell Fleet Racks Up 5 Million km, Reinforcing Hyundai’s Hydrogen Leadership," Hyundai Motor Company, hyundai.com. The United States hydrogen hub program earmarks 1,000 fuel-cell trucks for California ports by 2028, signaling public-sector confidence in the pathway. Plug-in hybrids serve range-constrained regions; Volvo’s plug-in FH variant made up a nominal share of its European electric sales in 2024.
Battery-electric traction will remain dominant in urban and regional fleets because depot charging and low energy prices preserve its cost advantage. Fuel-cell adoption depends on achieving cost competitiveness for hydrogen, which is expected as renewable electrolysis scales in the coming years. As regulators enforce stricter zero-emission standards, hybrid and non-plug-in variants are likely to decline. In the shifting propulsion landscape, batteries are expected to dominate urban routes. At the same time, hydrogen is poised to serve heavier, long-distance freight, expanding the market for electric commercial vehicles.
By Power Output: Mid-Range Dominates, High-Power Segment Gains on Highway Freight
The 150-250 kW band held 46.25% of 2025 deliveries, aligning with Class 6-7 trucks used for regional distribution. Greater-than-250 kW drivetrains grow at 15.23% CAGR to 2031, catalyzed by Daimler’s eActros 600 and Tesla’s Semi, both of which eliminate range anxiety on major freight corridors. Less-than-150 kW systems dominate light vans such as Rivian’s EDV, where lower power improves affordability and efficiency.
High-power systems require 800-volt architectures that add 15-20% component cost yet enable one-megawatt charging, a critical feature for class 8 tractors. As megawatt infrastructure spreads across Interstate 5, Interstate 95, and European TEN-T corridors, high-power segments will capture a larger slice of the electric commercial vehicle market. Mid-range power will remain prevalent in municipal and regional fleets, where overnight depot charging is sufficient.
By Battery Capacity: 100-200 kWh Leads, >200 kWh Rises with Range Demands
Packs between 100-200 kWh claimed a 50.12% share in 2025, balancing cost, weight, and overnight-charging compatibility for regional work, reinforcing the central role of this block in the electric commercial vehicle market. Greater-than-200 kWh packs are advancing at 14.62% CAGR by 2031 as operators chase 300-mile ranges; Yutong's E12 bus, equipped with a high-capacity battery pack, completes long-distance journeys without the need for opportunity charging. Meanwhile, smaller battery packs power last-mile vans, which typically have shorter range requirements. This approach not only meets operational needs but also helps reduce vehicle costs. For instance, Ford's E-Transit, with a smaller battery, is more cost-effective than its larger counterpart.
Cell-level gains toward 300 Wh/kg enable higher-capacity batteries without breaching axle limits, nudging long-haul fleets to select packs with capacities of 250-400 kWh. Meanwhile, urban operators may downsize to limit capital outlay, proving that the pack capacity strategy will diverge by duty cycle.
By Range: 150-300 Miles Dominates, more than 300 Miles Expands on Battery Advances
Ranges of 150-300 miles accounted for 48.22% of 2025 shipments, aligning with regional and urban duty cycles and strengthening this sweet spot in the electric commercial vehicle market. More than 300-mile capability, growing at a 20.13% CAGR by 2031, appeals to transcontinental North American routes and European long-distance logistics. Volvo's FH Electric demonstrates impressive range capabilities on a single charge. Similarly, PepsiCo's Tesla Semis, even when fully laden, showcase performance that aligns seamlessly with daily driving requirements.
Less-than-150-mile variants remain vital for dense urban parcels; Amazon’s vans average 120 miles per day with ample buffer for seasonal drain. Range choice will track charging density: sparse coverage in India or Southeast Asia obliges higher-range purchases, whereas Europe’s expanding fast-charger grid supports more miniature packs.
By End-Use Industry: Urban Transit Leads, Logistics Surges on E-commerce
Urban transit accounted for 57.03% in 2025, thanks to centralized bus procurements under air-quality rules, which anchored public spending as the primary driver of the electric commercial vehicle market. Logistics and delivery grow 16.44% CAGR through 2031 as parcel volumes swell and low-emission zones impose a penalty price on diesel. Shenzhen plans to electrify a significant number of municipal buses and trucks by 2025, setting a replicable blueprint for other megacities. Waste management and utilities use stop-start trucks to meet municipal noise and emissions limits; Los Angeles ordered several electric refuse trucks in 2025.
High utilization in parcel delivery speeds payback to under three years, positioning logistics as the fastest-growing end-use. Nevertheless, the transit segment’s long vehicle life and scale keep it the single largest vertical through mid-decade.
By Charging Type: Depot AC Dominates, Opportunity DC Grows with Highway Freight
Depot AC charging owned a 68.24% share in 2025, leveraging off-peak tariffs between USD 0.08-0.12 per kWh and aligning with overnight dwell times, thereby supporting the bulk of the electric commercial vehicle market. En route, DC opportunity charging posts an 18.33% CAGR, which is critical for trucks that travel more than 300 miles per day. New York’s MTA has installed a significant number of depot chargers for e-buses, demonstrating the viability of the depot model for large fleets. Electrify America’s 350 kW network enables trucks to add substantial range in federally mandated 30-minute breaks.
Megawatt standards under CharIN and SAE will reduce recharge time to 15 minutes, tipping the long-haul preference toward opportunity charging. Depot models will stay dominant for urban fleets, while corridor operators migrate to high-power public sites.
Geography Analysis
Asia-Pacific controlled 62.18% of 2025 revenue, underpinned by China’s significant electric share of new urban bus orders and India’s FAME-III subsidy for buses and goods carriers. Japan’s Isuzu and Mitsubishi Fuso delivered several electric trucks focused on Tokyo and Osaka's low-emission zones. South Korea exported XCIENT fuel-cell trucks, sharpening domestic hydrogen expertise. The region benefits from centralized procurement, dense urbanization, and air-quality imperatives that accelerate public bus rollouts.
The Middle East and Africa region is expected to record the fastest growth, with a 14.18% CAGR by 2031. Under Vision 2030, Saudi Arabia's Public Investment Fund has allocated significant resources to establish electric bus and truck plants, aiming for substantial annual production in the coming years. Durban financed several e-buses through the African Development Bank, while Egypt aims to electrify a significant number of Cairo buses by 2028 with EBRD loans. Growth rides on sovereign capital and multilateral facilities in markets that lack domestic OEM depth but possess ambitious decarbonization agendas.
North America and Europe mirror each other in regulatory stringency and infrastructure challenges. California’s Advanced Clean Trucks (ACT) regulation requires manufacturers to sell ZEVs as an increasing share of annual sales starting MY2024, reaching 55% (Class 2b–3), 75% (Class 4–8 straight trucks), and 40% (tractors) by MY2035. Canada set aside CAD 2.75 billion (~USD 2 billion) to electrify 5,000 buses by 2026-27. Europe’s 45% heavy-duty CO₂ cut by 2030 is reinforced by German truck subsidies and expanding low-emission zones in France and the United Kingdom. Both continents face grid connection delays along highway corridors, slowing long-haul penetration, yet policy certainty and purchase incentives keep uptake on track for a rapid climb through 2030.

Competitive Landscape
The market remains moderately concentrated, with BYD, Daimler Truck, Volvo, Traton, and Yutong collectively holding a notable share of 2025 unit sales, leaving room for regional specialists and start-ups to carve out niches. BYD’s vertically integrated model yields a significant operating margin in commercial vehicles, exceeding the sector average, which supports aggressive pricing in export markets. Daimler Truck and Volvo rely on dense service networks that secure brand loyalty among fleets transitioning from diesel, providing a hedge against cost-led challengers. Tesla secured several semi-truck orders from PepsiCo, Walmart, and UPS, despite limited after-sales coverage, demonstrating that performance credentials and fleet trial data can help offset service gaps.
Strategic alliances reshape the field. Daimler and Volvo pooled significant investment to fast-track fuel-cell systems, sharing R&D and infrastructure costs. Traton harmonizes battery modules across Scania and Navistar, cutting per-vehicle costs. Tata Motors, which holds a significant market share in India’s e-bus market, collaborates with local partners in Southeast Asia and Africa to circumvent tariffs and establish service capabilities. Chinese OEMs undercut European prices, triggering EU anti-dumping investigations that may shape competitive rules of engagement.
White-space opportunities remain in 150-300-mile long-haul segments where fuel-cell economics and service coverage are still developing, and in after-sales for emerging markets with severe technician shortages. New entrants focusing on battery-swapping heavy trucks, like India’s Blue Energy Motors, address downtime pain points. At the same time, leasing platforms collaborate with dealers to seed small electric vehicles across Indian metro areas, demonstrating that the ecosystem complements OEM strategies.
Electric Commercial Vehicle Industry Leaders
-
AB Volvo
-
Traton SE
-
BYD Auto Co., Ltd.
-
PACCAR Inc.
-
Daimler Truck AG
- *Disclaimer: Major Players sorted in no particular order

Recent Industry Developments
- December 2025: Following a surge in demand for electric buses, BYD announced plans to build a new factory in Brazil within three years. This will add hundreds of jobs and boost South American exports as regional demand strains current capacity.
- November 2025: Murugappa-owned Montra Electric confirmed a sub-3.5-ton electric truck and an electric LCV up to 7.5 tons for a 2026 launch.
- October 2025: Blue Energy Motors unveiled an electric heavy-duty truck with battery swapping and opened India’s first electric corridor between Mumbai and Pune.
- October 2025: MoEVing partnered with three Tata Motors dealers to lease 700 small electric trucks for last-mile delivery across seven Indian metro areas.


Research Methodology Framework and Report Scope
Market Definitions and Key Coverage
Our study defines the electric commercial vehicle (ECV) market as battery, plug-in hybrid, hybrid, or fuel-cell-powered trucks, buses, vans, and pick-ups that carry goods or paying passengers on public roads and weigh more than 2.5 t.
Scope Exclusions: Off-highway equipment, two or three-wheelers, airport-only shuttles, and retrofitted internal-combustion conversions are excluded.
Segmentation Overview
-
By Vehicle Type
- Bus
- Trucks
- Pick-up Trucks
- Vans
-
By Propulsion
- Battery Electric Vehicles (BEV)
- Hybrid Electric Vehicles (HEV)
- Plug-in Hybrid Electric Vehicles (PHEV)
- Fuel-cell Electric Vehicles (FCEV)
-
By Power Output
- Less than 150 kW
- 150-250 kW
- Greater than 250 kW
-
By Battery Capacity
- Less than 100 kWh
- 100-200 kWh
- Greater than 200 kWh
-
By Range
- Less than 150 miles
- 150-300 miles
- More than 300 miles
-
By End-use Industry
- Urban Transit
- Logistics and Delivery
- Waste Management
- Utilities and Construction
-
By Charging Type
- Depot (AC)
- Opportunity / En-route (DC)
-
By Geography
-
North America
- United States
- Canada
- Rest of North America
-
South America
- Brazil
- Argentina
- Rest of South America
-
Europe
- Germany
- United Kingdom
- France
- Italy
- Spain
- Nordics
- Rest of Europe
-
Asia-Pacific
- China
- India
- Japan
- South Korea
- Rest of Asia-Pacific
-
Middle East and Africa
- United Arab Emirates
- Saudi Arabia
- Turkey
- Egypt
- South Africa
- Rest of Middle East and Africa
-
North America
Detailed Research Methodology and Data Validation
Primary Research
Our analysts spoke with fleet managers, last-mile logistics operators, battery-cell suppliers, transit-agency planners, and charging-network executives across Asia-Pacific, Europe, North America, and the Middle East. These dialogues validated duty-cycle suitability, incentive uptake, and expected total-cost-of-ownership parity, allowing us to fine-tune discount factors and penetration curves.
Desk Research
We began with authoritative public datasets from the International Energy Agency, OICA production statistics, Eurostat road-freight tables, the US EPA SmartWay program, and national vehicle sales registries, which anchor fleet, production, and battery-cost trends. Company filings, investor presentations, regulatory dockets, and reputable press articles supplied pricing and policy context. Paid assets such as D&B Hoovers (fleet financials) and MarkLines (model-level registrations) helped sharpen unit-mix and average-selling-price inputs. The sources cited are illustrative; many additional references were consulted for data gathering and cross-checks.
Market-Sizing & Forecasting
A top-down reconstruction of new commercial-vehicle production and in-service parc by weight class was overlaid with electrification rates derived from mandate timelines and purchase incentives, which are then checked against sampled OEM shipment roll-ups. Key variables include battery pack $/kWh, last-mile parcel volumes, public DC fast-charger installs, zero-emission credit values, and diesel-electric TCO spreads. Forecasts use multivariate regression on those drivers, while scenario analysis stress-tests battery-price and policy shifts. Bottom-up approximations of regional sales multiplied by sampled ASPs plug data gaps and temper headline totals.
Data Validation & Update Cycle
Outputs pass dual-layer analyst review; anomalies over five percent trigger re-contact with respondents and model revision. Reports refresh annually, with interim updates for material regulation or cost shocks, and a final pass just before client delivery.
Why Mordor's Electric Commercial Vehicle Baseline Commands Reliability
Published 2025 estimates diverge widely, ranging from USD 80.69 billion to USD 204.46 billion, largely because firms differ on light-van inclusion, currency conversion points, and ASP uplift methods.
Benchmark comparison
| Market Size | Anonymized source | Primary gap driver |
|---|---|---|
| USD 88.30 B | Mordor Intelligence | - |
| USD 101.46 B | Global Consultancy A | Counts OEM revenue only; omits incentive adjustments |
| USD 80.69 B | Global Consultancy B | Includes sub-2.5 t vans that we exclude |
| USD 204.46 B | Industry Association C | Applies aggressive ASP inflation and folds in charging hardware |
The comparison shows that by sticking to disciplined segment definitions, keeping a tight refresh cadence, and tracking transparent, reproducible variables, Mordor Intelligence provides a balanced, decision-ready baseline that executives can audit with confidence.


Key Questions Answered in the Report
How large is the electric commercial vehicle market in 2026?
The electric commercial vehicle market size is USD 88.30 billion in 2026 and is forecast to grow to USD 166.30 billion by 2031 at a 13.50% CAGR.
Which regional market leads global adoption?
Asia-Pacific accounts for 62.18% of 2025 global revenue thanks to China’s near-universal electrification of urban bus fleets and India’s new subsidies.
What vehicle type represents the biggest share today?
Buses hold 54.12% share in 2025 because municipal transit agencies bulk-purchase electric fleets under clean-air mandates.
Which propulsion technology is growing fastest?
Fuel-cell electric trucks post a 25.01% CAGR through 2031 as hydrogen hubs and weight-sensitive long-haul routes gain support.
Page last updated on:


