Market Overview
| Study Period | 2019 - 2031 |
|---|---|
| Forecast Data Period | 2026 - 2031 |
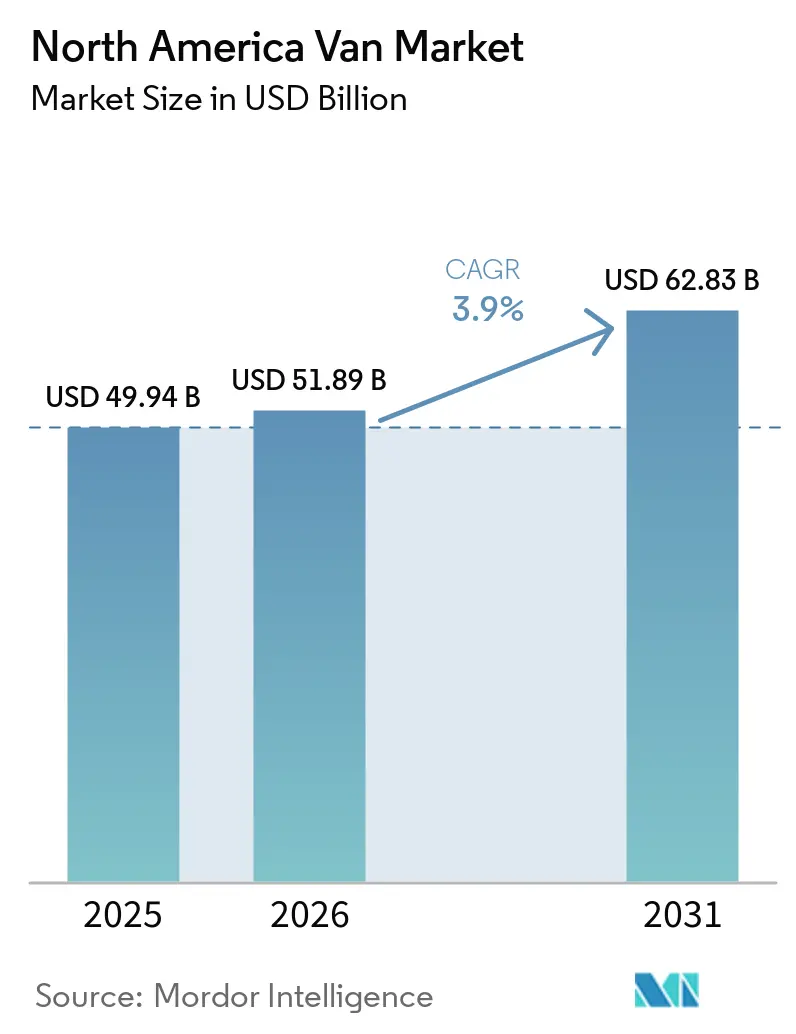
| Base Year Market Size (2025) | USD 49.94 Billion |
| Market Size (2026) | USD 51.89 Billion |
| Market Size (2031) | USD 62.83 Billion |
| Growth Rate (2026 - 2031) | 3.90% CAGR |
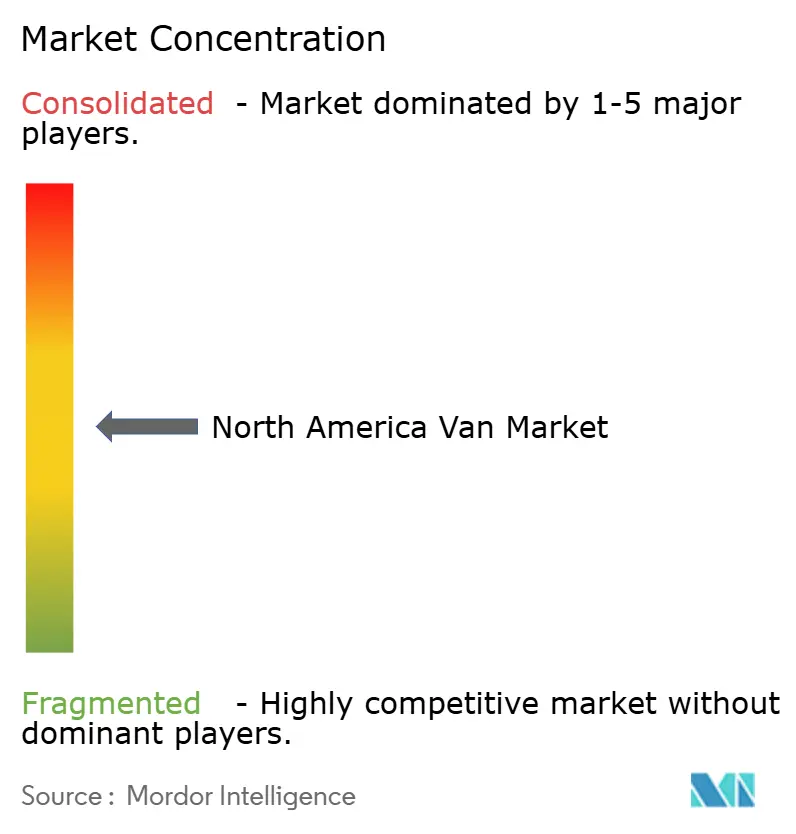
| Market Concentration | Medium |
Major Players *Disclaimer: Major Players sorted in no particular order Image © Mordor Intelligence. Reuse requires attribution under CC BY 4.0. | |
North America Van Market Analysis by Mordor Intelligence
The North American van market was valued at USD 49.94 billion in 2025 and estimated to grow from USD 51.89 billion in 2026 to reach USD 62.83 billion by 2031, at a CAGR of 3.90% during the forecast period (2026-2031). Electric and hybrid vans are rapidly gaining traction, driven by zero-emission purchase mandates, declining battery costs, and incentives that significantly reduce vehicle prices. While delivery fleets lead the charge in electrification, a burgeoning recreational customer base is subtly boosting retail demand. Skateboard chassis designs are not only reducing tooling expenses but also allowing established players to keep pace with startups through multibody derivatives. Although rising interest rates and fluctuating nickel prices pose challenges to margins, OEMs are bolstering profitability through forward hedging and long-term supply contracts.
Key Report Takeaways
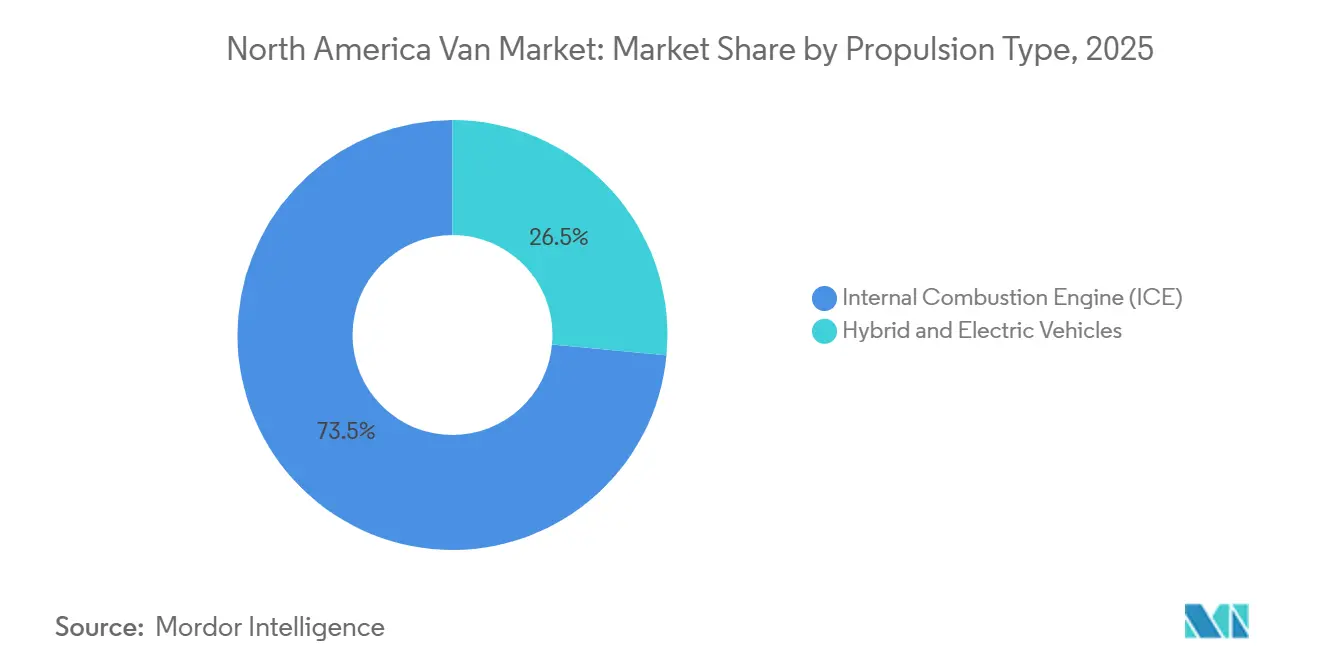
- By propulsion type, internal-combustion vans commanded 73.45% of the North America van market share in 2025, but hybrid and electric models are projected to post an 8.25% CAGR through 2031.
- By vehicle type, cargo vans led with 64.01% revenue share in 2025; specialty vans are forecast to expand at a 6.24% CAGR to 2031.
- By end user, last-mile delivery and parcel accounted for 49.33% share of the North America van market size in 2025, while the recreational and van-life segment is advancing at a 5.36% CAGR through 2031.
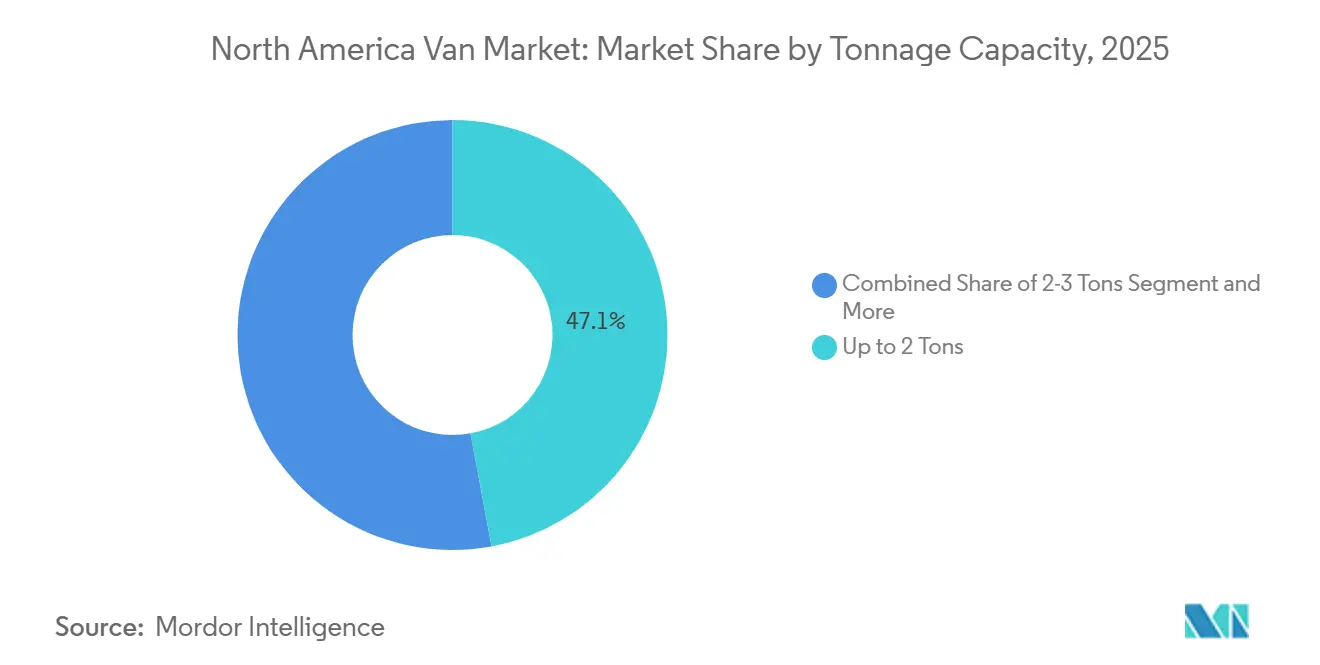
- By tonnage capacity, vans up to 2 tons dominated with 47.12% share in 2025, while the units above 5.5 tons are on track for a 7.05% CAGR through 2031.
- By battery range, the up to 100 miles category accounted for 53.27% share in 2025, while vans with above 200 miles range is set to advance at a 5.83% CAGR by 2031.
- By country, the United States held 83.11% of 2025 sales; Mexico records the strongest forward CAGR at 6.85% to 2031.
Note: Market size and forecast figures in this report are generated using Mordor Intelligence’s proprietary estimation framework, updated with the latest available data and insights as of 2026.
North America Van Market Trends and Insights
Drivers Impact Analysis*
| Driver | (~) % Impact on CAGR Forecast | Geographic Relevance | Impact Timeline |
|---|---|---|---|
| E-Commerce Fuels Last-Mile Surge | +1.2% | United States, Canada, urban Mexico | Short term (≤ 2 years) |
| IRA Drives EV Investment | +0.9% | United States with spillover to Canada and Mexico | Medium term (2-4 years) |
| Battery Costs Under USD 100/kWh | +0.7% | North America supply chain | Medium term (2-4 years) |
| State Mandates Drive ZEV Adoption | +0.8% | CA, NY, WA, OR, CO; federal Canada | Long term (≥ 4 years) |
| Skateboard Platforms Slash CAPEX | +0.5% | United States, Canada | Medium term (2-4 years) |
| Smart-Depot V2G Revenue | +0.3% | Pilot zones in CA and TX | Long term (≥ 4 years) |
| Source: Mordor Intelligence | |||


Parcel E-commerce Boom and Last-Mile Surge
In 2024, the United States experienced significant growth in e-commerce parcel shipments. This increase has tightened delivery windows, prompting operators to utilize smaller vans adept at navigating residential streets while maximizing payload capacity. Amazon’s pledge to field 100,000 Rivian vans by 2030 created a blueprint for electrified capacity reservations. FedEx and UPS have echoed this sentiment with their own multi-year orders, yet the challenge of grid-ready depots persists. According to the National Renewable Energy Laboratory, electrifying a portion of urban delivery vans would require a considerable increase in charging load, comparable to the output of multiple utility-scale plants. In response to demand-charge risks, fleets are strategically co-locating solar and storage solutions. This transformation of depots into microgrids not only reduces peak tariffs but also unlocks potential revenue from ancillary services.
IRA-Backed Domestic EV and Battery Investments
The Inflation Reduction Act provides up to USD 40,000 per qualifying heavy-duty commercial vehicle, so long as final assembly and key battery content are North America-based [1]“Commercial Clean Vehicle Credit Statistics 2024,” U.S. Department of the Treasury, treasury.gov. In the inaugural year following the enactment, a significant majority of eligible units capitalized on the full credit, underscoring its importance in the total-cost-of-ownership equation. This incentive surge catalyzed numerous battery-related announcements, notably featuring LG-Honda's joint venture in Ohio and Panasonic's expansion in Kansas. By shortening logistics routes and sourcing cells locally, domestic OEMs have reduced the order-to-delivery timeline, gaining a competitive speed advantage as compliance benchmarks escalate through the coming years.
Sub-USD 100 kWh Battery Packs by 2027
In recent times, pack prices have declined significantly and are expected to reach a critical threshold in the near future. This development effectively eliminates the initial cost disparity with diesel, particularly when federal credits are factored in. Lithium-iron-phosphate (LFP) chemistry has gained substantial traction in commercial applications due to its cost-effectiveness and superior cycle life. However, its lower energy density has maintained the need for a dual-chemistry fleet. As a result, operators managing LFP cargo vans alongside NMC specialty rigs must address the complexities of differing service protocols, which adds to training challenges despite decreasing acquisition costs.
State-Level ZEV and Fleet Mandates
California’s Advanced Clean Fleets rule locked in a 50% zero-emission purchase requirement for large public and private fleets beginning in 2024, ramping to 100% by 2027[2]“Advanced Clean Fleets Regulation,” California Air Resources Board, carb.ca.gov. In New York and several other states, the adoption of Section 177 imposes similar restrictions on a significant portion of the nation's van demand. Meanwhile, Canada has set ambitious targets for medium- and heavy-duty vehicle sales to transition to zero-emission models within a defined timeline. These mandates come ahead of standard vehicle replacement cycles, hastening the retirement of diesel vehicles and leading to immediate capital expenditure increases, all while promising long-term total cost of ownership savings.
Restraints Impact Analysis*
| Restraint | (~) % Impact on CAGR Forecast | Geographic Relevance | Impact Timeline |
|---|---|---|---|
| Fast-Charger Demand-Charge | −0.6% | United States, Canada | Short term (≤ 2 years) |
| Up-Front BEV Van Price | −0.5% | North America | Medium term (2-4 years) |
| E-Powertrain Service-Tech Shortage | −0.4% | North America non-metro | Long term (≥ 4 years) |
| Battery Weight Push | −0.3% | United States, Canada CDL states | Medium term (2-4 years) |
| Source: Mordor Intelligence | |||
Fast-Charger Demand-Charge Spikes
During peak months, commercial tariffs often impose significant demand fees. A depot with multiple vans utilizing high-capacity chargers could face substantial monthly demand charges. This erodes fuel savings and extends the electric vehicle (EV) payback period beyond the typical replacement timeframe. Managed-charging program enrollment remains inconsistent, with only a small portion of eligible commercial clients participating. This has forced fleets to invest in costly on-site batteries as load buffers. Meanwhile, legislative remedies like California's AB 2061 remain stalled, leaving operators to navigate tariff complexities independently.
Up-Front BEV Van Price Premium
In 2025, electric cargo vans continued to carry a significant premium, even with incentives. Ford's E-Transit was priced notably higher than its diesel counterpart. While subscription bundles from Ford Pro and GM Envolve shift capital expenditures to operational ones, long-term commitments and mileage restrictions pose challenges for high-utilization fleets. Additionally, smaller operators, constrained by limited credit, frequently postpone purchases, waiting for price reductions or more mature financing options, which in turn hampers widespread adoption.
*Our forecasts treat driver/restraint impacts as directional, not additive. The impact forecasts reflect baseline growth, mix effects, and variable interactions.
Segment Analysis
By Propulsion Type: Electrification Accelerates Despite ICE Dominance
Internal-combustion drivetrains retained 73.45% of 2025 volumes, but electric and hybrid formats are pacing the North America van market at an 8.25% CAGR, double headline growth. Battery-electric vans dominate the electrified delivery segment, with improving range-per-dollar metrics driving a preference for BEVs over plug-in hybrids. The North American market for BEV vans is expected to grow significantly, supported by the current incentive framework. Although fuel-cell pilot fleets remain small in scale, they show promise for long-range applications, particularly as green hydrogen costs decrease in line with national initiatives.
Internal combustion engines are shifting toward gasoline and CNG options in lighter vehicle classes, while diesel continues to be favored in heavier categories due to its torque and refueling speed advantages. However, advancements in energy density are reducing diesel's payload superiority. This development indicates a potential turning point in the market as solid-state chemistries begin to see limited commercial adoption.


By Vehicle Type: Specialty Vans Gain as Cold-Chain Electrifies
Cargo configurations occupied 64.01% of deliveries in 2025, mirroring last-mile dominance. Specialty vans—refrigerated, camper, and ambulance builds—are, however, posting the quickest uptake at a 6.24% CAGR to 2031. Electric transport-refrigeration units from Carrier and Thermo King draw propulsion energy or tap auxiliary packs, slicing payload yet helping shippers meet anti-idling rules in California and New York [3]“Electric TRU Portfolio Overview,” Carrier Global, carrier.com . Camper conversions are now a fully factory option on Mercedes-Benz’s eSprinter, reflecting the lifestyle segment’s willingness to pay premiums for silent off-grid operation.
Yet, specialty electrification faces unresolved weight-range trade-offs. Ambulance upfitters must certify high-voltage medical systems in the absence of a dedicated NFPA standard, lengthening approval cycles and tempering volume. OEMs that invest early in application-specific integrations stand to capture above-average margins in these regulated, high-value niches.
By End User: Recreational Segment Surprises With Fastest Growth
Parcel and last-mile chains controlled 49.33% of 2025 demand and remain core to the North America van market. Recreational-van purchases, however, are charting the fastest 5.36% CAGR through 2031, fueled by remote-work flexibility and social-media-driven “van-life” appeal. The segment’s appetite for factory-installed solar, lithium-house batteries, and integrated HVAC is encouraging OEMs to treat retail buyers as a strategic counterweight to fleet cyclicality. Municipal fleets, pressured by ZEV mandates, are accelerating replacement schedules, consolidating orders in the 2026-2029 window while federal credits remain most lucrative.
Corporate shuttle operators adopt electric vans more cautiously, citing range constraints on multilocation routes. Yet their centralized depots and predictable schedules align neatly with managed-charging models, making them likely fast followers once battery costs breach the USD 100/kWh threshold.
By Tonnage Capacity: Heavy-Duty Segment Unlocked by Battery Density Gains
Vans under 2 tons captured 47.12% of 2025 volume, but the above-5.5-ton cohort is slated for a 7.05% CAGR, the strongest across classes. This growth is driven by advancements in battery technology, such as the integration of high-energy-density cells, which significantly reduce the overall weight of battery packs. These innovations are likely to enhance the appeal of heavy-duty vans, positioning them as a key segment in the market. The introduction of new models with improved range and performance is expected to further strengthen this trend, making heavy-duty vans a more viable option for various applications.
However, regulatory requirements, such as the need for commercial driver’s licenses for vehicles above a certain weight, could pose challenges for fleet operators. These restrictions may limit the availability of qualified drivers, creating potential hurdles for the adoption of heavier vans. As a result, fleet managers will need to carefully evaluate the trade-offs between operational cost savings and the complexities of staffing. Despite these challenges, the advancements in technology and the growing demand for efficient transportation solutions are likely to drive the adoption of heavy-duty vans in the long term.
By Battery Range: Depot Economics Favor Shorter Configurations
Vans with a range of up to 100 miles were the most prominent, with 53.27% of sales during 2025, as they are specifically designed for fixed-route operations and overnight charging needs. On the other hand, the segment designed for longer distances, particularly over 200 miles, is expected to witness growth at 5.83% CAGR. This trend is largely driven by operators who prioritize addressing challenges such as winter range reductions and unexpected detours.
Although fast charging provides some relief for smaller battery packs, a significant gap between real-world range performance and EPA ratings has encouraged many fleets to invest in larger battery capacities. In the coming years, the market for extended-range vans in North America is projected to grow substantially, supported by advancements in battery technology, decreasing cell costs, and the continuous expansion of charging infrastructure.
Geography Analysis
The United States commanded an 83.11% slice of North American van sales in 2025, underpinned by e-commerce scale, the Inflation Reduction Act’s USD 40,000 credit, and state-level fleet mandates that front-load electrified purchases. California emerged as a significant hub for electric van registrations, driven by the Advanced Clean Fleets regulations. Additionally, new domestic battery plants in states like Ohio, Kansas, and Tennessee are expected to enhance production capacity in the coming years. This development will streamline lead times and strengthen supply chains by reducing reliance on trans-Pacific freight.
Canada posted lower unit totals but maintains momentum through a federal requirement that 100% of medium- and heavy-duty sales turn zero-emission by 2040, with a 35% waypoint in 2030 [4]“Zero-Emission Medium- and Heavy-Duty Vehicle Targets,” Transport Canada, canada.ca. In British Columbia and Quebec, provincial incentives significantly reduce upfront costs. However, operators face a challenge: winter-range degradation forces them to either specify larger packs or accept seasonal route limitations. Meanwhile, in the Prairie provinces, despite the availability of subsidies, a lack of infrastructure density outside major metropolitan areas acts as a barrier, hindering faster adoption.
Mexico is forecast to register the fastest 6.85% CAGR to 2031 as CRE Regulation A/108/2024 lays a national charging-connection standard and as OEMs leverage low-cost assembly under USMCA content rules. While public chargers are concentrated in key cities such as Mexico City, Guadalajara, and Monterrey, incentives like accelerated depreciation and import-duty exemptions are driving electrification efforts among parcel carriers. Additionally, there's growing interest in extended-range and hydrogen prototypes, especially along cross-border corridors where delays can lead to costly customs-queue penalties.
Competitive Landscape
The North American van market remains unconcentrated; the top five OEMs combined a notable share of 2025 deliveries, leaving ample room for disruptors. Ford topped the electric segment via its E-Transit lineup, buttressed by the Pro charging and telematics suite that slashes onboarding friction. GM’s BrightDrop Zevo suffered a production halt in 2025 after order pushbacks, highlighting scale-up fragility even with deep pockets. Rivian relies on Amazon’s exclusive contract for volume, but forfeits broader fleet exposure that would accelerate cost curves. Mercedes-Benz and Stellantis both target premium niches where European engineering commands higher transaction prices, buffering them against commodity swings.
Technology differentiation is sharpening. Ford Pro Intelligence uses real-time telematics and predictive analytics to stretch battery life and optimize charging windows, demonstrated to trim fleet TCO in trial runs. GM’s Ultifi operating system opened APIs for third-party app layers in 2024, inviting software ecosystems that deepen customer lock-in. Patent analysis points to escalating R&D on thermal management, skateboard modularity, and integrated bidirectional inverters. Compliance with ISO 15118-20 and SAE J1772 is now baseline, with fleets insisting on charger-vehicle interoperability to hedge multi-brand deployments.
White-space persists in refrigerated and service-tool upfits where uptime and payload trump range obsession. Workhorse and Canoo market modular architectures that allow rapid body swaps, but both remain capital constrained and trail in after-sales footprints. Incumbents therefore still enjoy trust moats around parts, service, and financing, though the software-as-a-service layer is beginning to erode those traditional walls.
North America Van Industry Leaders
Ford Motor Company
General Motors Company
Stellantis N.V.
Mercedes-Benz Group AG
Nissan Motor Co., Ltd.
- *Disclaimer: Major Players sorted in no particular order

Recent Industry Developments
- January 2026: Kia unveiled the PV5 electric commercial van and revealed its plans to showcase it at the EV & Charging Expo in Toronto, signaling its first entry into North American light-duty vans.
- October 2025: DHL Express added 45 Mercedes-Benz eSprinter vans to the routes across United States, marking the first North American leg of its 10,000-unit global deployment.
- October 2025: General Motors permanently ceased production of the BrightDrop Zevo at the CAMI plant as fleet demand slowed, redirecting resources to battery module production.
- October 2025: Amazon placed 50 Rivian electric delivery vans into service around Greater Vancouver, Canada, accelerating its cross-border decarbonization roadmap.


North America Van Market Report Scope
The scope includes segmentation by propulsion type (hybrid and electric vehicles (battery electric vehicle, plug-in hybrid electric vehicle, hybrid electric vehicle, and fuel-cell electric vehicle), and internal combustion engine (diesel, gasoline, and CNG and others)), vehicle type (cargo van, passenger van, and specialty van), end-user (last-mile delivery and parcel, field services and utilities, rental and leasing fleets, recreational and van-life, government and municipal fleets, and corporate passenger transport), tonnage capacity (up to 2 tons, 2-3 tons, 3-5.5 tons, and above 5.5 tons), and battery range (up to 100 miles, 100-200 miles, and above 200 miles). The analysis also covers country-level analysis including, United States, Canada, and Mexico. Market size and growth forecasts are presented in terms of value in USD and volume in units.
By Propulsion Type
| Hybrid and Electric Vehicles | Battery Electric Vehicle (BEV) |
| Plug-in Hybrid Electric Vehicle (PHEV) | |
| Hybrid Electric Vehicle (HEV) | |
| Fuel-Cell Electric Vehicle (FCEV) | |
| Internal Combustion Engine (ICE) | Diesel |
| Gasoline | |
| CNG and Others |
By Vehicle Type
| Cargo Van |
| Passenger Van |
| Specialty Van (Refrigerated, Camper, Ambulance) |
By End-User
| Last-Mile Delivery and Parcel |
| Field Services and Utilities |
| Rental and Leasing Fleets |
| Recreational and Van-Life |
| Government and Municipal Fleets |
| Corporate Passenger Transport |
By Tonnage Capacity
| Up to 2 Tons |
| 2-3 Tons |
| 3- 5.5 Tons |
| Above 5.5 Tons |
By Battery Range
| Up to 100 miles |
| 100-200 miles |
| Above 200 miles |
By Country
| United States |
| Canada |
| Mexico |
| By Propulsion Type | Hybrid and Electric Vehicles | Battery Electric Vehicle (BEV) |
| Plug-in Hybrid Electric Vehicle (PHEV) | ||
| Hybrid Electric Vehicle (HEV) | ||
| Fuel-Cell Electric Vehicle (FCEV) | ||
| Internal Combustion Engine (ICE) | Diesel | |
| Gasoline | ||
| CNG and Others | ||
| By Vehicle Type | Cargo Van | |
| Passenger Van | ||
| Specialty Van (Refrigerated, Camper, Ambulance) | ||
| By End-User | Last-Mile Delivery and Parcel | |
| Field Services and Utilities | ||
| Rental and Leasing Fleets | ||
| Recreational and Van-Life | ||
| Government and Municipal Fleets | ||
| Corporate Passenger Transport | ||
| By Tonnage Capacity | Up to 2 Tons | |
| 2-3 Tons | ||
| 3- 5.5 Tons | ||
| Above 5.5 Tons | ||
| By Battery Range | Up to 100 miles | |
| 100-200 miles | ||
| Above 200 miles | ||
| By Country | United States | |
| Canada | ||
| Mexico | ||


Market Definition
- Vehicle Type - The category includes Light Commercial Vehicle.
- Vehicle Body Type - This include Light Commercial Vans category.
- Fuel Category - The category includes various fuel types such as Gasoline, Diesel, LPG (Liquefied Petroleum Gas), CNG (Compressed Natural Gas), HEV (Hybrid Electric Vehicles), PHEV (Plug-in Hybrid Electric Vehicles), BEV (Battery Electric Vehicles), and FCEV (Fuel Cell Electric Vehicles)
| Keyword | Definition |
|---|---|
| Electric Vehicle (EV) | A vehicle which uses one or more electric motors for propulsion. Includes cars, buses, and trucks. This term includes all-electric vehicles or battery electric vehicles and plug-in hybrid electric vehicles. |
| BEV | A BEV relies completely on a battery and a motor for propulsion. The battery in the vehicle must be charged by plugging it into an outlet or public charging station. BEVs do not have an ICE and hence are pollution-free. They have a low cost of operation and reduced engine noise as compared to conventional fuel engines. However, they have a shorter range and higher prices than their equivalent gasoline models. |
| PEV | A plug-in electric vehicle is an electric vehicle that can be externally charged and generally includes all-electric vehicles as well as plug-in hybrids. |
| Plug-in Hybrid EV | A vehicle that can be powered either by an ICE or an electric motor. In contrast to normal hybrid EVs, they can be charged externally. |
| Internal combustion engine | An engine in which the burning of fuels occurs in a confined space called a combustion chamber. Usually run with gasoline/petrol or diesel. |
| Hybrid EV | A vehicle powered by an ICE in combination with one or more electric motors that use energy stored in batteries. These are continually recharged with power from the ICE and regenerative braking. |
| Commercial Vehicles | Commercial vehicles are motorized road vehicles designed for transporting people or goods. The category includes light commercial vehicles (LCVs) and medium and heavy-duty vehicles (M&HCV). |
| Passenger Vehicles | Passenger cars are electric motor– or engine-driven vehicles with at least four wheels. These vehicles are used for the transport of passengers and comprise no more than eight seats in addition to the driver’s seat. |
| Light Commercial Vehicles | Commercial vehicles that weigh less than 6,000 lb (Class 1) and in the range of 6,001–10,000 lb (Class 2) are covered under this category. |
| M&HDT | Commercial vehicles that weigh in the range of 10,001–14,000 lb (Class 3), 14,001–16,000 lb (Class 4), 16,001–19,500 lb (Class 5), 19,501–26,000 lb (Class 6), 26,001–33,000 lb (Class 7) and above 33,001 lb (Class 8) are covered under this category. |
| Bus | A mode of transportation that typically refers to a large vehicle designed to carry passengers over long distances. This includes transit bus, school bus, shuttle bus, and trolleybuses. |
| Diesel | It includes vehicles that use diesel as their primary fuel. A diesel engine vehicle have a compression-ignited injection system rather than the spark-ignited system used by most gasoline vehicles. In such vehicles, fuel is injected into the combustion chamber and ignited by the high temperature achieved when gas is greatly compressed. |
| Gasoline | It includes vehicles that use gas/petrol as their primary fuel. A gasoline car typically uses a spark-ignited internal combustion engine. In such vehicles, fuel is injected into either the intake manifold or the combustion chamber, where it is combined with air, and the air/fuel mixture is ignited by the spark from a spark plug. |
| LPG | It includes vehicles that use LPG as their primary fuel. Both dedicated and bi-fuel LPG vehicles are considered under the scope of the study. |
| CNG | It includes vehicles that use CNG as their primary fuel. These are vehicles that operate like gasoline-powered vehicles with spark-ignited internal combustion engines. |
| HEV | All the electric vehicles that use batteries and an internal combustion engine (ICE) as their primary source for propulsion are considered under this category. HEVs generally use a diesel-electric powertrain and are also known as hybrid diesel-electric vehicles. An HEV converts the vehicle momentum (kinetic energy) into electricity that recharges the battery when the vehicle slows down or stops. The battery of HEV cannot be charged using plug-in devices. |
| PHEV | PHEVs are powered by a battery as well as an ICE. The battery can be charged through either regenerative breaking using the ICE or by plugging into some external charging source. PHEVs have a better range than BEVs but are comparatively less eco-friendly. |
| Hatchback | These are compact-sized cars with a hatch-type door provided at the rear end. |
| Sedan | These are usually two- or four-door passenger cars, with a separate area provided at the rear end for luggage. |
| SUV | Popularly known as SUVs, these cars come with four-wheel drive, and usually have high ground clearance. These cars can also be used as off-road vehicles. |
| MPV | These are multi-purpose vehicles (also called minivans) designed to carry a larger number of passengers. They carry between five and seven people and have room for luggage too. They are usually taller than the average family saloon car, to provide greater headroom and ease of access, and they are usually front-wheel drive. |


Research Methodology
Mordor Intelligence follows a four-step methodology in all its reports.
- Step-1: Identify Key Variables: To build a robust forecasting methodology, the variables and factors identified in Step-1 are tested against available historical market numbers. Through an iterative process, the variables required for market forecast are set and the model is built based on these variables.
- Step-2: Build a Market Model: Market-size estimations for the historical and forecast years have been provided in revenue and volume terms. Market revenue is calculated by multiplying the sales volume with their respective average selling price (ASP). While estimating ASP factors like average inflation, market demand shift, manufacturing cost, technological advancement, and varying consumer preference, among others have been taken into account.
- Step-3: Validate and Finalize: In this important step, all market numbers, variables, and analyst calls are validated through an extensive network of primary research experts from the market studied. The respondents are selected across levels and functions to generate a holistic picture of the market studied.
- Step-4: Research Outputs: Syndicated Reports, Custom Consulting Assignments, Databases & Subscription Platforms.


