Market Overview
| Study Period | 2019 - 2031 |
|---|---|
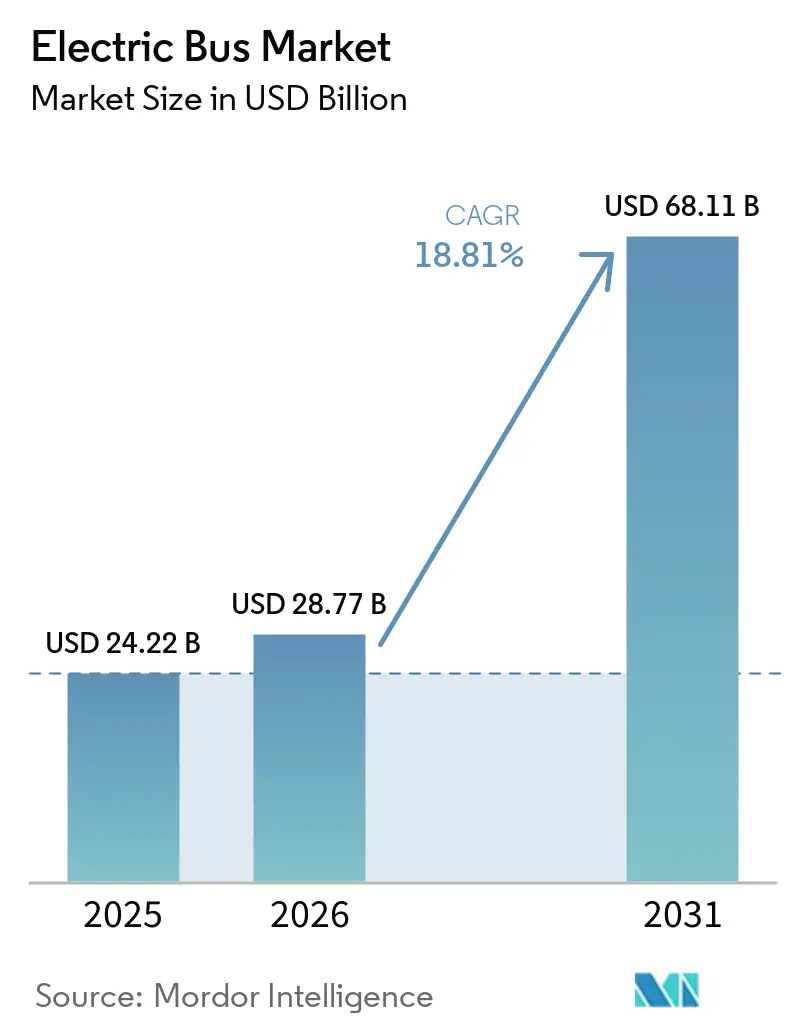
| Market Size (2026) | USD 28.77 Billion |
| Market Size (2031) | USD 68.11 Billion |
| Growth Rate (2026 - 2031) | 18.81% CAGR |
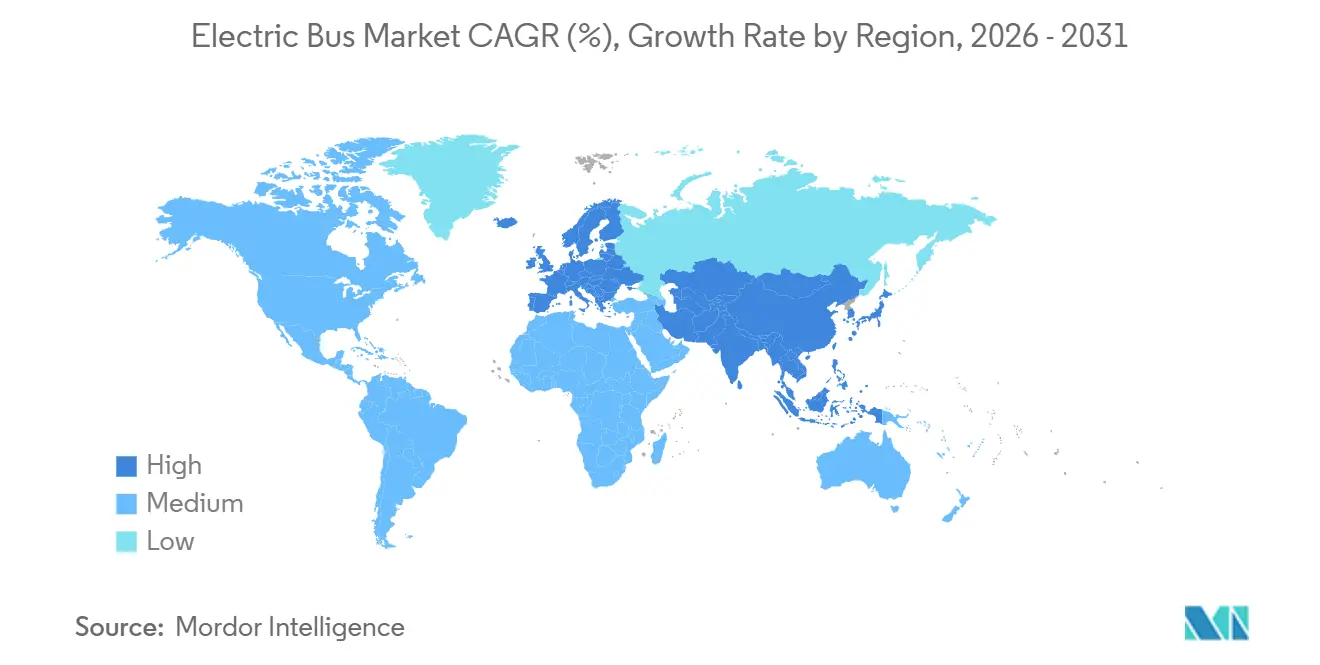
| Fastest Growing Market | Europe |
| Largest Market | Asia Pacific |
| Market Concentration | Medium |
Major Players *Disclaimer: Major Players sorted in no particular order Image © Mordor Intelligence. Reuse requires attribution under CC BY 4.0. | |
Electric Bus Market Analysis by Mordor Intelligence
The electric bus market size is expected to grow from USD 24.22 billion in 2025 to USD 28.77 billion in 2026 and is forecast to reach USD 68.11 billion by 2031 at an 18.81% CAGR over 2026–2031. Rising diesel retirement mandates, declining battery prices, and growing recognition of total cost-of-ownership advantages are expected to anchor near-term demand. Transit agencies are compressing replacement cycles to meet zero-emission targets, while port authorities and intercity operators are diversifying into hydrogen to bypass range limitations. Supply-chain disruptions linked to China’s critical minerals policies accelerate the adoption of lithium-iron-phosphate (LFP), and grid-upgrade delays at depots force operators to rethink their fleet-deployment timelines. Competitive pressure intensifies as vertically integrated Chinese OEMs undercut rivals, pushing incumbents toward modular, platform-based architectures that share powertrains across vehicle classes. Meanwhile, route-as-a-service contracts emerge as a financing workaround, shifting capital risk to manufacturers and infrastructure partners.
Key Report Takeaways
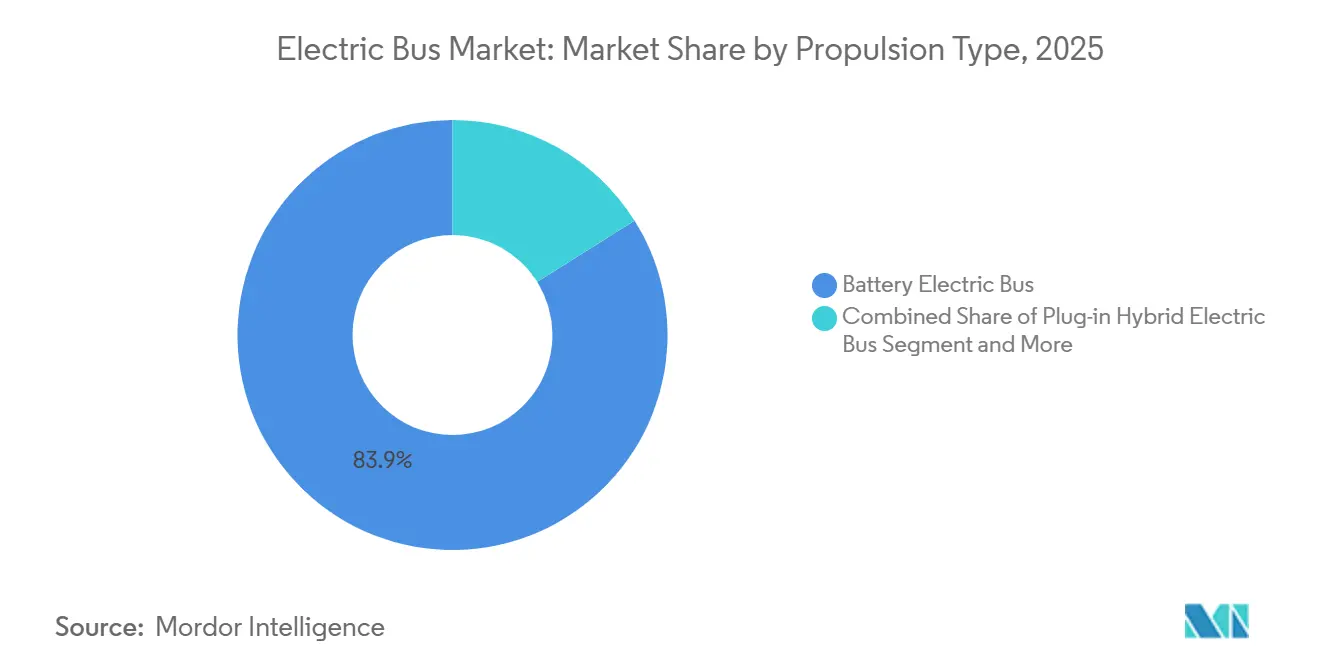
- By propulsion, battery-electric buses led the electric bus market with an 83.92% share in 2025, while fuel-cell variants are forecasted to grow at a 20.82% CAGR through 2031.
- By application, city and transit fleets commanded a 62.37% share in 2025; intercity routes are expanding at a 19.18% CAGR due to the rising 300-450 km range capability.
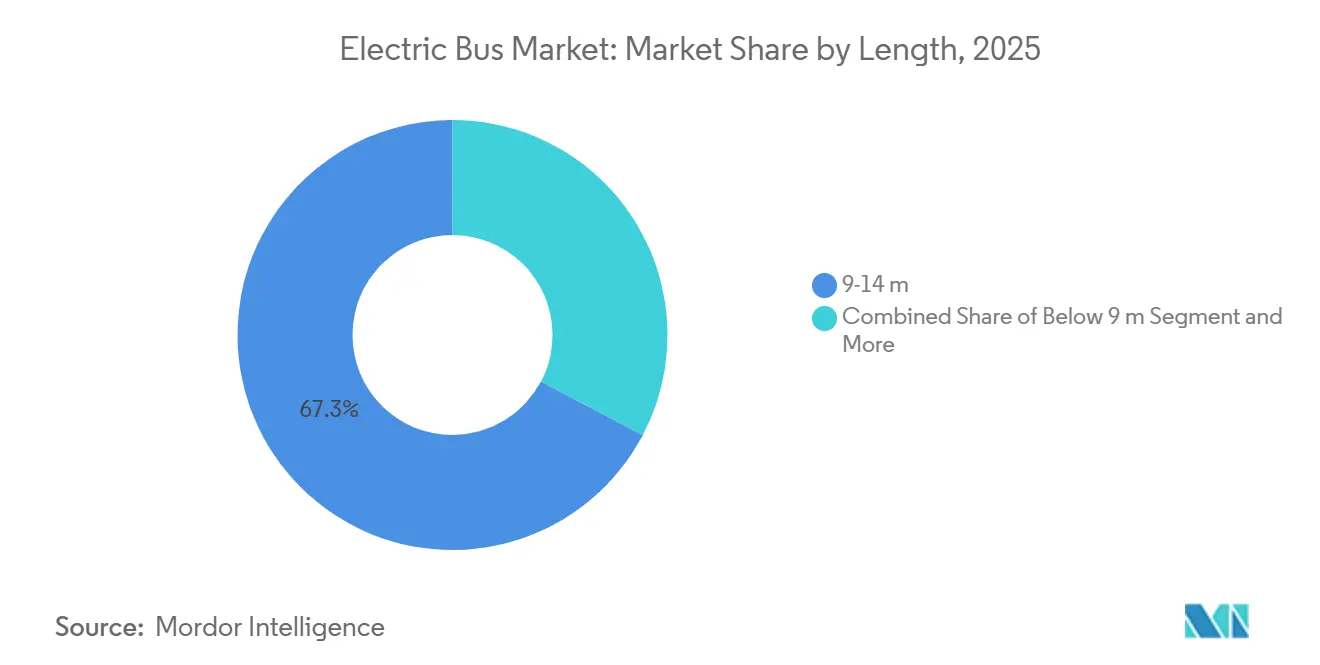
- By length, 9–14 meter models captured 67.29% of 2025 deployments in the electric bus market; 14–18 meter articulated units are set to advance at a 19.06% CAGR.
- By battery chemistry, LFP packs held 59.63% share in 2025, whereas NMC/NCA chemistries are poised for a 20.28% CAGR as energy density improves.
- By motor architecture, permanent-magnet synchronous motors dominated with a 64.31% share in 2025, while switched-reluctance alternatives are expected to post a 21.09% CAGR.
- By motor power, the 151–200 kW band accounted for 49.72% of installations in 2025; the 251–320 kW segment is projected to grow at a 20.31% CAGR.
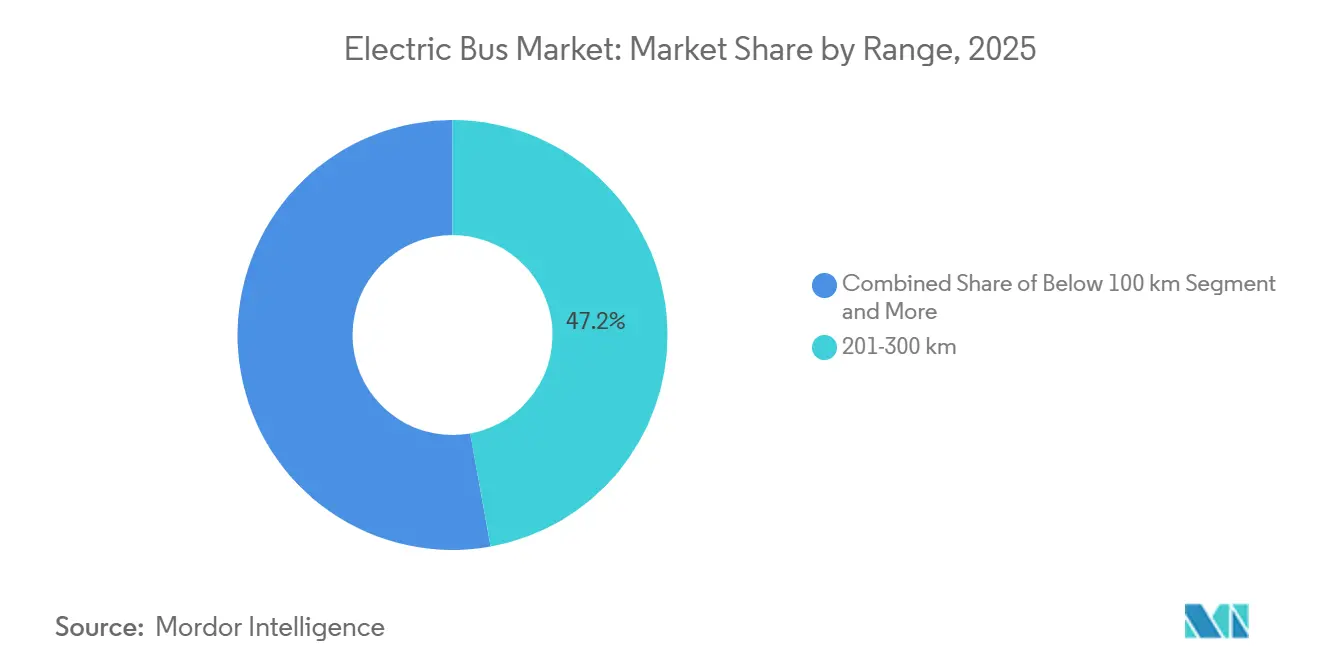
- By range, buses with a 201–300 km range held a 47.17% share in 2025, while the above-450 km category is expected to accelerate at a 20.16% CAGR.
- By end use, public fleets held 81.18% of 2025 procurement in the electric bus market, and private operators are anticipated to grow at a 19.44% CAGR as corporate shuttles electrify.
- By geography, Asia-Pacific led with 64.82% volume in 2025; Europe is on track for a 19.88% CAGR, supported by the Clean Vehicles Directive.
Note: Market size and forecast figures in this report are generated using Mordor Intelligence’s proprietary estimation framework, updated with the latest available data and insights as of January 2026.
Global Electric Bus Market Trends and Insights
Drivers Impact Analysis*
| Driver | (~) % Impact on CAGR Forecast | Geographic Relevance | Impact Timeline |
|---|---|---|---|
| Battery-Price Decline Below USD 85/kWh | +4.1% | Global | Medium term (2–4 years) |
| Mainstream EV Mandates in Megacities | +3.2% | Global, high in EU, China, California | Short term (≤ 2 years) |
| Global OEM Platform Modularization | +2.4% | Global, led by China and Europe | Long term (≥ 4 years) |
| Hydrogen FCEB Pilots in Port Corridors | +1.8% | North America, Europe, select Asia-Pacific ports | Medium term (2–4 years) |
| Route-as-a-Service Contracting | +1.6% | Latin America, Southeast Asia, early EU adoption | Long term (≥ 4 years) |
| Second-Life Battery Monetization | +1.3% | North America, Europe, pilot phase in China | Long term (≥ 4 years) |
| Source: Mordor Intelligence | |||


Battery-Price Decline Below USD 85/kWh
Major Asian production hubs have achieved economies of scale, leading to a continued decline in battery costs. Analysts predict that these costs will decrease further in the near future, potentially allowing electric vehicles to compete with internal combustion engines on price, even without subsidies, provided certain conditions regarding vehicle lifespan and fuel prices are met. Meanwhile, emerging technologies like sodium-ion batteries offer potential cost benefits, albeit with some trade-offs in energy density when compared to traditional lithium-ion batteries. As battery prices fall, there's a noticeable uptick in second-life battery markets. End-of-life battery packs, still boasting considerable usable capacity, are being repurposed for stationary energy storage. This trend not only bolsters the residual values of these batteries but also paves the way for more attractive leasing terms for electric vehicles.
Mainstream EV Mandates in Megacities
Zero-emission rules in major cities act as de facto diesel bans, compressing fleet-renewal timelines to as little as five years and triggering large-scale procurements that outpace local manufacturing capacity[1]“Innovative Clean Transit Regulation,”, California Air Resources Board, arb.ca.gov. Agencies shoulder added expenses for depot redesigns and driver retraining, inflating project budgets by 15–20%. Smaller operators often exit or merge because they lack access to low-cost capital, increasing concentration among large public fleets. Asian cities such as Hong Kong and Ho Chi Minh City pledge full electrification by 2030, creating synchronized demand peaks that strain global supply chains. Compliance costs extend beyond vehicles, encompassing grid upgrades and workforce reskilling, which complicate rollout schedules.
Global OEM Platform Modularization
Chinese manufacturers are leading the way in modular vehicle design, crafting platforms that utilize shared components—such as motors, battery packs, and chassis—across a range of diverse vehicle sizes. This strategy not only reduces production costs but also accelerates time-to-market in the electric bus market. European automakers are following suit; for example, a prominent brand has introduced a dedicated electric platform, discarding heavy diesel-specific parts, which boosts vehicle efficiency and range. With modular architectures, original equipment manufacturers (OEMs) can easily venture into niche markets—such as airport shuttles or school buses—requiring only minor engineering tweaks. Fleet operators also reap the benefits, enjoying easier maintenance and a more streamlined parts inventory, which in turn leads to increased operational efficiency.
Hydrogen FCEB Pilots in Port Corridors
Hydrogen fuel-cell buses can refuel in 15 minutes and achieve a range of 400–500 km, making them particularly appealing to operators on long or hilly routes. Major cities are leveraging pre-existing hydrogen infrastructure, initially designed for industrial use, to pilot programs. This strategy notably curtails the initial investment needed for fueling stations[2]“Hydrogen Shuttle Pilot,”, Port of Los Angeles, portofla.org. Yet, the price of green hydrogen still outstrips that of traditional fuels, curbing its immediate scalability. While European-funded large-scale projects are spearheading early adoption through subsidies, the economic viability of these initiatives over the next decade remains uncertain.
Restraints Impact Analysis*
| Restraint | (~) % Impact on CAGR Forecast | Geographic Relevance | Impact Timeline |
|---|---|---|---|
| Grid-Upgrade Bottlenecks at Depots | -2.1% | North America, Europe, select Asia-Pacific cities | Short term (≤ 2 years) |
| Critical-Minerals Export Curbs | -1.7% | Global, especially non-China supply chains | Short term (≤ 2 years) |
| Scarcity of TCO-Viable Fuel-Cell H₂ | -1.4% | Global, acute outside industrial hydrogen clusters | Medium term (2–4 years) |
| Residual-Value Uncertainty | -1.2% | North America, Europe | Medium term (2–4 years) |
| Source: Mordor Intelligence | |||
Grid-Upgrade Bottlenecks at Depots
Expanding depot capacity for electric fleets often requires significant upgrades to power infrastructure, including additional transformer capacity and extended coordination with utilities. These projects can be delayed by interconnection queues and land constraints at older sites, which add complexity and cost to real-estate planning in the electric bus market. Furthermore, the need for advanced energy management systems and grid modernization adds another layer of challenges, requiring collaboration between fleet operators, utilities, and policymakers to ensure seamless integration and scalability.
Scarcity of TCO-Viable Fuel-Cell Grade H₂
Fuel-cell bus pilots grapple with economic challenges. The expense of green hydrogen keeps its operating costs higher than those of diesel fleets. This is before even considering the hefty investment needed for fueling infrastructure. Additionally, geographic disparities in hydrogen supply complicate deployments, necessitating route adjustments that reduce efficiency. Although recent U.S. legislation offers production incentives that bolster short-term economics, uncertainties looming beyond the next decade deter private investments in specialized fueling networks.
*Our forecasts treat driver/restraint impacts as directional, not additive. The impact forecasts reflect baseline growth, mix effects, and variable interactions.
Segment Analysis
By Propulsion: Hydrogen Gains as Range Demands Rise
Battery-electric buses held an 83.92% Electric Bus Market share in 2025, while fuel-cell models are forecasted to have a 20.82% CAGR through 2031, as intercity operators value a 400–500 km range and sub-15-minute refueling. Plug-in hybrids shrink as battery ranges exceed 300 km. BEB growth ties directly to lithium-ion price drops, depot-charging compatibility, and favorable overnight charging tariffs. FCEB growth clusters around ports and mountainous regions, where weight savings are crucial and existing hydrogen infrastructure reduces capital expenditures.
City fleets will standardize on BEBs by 2028, whereas long-haul corridors adopt hydrogen as costs approach USD 3–4 per kg. California’s Advanced Clean Fleets rule recognizes both technologies for compliance, aligning regulatory incentives. Fast refueling and lighter axle loads make FCEBs competitive on time-sensitive routes, provided green hydrogen scales.


By Application: Intercity Routes Drive Range Innovation
City buses accounted for 62.37% of 2025 deployments; however, intercity services are projected to grow at a 19.18% CAGR due to the widening availability of 300-450 km battery packs. With substantial federal grants backing the initiative, school-bus electrification is gaining momentum. Meanwhile, airport shuttle operators are turning to electric vehicles, aiming to reduce noise and emissions in their confined operating environments.
Urban routes lead the charge in electrification, as their stop-and-go traffic optimally harnesses the benefits of regenerative braking. Intercity adoption is on the rise, thanks to advancements in battery energy density and plummeting costs, which lessen the dependence on costly en-route charging stations. Additionally, both tourism and corporate shuttle fleets are transitioning to electric models, aligning with sustainability goals and reaping the benefits of significantly reduced maintenance needs.
By Battery Chemistry: LFP Dominates on Safety and Cost
LFP packs captured 59.63% of 2025 installations on cost and thermal stability, and NMC/NCA chemistries are expected to see a 20.28% CAGR as density surpasses 250 Wh/kg. Lithium-titanate caters to fast-charge urban loops, while sodium-ion targets cost-sensitive, short-range applications.
LFP’s cobalt-free design mitigates supply-chain risk and enables full-depth-of-discharge cycles without accelerated degradation. NMC and NCA architectures serve routes requiring a range of over 450 km but require more robust thermal management, which raises pack expense. Sodium-ion reduces exposure to lithium pricing but sacrifices range capability, constraining it to dense urban runs.
By Length: Articulated Models Serve High-Capacity Corridors
Standard 9–14 meter buses covered 67.29% of 2025 deliveries; 14–18 meter articulated models are projected to rise at a 19.06% CAGR to meet passenger loads exceeding 8,000 per hour on trunk routes. Sub-9-meter formats fill narrow-street and rural duties, while units exceeding 18 meters remain confined to purpose-built BRT corridors.
Articulated buses, with their lower labor costs per passenger-mile, are becoming the go-to choice for high-capacity routes. Yet, the need for significantly larger battery packs means a heftier upfront investment. While historic city centers in Europe lean towards shorter buses for enhanced maneuverability, major cities in Asia are carving out dedicated transit lanes, integrating articulated electric fleets into their long-term urban mobility blueprints.
By Motor Architecture: SRM Emerges for Efficiency Gains
Permanent-magnet synchronous motors (PMSMs) held a 64.31% share in 2025, yet switched-reluctance motors (SRMs) are forecasted for a 21.09% CAGR as rare-earth pricing volatility drives magnet-free solutions. Induction motors persist in price-sensitive segments.
SRM eliminates neodymium dependency and improves efficiency, lengthening range by up to 15 km. Recent advances in control algorithms mitigate torque ripple and cabin noise. PMSM remains the benchmark for torque density, particularly in high-speed, intercity operations.
By Motor Power: High-Power Variants Support Articulated and Hilly Routes
The 151–200 kW class held a 49.72% share in 2025; the 251–320 kW tier is expected to expand at a 20.31% CAGR to power articulated buses and routes with sustained grades. Under-100 kW motors serve lightweight models, while options exceeding 320 kW target bi-articulated BRT deployments.
Motor efficiency gains may enable 200 kW units to replace today’s 220 kW specification by 2028, simplifying OEM portfolios. Powerband selection correlates with route topography, bus length, and desired acceleration.
By Range: Long-Range Models Eliminate Charging Anxiety
Buses with 201–300 km autonomy represented 47.17% of 2025 demand; above-450 km vehicles will gain at a 20.16% CAGR as intercity operators bypass en-route chargers and cut capex. Under-100 km designs leverage fast-charging pantographs in dense urban grids.
As battery pack costs dip below USD 80 per kWh, there's a growing trend to oversize them. This approach not only boosts scheduling flexibility and enhances residual value but also provides long-term operational benefits. By oversizing battery packs, businesses can reduce dependency on extensive charging infrastructure, optimize energy usage, and improve overall fleet efficiency. This strategy effectively balances capital expenditure with significant savings on charging infrastructure, making it a viable solution for industries aiming to streamline operations and reduce costs.
By End Use: Private Fleets Electrify Under Sustainability Mandates
Public fleets accounted for 81.18% of 2025 purchases, driven by regulatory deadlines and subsidies; however, private operators are expected to rise at a 19.44% CAGR as corporate campuses and tourism operators electrify. Higher financing costs and concerns about residual value have slowed private sector uptake; however, sustainability-linked financing and second-life battery monetization are helping to narrow the gap.
Corporate tech campuses operate over 100 electric shuttles, positioning electrification as a key milestone in employee engagement and ESG. Faster decision cycles in private firms enable earlier adoption of next-generation platforms.
Geography Analysis
In 2025, the Asia-Pacific region dominated the market, accounting for 64.82% of the total volume. China's extensive fleet of electric buses, coupled with India's national subsidy initiatives, is propelling the electrification of bus fleets across Asia[3]“India FAME II Tender Awards,”, Economic Times, economictimes.indiatimes.com. These initiatives are narrowing the cost disparity between electric and diesel buses, making it easier for operators to transition. At the same time, Japan and South Korea are positioning themselves at the forefront of hydrogen mobility, integrating fuel-cell buses into their national agendas to bolster hydrogen infrastructure and advocate for cleaner transportation.
Europe is on track to achieve a robust 19.88% CAGR, spurred by the EU Clean Vehicles Directive's push for zero-emission city buses. Countries such as Germany and France are backing this transition with substantial financial incentives for electric buses. Furthermore, cities like London, Paris, and Milan are intensifying their efforts to phase out diesel fleets, bolstered by the establishment of low-emission zones. In a bid to boost domestic battery-cell production, local-content mandates are gaining traction, with industry giants like Northvolt and LG Energy Solution ramping up their gigafactory capacities.
In North America, federal grants and infrastructure initiatives are championing the transition, especially within school bus fleets. Yet, progress is hampered by utility interconnection delays. Meanwhile, in Latin America, cities are experimenting with innovative contract models, such as "route-as-a-service," to navigate financial hurdles. In the Middle East, urban centers are integrating electric buses into their central shuttle routes, aligning with broader sustainability goals.

Competitive Landscape
A select group of leading manufacturers dominates the global electric bus market, indicating moderate market concentration. Leveraging vertical integration, Chinese firms enjoy a pricing edge. In response, their counterparts in Europe and North America are locking in long-term battery supply agreements and investing resources in specialized electric vehicle platforms.
The recent insolvency of a prominent U.S. manufacturer, followed by asset liquidations, highlights the sector's capital-intensive nature and the unpredictability of residual values. Industry stalwarts like Daimler and Volvo counteract margin pressures in their electric divisions by drawing on revenues from their traditional diesel offerings. In contrast, newer entrants are carving out niches with lightweight chassis innovations and a focus on service-driven business models.
Key technological advancements, including solid-state batteries, wireless charging, and AI-led predictive maintenance, are all aimed at minimizing vehicle downtime. As safety and cybersecurity standards evolve, they set a high bar for newcomers to meet. Furthermore, local-content mandates in pivotal markets such as India, Brazil, and the U.S. complicate the challenge of scaling operations internationally.
Electric Bus Industry Leaders
BYD Company Ltd.
Yutong Bus Co., Ltd.
CRRC Electric Vehicle Co. Ltd.
NFI Group.
Volvo Group AB
- *Disclaimer: Major Players sorted in no particular order


Recent Industry Developments
- October 2025: At Busworld 2025 in Brussels, JBM Electric Vehicles (JBM EV) introduced its latest innovation: the all-electric city bus, ECOLIFE e12. Spanning 12 metres, the ECOLIFE e12 is tailored for urban transport. Crafted with a lightweight stainless steel monocoque body, it boasts an impressive driving range of 400 kilometres on a single charge. The ECOLIFE e12 is designed to meet the growing demand for sustainable and efficient public transportation solutions in urban areas. It incorporates advanced battery technology and energy-efficient systems, ensuring reduced operational costs and minimal environmental impact. JBM EV aims to support cities in transitioning to cleaner mobility options with this state-of-the-art electric bus.
- September 2025: In a significant push for electrifying public transport and promoting innovative urban mobility in India, the International Finance Corporation (IFC) has extended a financing package of USD 137 million. This funding is split between two prominent players in the e-mobility sector: JBM ECOLIFE (JBM), a subsidiary of JBM Auto Limited and a leading manufacturer and operator of e-buses in India, receives USD 100 million, while GreenCell Mobility (GreenCell), the country's largest OEM-agnostic e-bus operator backed by Eversource Capital, secures USD 37 million in mezzanine capital.


Global Electric Bus Market Report Scope
The Electric Bus Market Report is Segmented by Propulsion (Battery Electric Bus, Plug-in Hybrid Electric Bus, and Fuel Cell Electric Bus), Application (City/Transit, Intercity/Regional, Coach/Tourist, School Bus, Airport, and Others), Battery Chemistry (LFP, NMC/NCA, LTO, and Others), Length (Below 9m, 9-14m, 14-18m, Above 18m), Motor Architecture (PMSM, Induction Motor, SRM, Others), Motor Power (Below 100kW, 100-150kW, 151-200kW, 201-250kW, 251-320kW, Above 320kW), Range (Below 100km, 100-200km, 201-300km, 300-450km, Above 450km), End Use (Public, Private), and Geography (North America, South America, Europe, Asia-Pacific, and Middle East & Africa). The Market Forecasts are Provided in Terms of Value (USD) and Volume (Units).
By Propulsion
| Battery Electric Bus (BEB) |
| Plug-in Hybrid Electric Bus (PHEB) |
| Fuel Cell Electric Bus (FCEB) |
By Application
| City / Transit |
| Intercity / Regional |
| Coach / Tourist |
| School Bus |
| Airport |
| Others |
By Battery Chemistry
| Lithium Iron Phosphate (LFP) |
| Nickel Manganese Cobalt (NMC) / Nickel Cobalt Aluminum (NCA) |
| Lithium Titanate (LTO) |
| Others (Sodium-ion, emerging / pilots) |
By Length
| Below 9 m |
| 9-14 m |
| 14-18 m |
| Above 18 m |
By Motor Architecture
| Permanent Magnet Synchronous Motor (PMSM) |
| Induction Motor / Asynchronous AC |
| Switched Reluctance Motor (SRM) |
| Others |
By Motor Power
| Below 100 kW |
| 100-150 kW |
| 151-200 kW |
| 201-250 kW |
| 251-320 kW |
| Above 320 kW |
By Range
| Below 100 km |
| 100-200 km |
| 201-300 km |
| 300-450 km |
| Above 450 km |
By End Use
| Public |
| Private |
By Geography
| North America | United States |
| Canada | |
| Mexico | |
| Rest of North America | |
| South America | Brazil |
| Argentina | |
| Rest of South America | |
| Europe | Germany |
| France | |
| Italy | |
| Spain | |
| United Kingdom | |
| Rest of Europe | |
| Asia-Pacific | China |
| India | |
| Japan | |
| South Korea | |
| Asia-Pacific | |
| Middle East and Africa | United Arab Emirates |
| South Africa | |
| Rest of Middle East and Africa |
| By Propulsion | Battery Electric Bus (BEB) | |
| Plug-in Hybrid Electric Bus (PHEB) | ||
| Fuel Cell Electric Bus (FCEB) | ||
| By Application | City / Transit | |
| Intercity / Regional | ||
| Coach / Tourist | ||
| School Bus | ||
| Airport | ||
| Others | ||
| By Battery Chemistry | Lithium Iron Phosphate (LFP) | |
| Nickel Manganese Cobalt (NMC) / Nickel Cobalt Aluminum (NCA) | ||
| Lithium Titanate (LTO) | ||
| Others (Sodium-ion, emerging / pilots) | ||
| By Length | Below 9 m | |
| 9-14 m | ||
| 14-18 m | ||
| Above 18 m | ||
| By Motor Architecture | Permanent Magnet Synchronous Motor (PMSM) | |
| Induction Motor / Asynchronous AC | ||
| Switched Reluctance Motor (SRM) | ||
| Others | ||
| By Motor Power | Below 100 kW | |
| 100-150 kW | ||
| 151-200 kW | ||
| 201-250 kW | ||
| 251-320 kW | ||
| Above 320 kW | ||
| By Range | Below 100 km | |
| 100-200 km | ||
| 201-300 km | ||
| 300-450 km | ||
| Above 450 km | ||
| By End Use | Public | |
| Private | ||
| By Geography | North America | United States |
| Canada | ||
| Mexico | ||
| Rest of North America | ||
| South America | Brazil | |
| Argentina | ||
| Rest of South America | ||
| Europe | Germany | |
| France | ||
| Italy | ||
| Spain | ||
| United Kingdom | ||
| Rest of Europe | ||
| Asia-Pacific | China | |
| India | ||
| Japan | ||
| South Korea | ||
| Asia-Pacific | ||
| Middle East and Africa | United Arab Emirates | |
| South Africa | ||
| Rest of Middle East and Africa | ||


Market Definition
- Vehicle Type - The category includes Medium and Heavy Duty Buses.
- Vehicle Body Type - This include Bus category.
- Fuel Category - The category exclusively covers electric propulsion systems, including various types such as HEV (Hybrid Electric Vehicles), PHEV (Plug-in Hybrid Electric Vehicles), BEV (Battery Electric Vehicles), and FCEV (Fuel Cell Electric Vehicles).
| Keyword | Definition |
|---|---|
| Electric Vehicle (EV) | A vehicle which uses one or more electric motors for propulsion. Includes cars, buses, and trucks. This term includes all-electric vehicles or battery electric vehicles and plug-in hybrid electric vehicles. |
| BEV | A BEV relies completely on a battery and a motor for propulsion. The battery in the vehicle must be charged by plugging it into an outlet or public charging station. BEVs do not have an ICE and hence are pollution-free. They have a low cost of operation and reduced engine noise as compared to conventional fuel engines. However, they have a shorter range and higher prices than their equivalent gasoline models. |
| PEV | A plug-in electric vehicle is an electric vehicle that can be externally charged and generally includes all-electric vehicles as well as plug-in hybrids. |
| Plug-in Hybrid EV | A vehicle that can be powered either by an ICE or an electric motor. In contrast to normal hybrid EVs, they can be charged externally. |
| Internal combustion engine | An engine in which the burning of fuels occurs in a confined space called a combustion chamber. Usually run with gasoline/petrol or diesel. |
| Hybrid EV | A vehicle powered by an ICE in combination with one or more electric motors that use energy stored in batteries. These are continually recharged with power from the ICE and regenerative braking. |
| Commercial Vehicles | Commercial vehicles are motorized road vehicles designed for transporting people or goods. The category includes light commercial vehicles (LCVs) and medium and heavy-duty vehicles (M&HCV). |
| Passenger Vehicles | Passenger cars are electric motor– or engine-driven vehicles with at least four wheels. These vehicles are used for the transport of passengers and comprise no more than eight seats in addition to the driver’s seat. |
| Light Commercial Vehicles | Commercial vehicles that weigh less than 6,000 lb (Class 1) and in the range of 6,001–10,000 lb (Class 2) are covered under this category. |
| M&HDT | Commercial vehicles that weigh in the range of 10,001–14,000 lb (Class 3), 14,001–16,000 lb (Class 4), 16,001–19,500 lb (Class 5), 19,501–26,000 lb (Class 6), 26,001–33,000 lb (Class 7) and above 33,001 lb (Class 8) are covered under this category. |
| Bus | A mode of transportation that typically refers to a large vehicle designed to carry passengers over long distances. This includes transit bus, school bus, shuttle bus, and trolleybuses. |
| Diesel | It includes vehicles that use diesel as their primary fuel. A diesel engine vehicle have a compression-ignited injection system rather than the spark-ignited system used by most gasoline vehicles. In such vehicles, fuel is injected into the combustion chamber and ignited by the high temperature achieved when gas is greatly compressed. |
| Gasoline | It includes vehicles that use gas/petrol as their primary fuel. A gasoline car typically uses a spark-ignited internal combustion engine. In such vehicles, fuel is injected into either the intake manifold or the combustion chamber, where it is combined with air, and the air/fuel mixture is ignited by the spark from a spark plug. |
| LPG | It includes vehicles that use LPG as their primary fuel. Both dedicated and bi-fuel LPG vehicles are considered under the scope of the study. |
| CNG | It includes vehicles that use CNG as their primary fuel. These are vehicles that operate like gasoline-powered vehicles with spark-ignited internal combustion engines. |
| HEV | All the electric vehicles that use batteries and an internal combustion engine (ICE) as their primary source for propulsion are considered under this category. HEVs generally use a diesel-electric powertrain and are also known as hybrid diesel-electric vehicles. An HEV converts the vehicle momentum (kinetic energy) into electricity that recharges the battery when the vehicle slows down or stops. The battery of HEV cannot be charged using plug-in devices. |
| PHEV | PHEVs are powered by a battery as well as an ICE. The battery can be charged through either regenerative breaking using the ICE or by plugging into some external charging source. PHEVs have a better range than BEVs but are comparatively less eco-friendly. |
| Hatchback | These are compact-sized cars with a hatch-type door provided at the rear end. |
| Sedan | These are usually two- or four-door passenger cars, with a separate area provided at the rear end for luggage. |
| SUV | Popularly known as SUVs, these cars come with four-wheel drive, and usually have high ground clearance. These cars can also be used as off-road vehicles. |
| MPV | These are multi-purpose vehicles (also called minivans) designed to carry a larger number of passengers. They carry between five and seven people and have room for luggage too. They are usually taller than the average family saloon car, to provide greater headroom and ease of access, and they are usually front-wheel drive. |


Research Methodology
Mordor Intelligence follows a four-step methodology in all its reports.
- Step-1: Identify Key Variables: To build a robust forecasting methodology, the variables and factors identified in Step-1 are tested against available historical market numbers. Through an iterative process, the variables required for market forecast are set and the model is built based on these variables.
- Step-2: Build a Market Model: Market-size estimations for the historical and forecast years have been provided in revenue and volume terms. Market revenue is calculated by multiplying the sales volume with their respective average selling price (ASP). While estimating ASP factors like average inflation, market demand shift, manufacturing cost, technological advancement, and varying consumer preference, among others have been taken into account.
- Step-3: Validate and Finalize: In this important step, all market numbers, variables, and analyst calls are validated through an extensive network of primary research experts from the market studied. The respondents are selected across levels and functions to generate a holistic picture of the market studied.
- Step-4: Research Outputs: Syndicated Reports, Custom Consulting Assignments, Databases & Subscription Platforms.


