Van Market Size and Share
Market Overview
| Study Period | 2019 - 2030 |
|---|---|
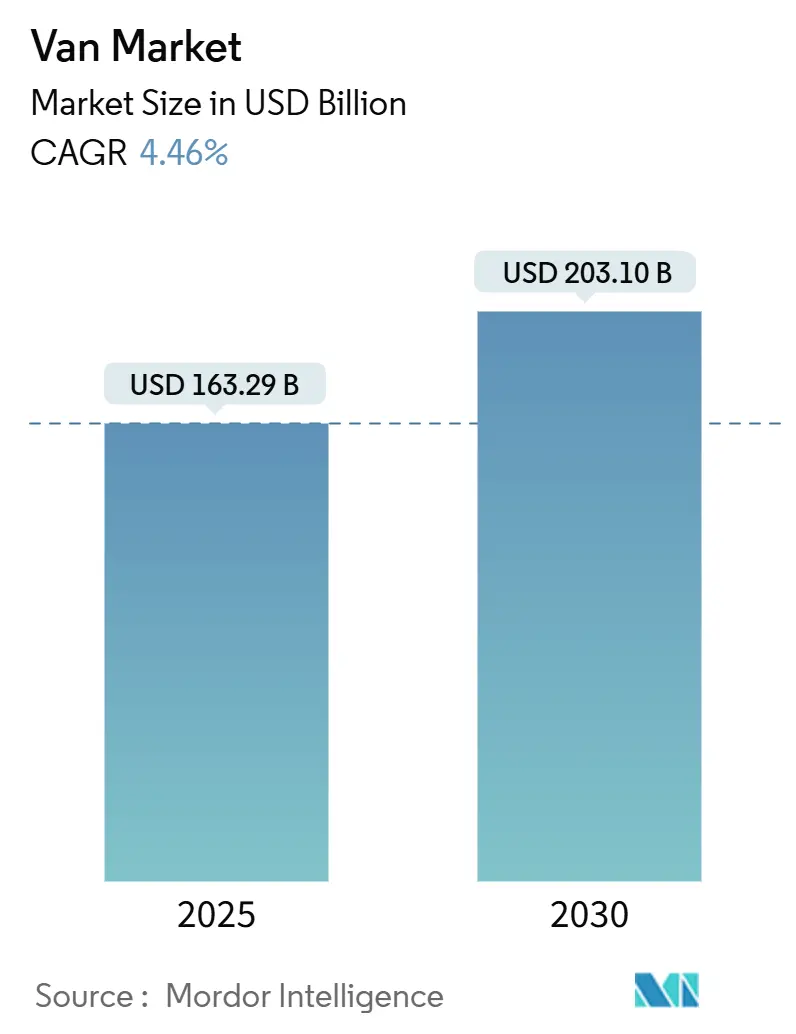
| Market Size (2025) | USD 163.29 Billion |
| Market Size (2030) | USD 203.10 Billion |
| Growth Rate (2025 - 2030) | 4.46% CAGR |
| Fastest Growing Market | Asia Pacific |
| Largest Market | Europe |
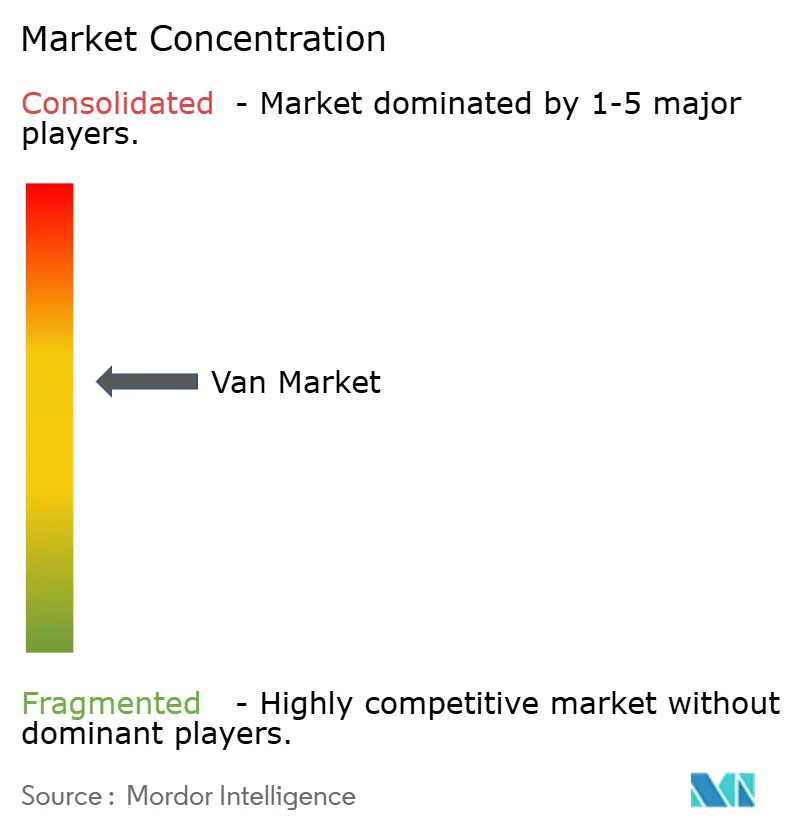
| Market Concentration | Medium |
Major Players *Disclaimer: Major Players sorted in no particular order Image © Mordor Intelligence. Reuse requires attribution under CC BY 4.0. | |
Van Market Analysis by Mordor Intelligence
The global van market size stands at USD 163.29 billion in 2025 and is forecast to reach USD 203.10 billion by 2030, reflecting a 4.46% CAGR over the period. Growing e-commerce volumes, stringent zero-emission regulations and rapid charging infrastructure build-outs are reshaping product strategies and capital flows. Battery-electric vans are benefiting from policy certainty that compels fleets to invest despite higher purchase prices. Meanwhile, partnerships such as Honda-Nissan-Mitsubishi and Tata-Iveco are accelerating platform standardization to manage cost pressure and semiconductor constraints. Supply chain resilience remains a watchpoint, yet total cost-of-ownership parity for electric models is drawing closer, creating structural tailwinds for the van market through 2030.
Key Report Takeaways
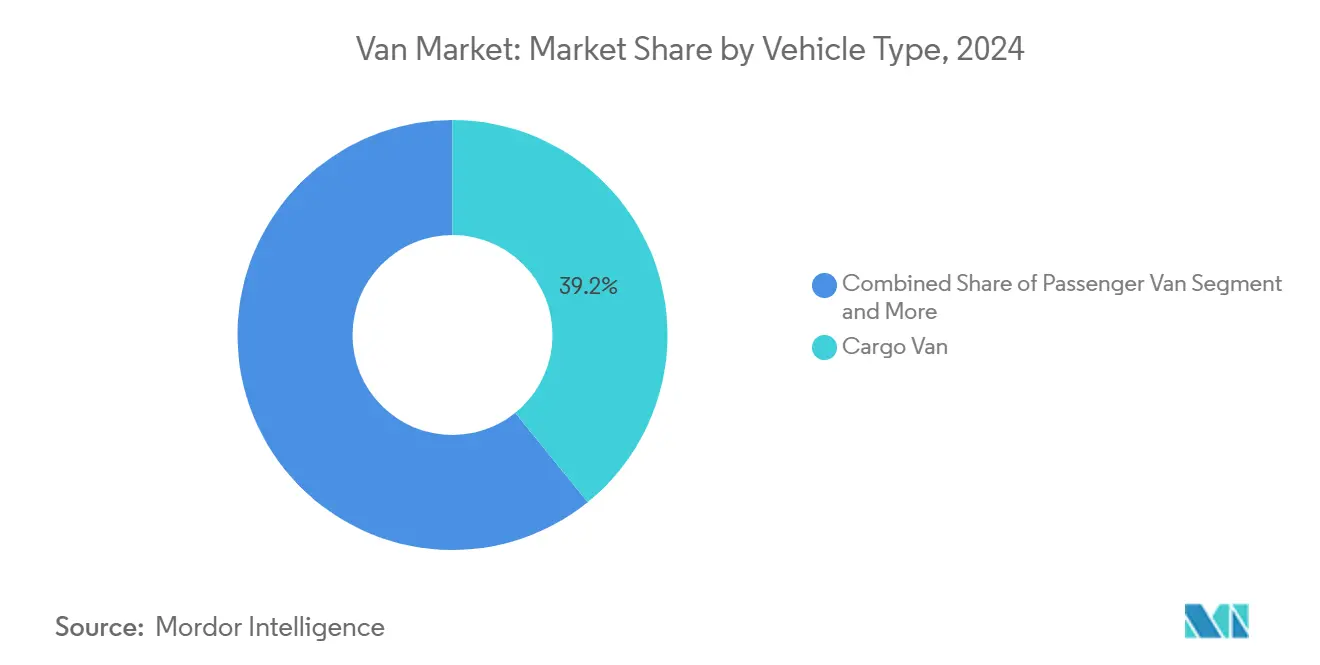
- By vehicle type, cargo vans held 39.22% of the van market share in 2024, while panel vans posted the fastest 8.31% CAGR through 2030.
- By tonnage capacity, 2-3 tons captured 48.27% of market share in 2024; the 3-5.5 tons band is projected to expand at 7.82% CAGR to 2030.
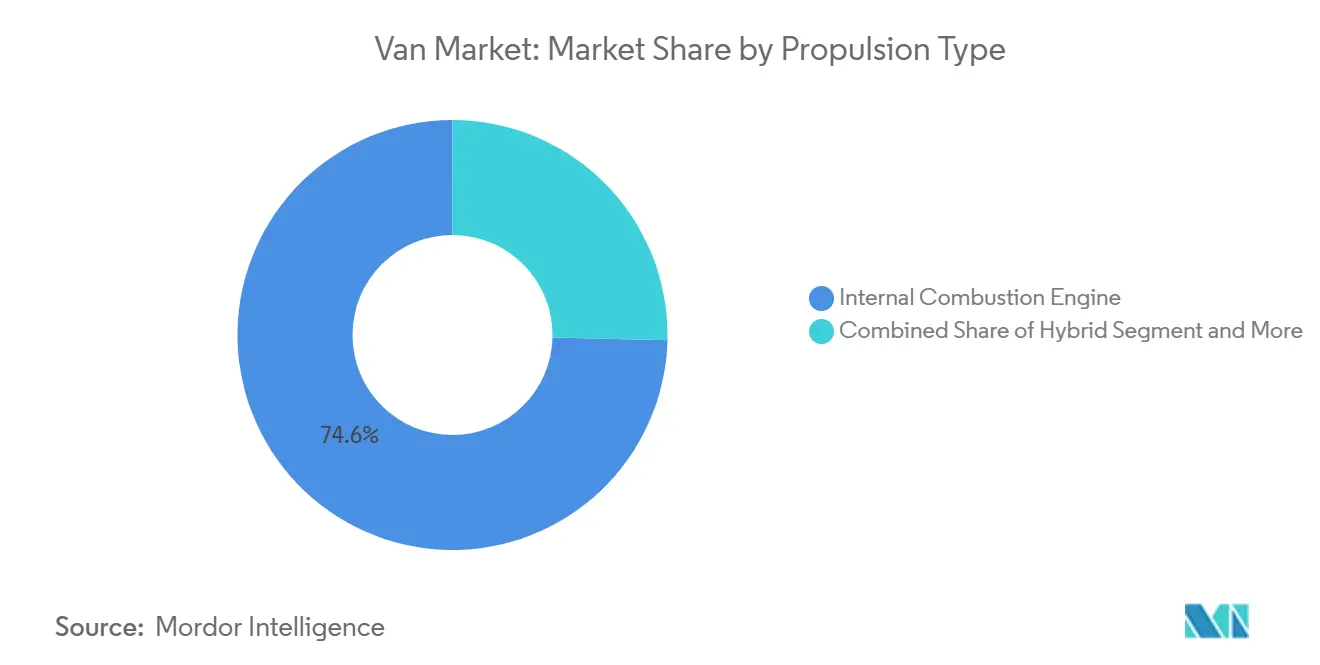
- By propulsion type, internal combustion engine models commanded 74.61% van market share in 2024, whereas battery electric vans are forecast to advance at a 10.92% CAGR through 2030.
- By end-use, commercial applications accounted for 85.42% of the market size in 2024 and are growing at an 8.18% CAGR to 2030.
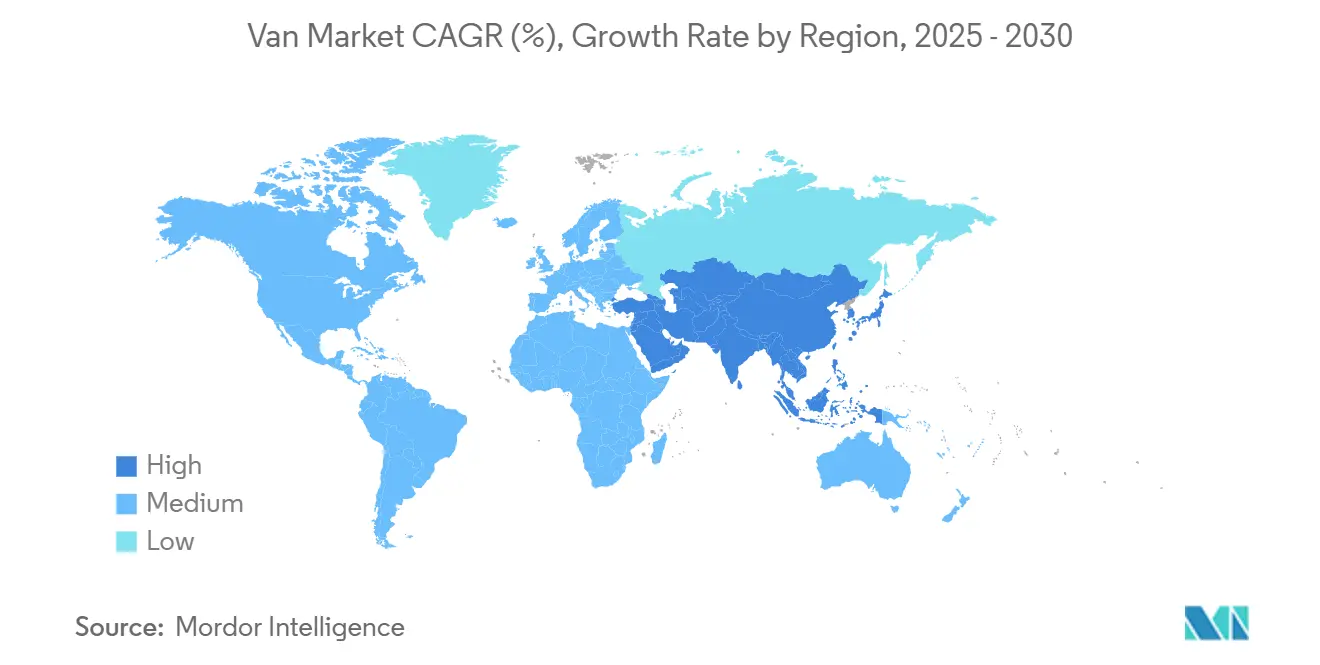
- By geography, Europe led with 30.83% van market share in 2024, but Asia-Pacific is anticipated to grow at 8.71% CAGR between 2025 and 2030.
Global Van Market Trends and Insights
Drivers Impact Analysis*
| Driver | (~) % Impact on CAGR Forecast | Geographic Relevance | Impact Timeline |
|---|---|---|---|
| Electrification Mandates and Zero-emission Zones | +1.2% | Europe, North America, China | Medium term (2-4 years) |
| E-commerce Last-mile Boom | +0.9% | Global urban centers | Short term (≤ 2 years) |
| Urban Logistics Space Constraints | +0.6% | Worldwide, especially Asia-Pacific | Long term (≥ 4 years) |
| Customizable Mobile-business Platforms | +0.4% | North America, Europe | Medium term (2-4 years) |
| 4.25-ton GVW Derogation for E-vans | +0.3% | European Union | Short term (≤ 2 years) |
| ASEAN Localization Incentives | +0.2% | ASEAN economies | Long term (≥ 4 years) |
| Source: Mordor Intelligence | |||
Electrification Mandates and Zero-Emission Zones
Policy signals are forcing a strategic pivot across the market. The EU now requires a 100% cut in tailpipe emissions for new vans by 2035, while more than 200 European municipalities restrict internal-combustion access[1]“CO₂ Emission Performance Standards,”, European Commission, ec.europa.eu. Norway already records an 82.4% electric-vehicle share, offering a clear proof point. Parallel mandates in China and the United Kingdom set escalating zero-emission sales quotas, creating predictable demand curves that justify OEM electrification budgets[2]“ZEV Mandate Policy Paper,”, Government of the United Kingdom, gov.uk. Chinese dominance—52,000 electric trucks in 2022—underscores how state support shifts competitive advantage. As a result, fleet operators are re-evaluating replacement cycles and redirecting capital toward battery vans despite higher upfront expenditure.
E-Commerce Last-Mile Boom
Online retail penetration keeps parcel volumes on a steep upward path, forcing logistics firms to multiply urban delivery routes. Amazon’s 100,000-unit Rivian order underlines how e-commerce buyers are pushing suppliers toward dedicated electric fleets. Micro-fulfillment centers located within city limits favor compact vans that balance payload with maneuverability. Real-time route optimization and over-the-air diagnostics require software-defined vehicles, elevating data connectivity to a core purchase criterion. Persistent consumer preference for two-day shipping supports a floor under van market demand despite broader macro uncertainty.
Customizable Mobile-Business Platforms
Food trucks, pop-up clinics and mobile workshops are expanding revenue options for vehicle converters. Flexible interiors with modular power supplies enable rapid changeovers between retail, health or service functions. Growth in the gig economy is creating a secondary sales channel for OEMs supplying chassis-cab variants equipped for bespoke builds. Higher margin conversion packages allow manufacturers to defend profitability in a price-competitive van market.
ASEAN Localization Incentives for LCVs
Thailand’s EV3.5 roadmap, Indonesia’s integrated battery projects and Malaysia’s National Automotive Policy combine purchase subsidies with local-content rules that reward domestic assembly. BYD’s USD 1.3 billion Indonesia plant shows OEMs are responding with capital commitments. The resulting supply-chain depth reduces landed costs and strengthens the growth outlook for Asia-Pacific, the fastest-rising van market region.
Restraints Impact Analysis*
| Restraint | (~) % Impact on CAGR Forecasr | Geographic Relevance | Impact Timeline |
|---|---|---|---|
| Semiconductor and Component Shortages | -0.8% | Global, Asia-centric supply | Short term (≤ 2 years) |
| High Upfront Cost of BEV Vans | -0.6% | Worldwide, acute in emerging markets | Medium term (2-4 years) |
| Shortage of EV-Trained Service Technicians | -0.4% | North America, Europe, Australia | Medium term (2-4 years) |
| UK VED on Zero-Emission Vans | -0.1% | United Kingdom | Short term (≤ 2 years) |
| Source: Mordor Intelligence | |||
Semiconductor and Component Shortages
Electric vans need up to triple the chips used in diesel equivalents, making them vulnerable to wafer supply shocks. Disruptions at high-purity quartz mines in North Carolina jeopardize semiconductor output and have already prompted temporary assembly pauses at Rivian’s Illinois plant. Tariff proposals on Asian chip imports could raise build costs while alternative capacity stays limited. Prolonged shortages risk delaying customer deliveries and slowing the market adoption curve.
High Upfront Cost of BEV Vans
Battery packs still account for 30-40% of a vehicle’s value. Purchase prices sit 25–40% above diesel equivalents, stressing cash flow for small operators. Total cost-of-ownership parity often arrives only after three years, challenging buyers in credit-constrained markets [3]“Urban Low-Emission Zones 2024,”, Transport & Environment, transportenvironment.org. Incentive programs vary by region, generating uneven fleet transition rates.
*Our forecasts treat driver/restraint impacts as directional, not additive. The impact forecasts reflect baseline growth, mix effects, and variable interactions.
Segment Analysis
By Vehicle Type: Panel vans seize new-use growth
Panel vans opened 2025 with an 8.31% CAGR outlook, the highest among body styles as mobile business models multiply. First responders, health clinics and retail pop-ups prize seamless side walls and configurable interiors. Cargo vans remain the workhorse, retaining a 39.22% slice of the van market share, thanks to broad parts availability and robust residual values. Panel variants nonetheless attract capital as their specialized roles deliver premium margins.
Demand for passenger vans is cooling as ride-sharing diverts some commuter traffic into smaller shuttles. Minivans occupy a niche between SUVs and buses and still attract family buyers, highlighted by Toyota’s 20% Sienna output bump. Yet the cargo and panel configurations collectively dominate the market, reflecting their adaptability to logistics, service and on-site commerce applications.


By Tonnage Capacity: Mid-weight shift gathers pace
The 2-3 Tons bracket holds 48.27% of the van market share, though growth is tilting toward the 3-5.5 Tons band with a 7.82% CAGR outlook. Operators want a payload that accommodates both heavier e-commerce parcels and battery weight. EU licensing relief up to 4.25 tons gives fleets flexibility without advanced driver credentials, directly supporting the higher weight class.
Vans under 2 tons still serve hyper-dense urban cores where parking and turning radius trump payload. Tata Motors is trialing sub-600 kg delivery platforms targeting emerging-market micro-logistics. At the other extreme, vehicles exceeding 5.5 tons now incorporate electric drivelines mainly for regional haul routes, yet their share of the market size remains small.
By Propulsion Type: Battery electric momentum
Internal-combustion powertrains supplied 74.61% of 2024 volume, but battery electric adoption is accelerating at 10.92% CAGR. Ford’s E-Transit leads North American registrations, confirming that range of 200 miles and widespread depot charging can satisfy many duty cycles. Mercedes-Benz plans to move half of global van sales onto its VAN.EA platform after 2026, illustrating OEM commitment to large-scale electrification.
Plug-in hybrids bridge technology gaps, now sitting at 2.30% penetration versus 0.10% in 2018. That share may plateau as charging networks proliferate and battery prices fall. Hydrogen-fuel prototypes remain experimental, yet Stellantis’ STLA Frame demonstrates that multi-energy platforms are possible within a single architecture.
By End-Use: Commercial fleets dominate
Commercial buyers accounted for 85.42% of the van market size in 2024. Corporate fleets, which own 58% of registered vans and drive the mileage, are the focal point for electrification strategies because centralized depots simplify charging rollouts. Parcel operators chase higher drop densities and favor mid-size panels with telematics for route optimization.
Personal-use vans trend toward leisure conversions and family movers. Yet price sensitivity, range anxiety, and charging access mean household buyers convert more slowly than businesses. Regulators often exclude personal buyers from incentive pools, entrenching the corporate tilt within the van market.
Geography Analysis
Europe leads the van market with a 30.83% share, due to harmonized emission mandates, well-developed charging corridors, and cohesive urban policies. Registrations climbed 8.3% in 2024, even though Q1 2025 volumes dipped, highlighting sensitivity to economic sentiment. Partnerships like Volvo-Renault Flexis channel EUR 300 million into next-generation electric vans, signaling OEM faith in stable long-term demand. Consolidating zero-emission zones across more than 200 cities creates a captive market for electric models.
Asia-Pacific is the fastest-growing region with an 8.71% CAGR to 2030, supported by Chinese manufacturing scale and ASEAN localization incentives. China alone delivered 52,000 electric trucks in 2022, equal to 85% of global sales, illustrating how policy alignment drives output. BYD’s USD 1.3 billion Indonesian plant and Thailand’s 350,000-unit EV target illustrate regional supply-chain expansion. The rise in localized capacity lowers delivered costs and cements Asia-Pacific as a pivotal contributor to future van market growth.
North America shows mixed signals. The American Trucking Associations projects freight tonnage growth from 11.27 billion tons in 2024 to 13.99 billion tons by 2035, underpinning baseline demand. Yet Ford’s delay of new electric pickups and vans to 2028 reveals OEM caution where incentives are weaker. South America and the Middle East & Africa are emerging markets where infrastructure gaps restrain rapid adoption, yet rising urbanization still supports incremental volume.

Competitive Landscape
Legacy brands such as Ford, Mercedes-Benz, and Volkswagen anchor the van industry, leveraging mature assembly footprints and dealer ecosystems. The Honda-Nissan-Mitsubishi alliance pools 8.33 million units of capacity to dilute R&D outlays and contest the electric van space against Tesla and Chinese newcomers. Tata Motors’ EUR 3.8 billion acquisition of Iveco expands its geographic scope to Europe and raises combined commercial-vehicle revenue to EUR 22 billion.
Chinese OEMs like BYD are exporting aggressively, aided by competitive battery costs and strategic ride-hailing partnerships, notably a 100,000-vehicle supply deal with Uber across Europe and Latin America. Software-defined architectures are becoming differentiators; Ford is developing a flexible platform that can underpin multiple van styles. Volkswagen’s USD 5 billion JV with Rivian gives each party access to advanced over-the-air software stacks. The van market is thus consolidating around scale, software capability, and battery supply security.
Market entry barriers remain high due to crash-test certification, emissions compliance, and capital intensity. However, white-space niches—such as ultra-compact urban delivery and specialized mobile business vans—offer footholds for innovators. Overall, competitive pressure is steering established players toward deeper partnerships and technology sharing to defend their share against agile newcomers.
Van Industry Leaders
Ford Motor Company
Mercedes-Benz Group AG
Volkswagen
Stellantis N.V.
Toyota Motor Corporation
- *Disclaimer: Major Players sorted in no particular order

Recent Industry Developments
- August 2025: Tata Motors agreed to acquire Iveco Group for EUR 3.8 billion (USD 4.42 billion), creating a 540,000-unit commercial-vehicle entity with EUR 22 billion (USD 25.6 billion) revenue.
- April 2025: Volkswagen partnered with Uber to supply self-driving electric vans for United States deployment.


Global Van Market Report Scope
| Cargo Van |
| Passenger Van |
| Minivan |
| Panel Van |
| Up to 2 Tons |
| 2-3 Tons |
| 3-5.5 Tons |
| Internal Combustion Engine (ICE) |
| Hybrid |
| Plug-in Hybrid |
| Battery Electric |
| Commercial |
| Personal |
| North America | United States |
| Canada | |
| Rest of North America | |
| South America | Brazil |
| Argentina | |
| Rest of South America | |
| Europe | Germany |
| United Kingdom | |
| France | |
| Italy | |
| Spain | |
| Russia | |
| Rest of Europe | |
| Asia-Pacific | China |
| Japan | |
| India | |
| South Korea | |
| Australia | |
| Rest of Asia-Pacific | |
| Middle East & Africa | Saudi Arabia |
| United Arab Emirates | |
| Turkey | |
| South Africa | |
| Egypt | |
| Rest of Middle East & Africa |
| By Vehicle Type | Cargo Van | |
| Passenger Van | ||
| Minivan | ||
| Panel Van | ||
| By Tonnage Capacity | Up to 2 Tons | |
| 2-3 Tons | ||
| 3-5.5 Tons | ||
| By Propulsion Type | Internal Combustion Engine (ICE) | |
| Hybrid | ||
| Plug-in Hybrid | ||
| Battery Electric | ||
| By End-Use | Commercial | |
| Personal | ||
| By Geography | North America | United States |
| Canada | ||
| Rest of North America | ||
| South America | Brazil | |
| Argentina | ||
| Rest of South America | ||
| Europe | Germany | |
| United Kingdom | ||
| France | ||
| Italy | ||
| Spain | ||
| Russia | ||
| Rest of Europe | ||
| Asia-Pacific | China | |
| Japan | ||
| India | ||
| South Korea | ||
| Australia | ||
| Rest of Asia-Pacific | ||
| Middle East & Africa | Saudi Arabia | |
| United Arab Emirates | ||
| Turkey | ||
| South Africa | ||
| Egypt | ||
| Rest of Middle East & Africa | ||


Key Questions Answered in the Report
What is the current global value of the van market?
The van market size is USD 163.29 billion in 2025 and is projected to reach USD 203.10 billion by 2030.
How fast is the battery electric van segment growing?
Battery electric vans are forecast to expand at a 10.92% CAGR between 2025 and 2030, the highest among propulsion types.
Which region is expected to grow the quickest?
Asia-Pacific leads future growth with an 8.71% CAGR through 2030, propelled by Chinese production scale and ASEAN incentives.
What is the main barrier to electric van adoption?
High upfront costs, 25–40% above diesel equivalents, remain the biggest obstacle even though lifetime running costs favor electrics.
Which vehicle type dominates commercial demand?
Cargo vans currently command 39.22% of global van market share because of their versatility across logistics applications.
Page last updated on:


