Electric SUV Market Size and Share
Market Overview
| Study Period | 2019 - 2030 |
|---|---|
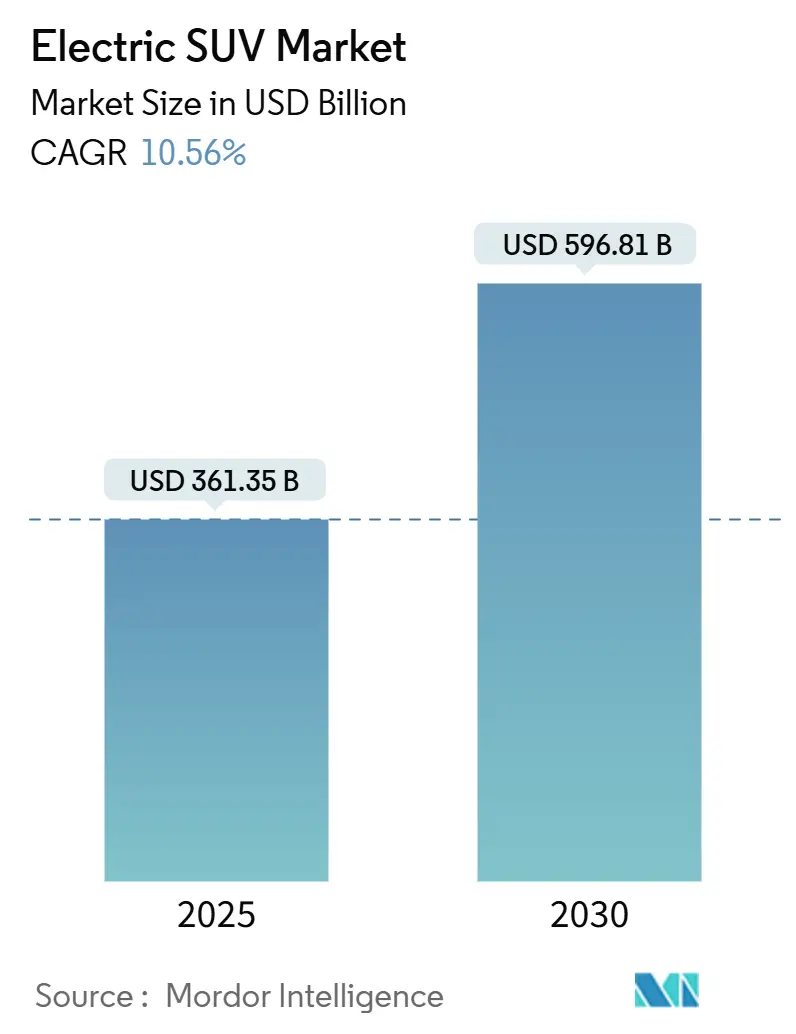
| Market Size (2025) | USD 361.35 Billion |
| Market Size (2030) | USD 596.81 Billion |
| Growth Rate (2025 - 2030) | 10.56% CAGR |
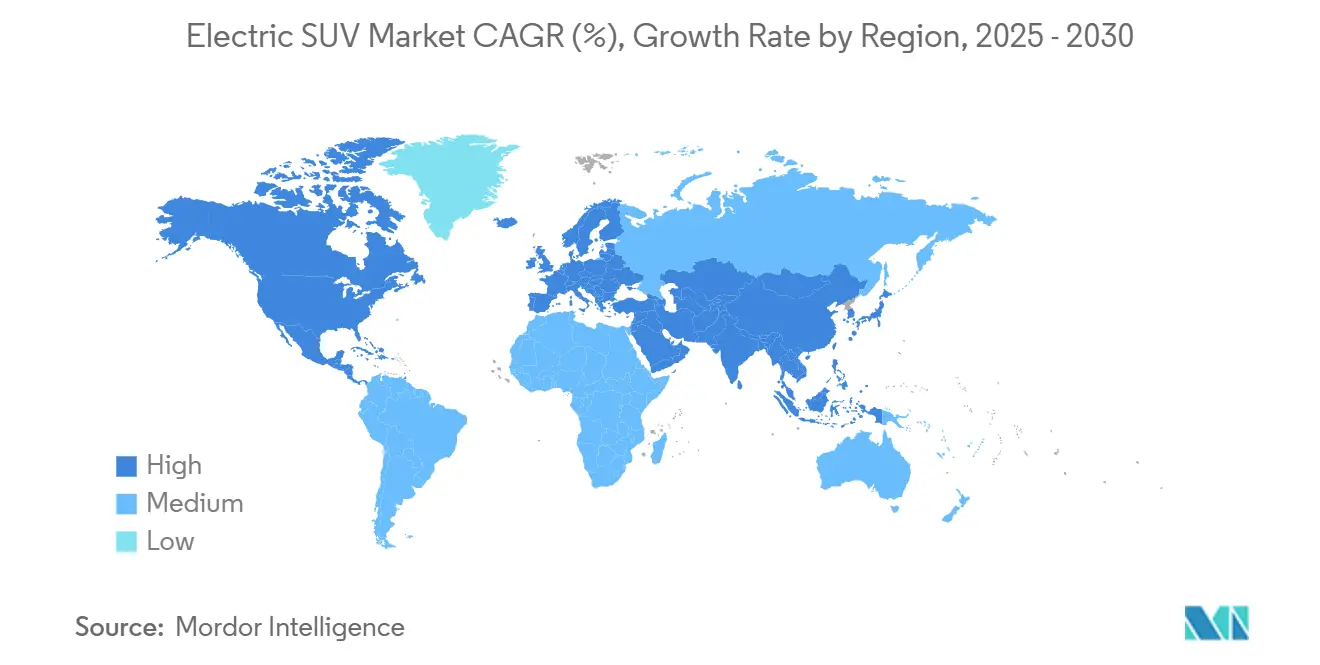
| Fastest Growing Market | Asia Pacific |
| Largest Market | Asia Pacific |
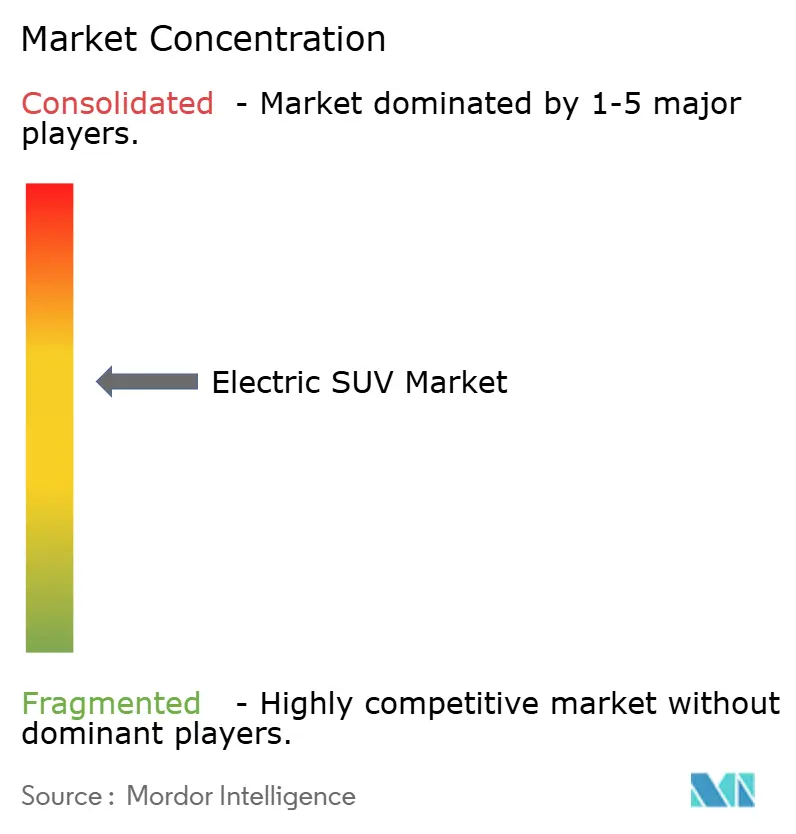
| Market Concentration | Medium |
Major Players *Disclaimer: Major Players sorted in no particular order Image © Mordor Intelligence. Reuse requires attribution under CC BY 4.0. | |
Electric SUV Market Analysis by Mordor Intelligence
The Electric SUV market size stood at USD 361.35 billion in 2025 before climbing to USD 596.81 billion by 2030, reflecting a 10.56% CAGR over 2025-2030. Cost-down momentum in lithium-ion batteries, which fell 20% to USD 115 /kWh in 2024, pushes upfront parity with gasoline SUVs and reinforces fleet buyers’ confidence. Chinese producers unlocked significant structural cost advantages through vertically integrated supply chains, enabling rapid multi-size product roll-outs that heighten competitive pressure on Western brands. Corporate electrification mandates, tighter CO₂ rules for sport-utility fleets, and continuous DC fast-charger build-outs amplify demand tailwinds, while critical-minerals bottlenecks, rural charging gaps, and residual-value uncertainty temper the pace.
Key Report Takeaways
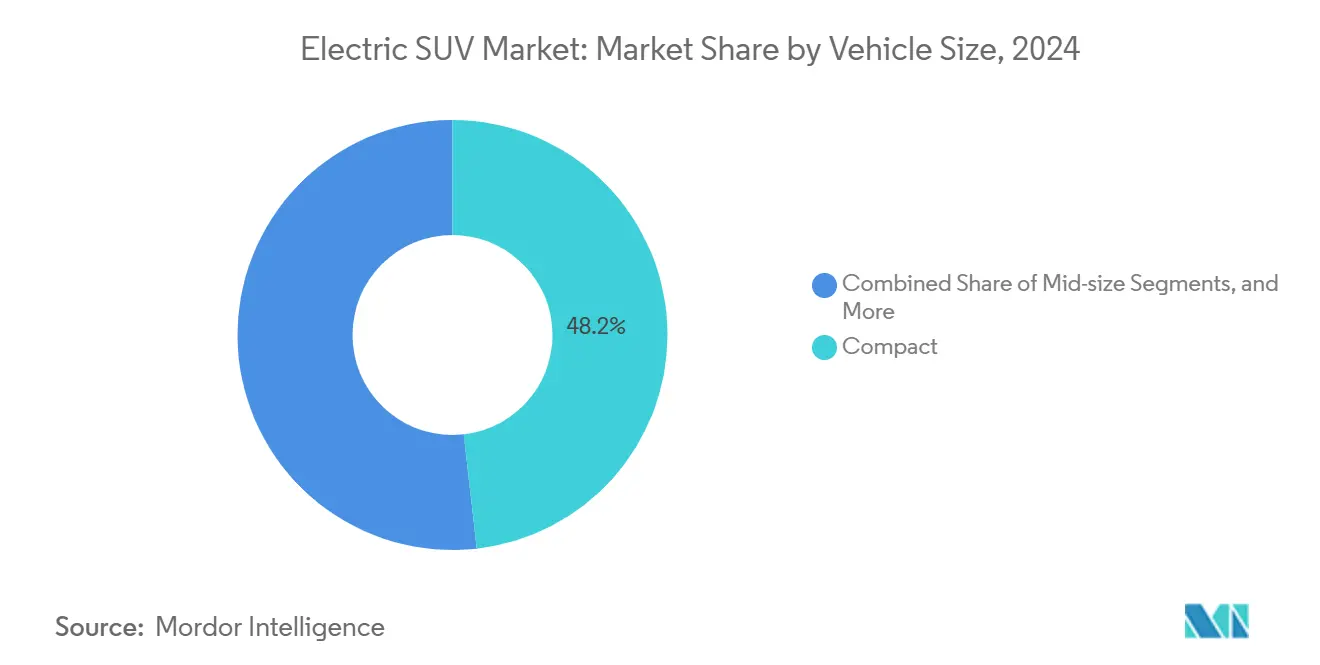
- By vehicle size, Compact SUVs commanded 48.15% share of the Electric SUV market size in 2024; Full-size variants are advancing at 11.56% CAGR through 2030.
- By propulsion type, BEV held 72.33% of the Electric SUV market share in 2024; FCEV is projected to expand at a 13.17% CAGR to 2030.
- By drivetrain, AWD captured 44.16% share of the Electric SUV market size in 2024 and is moving at 10.85% CAGR through 2030.
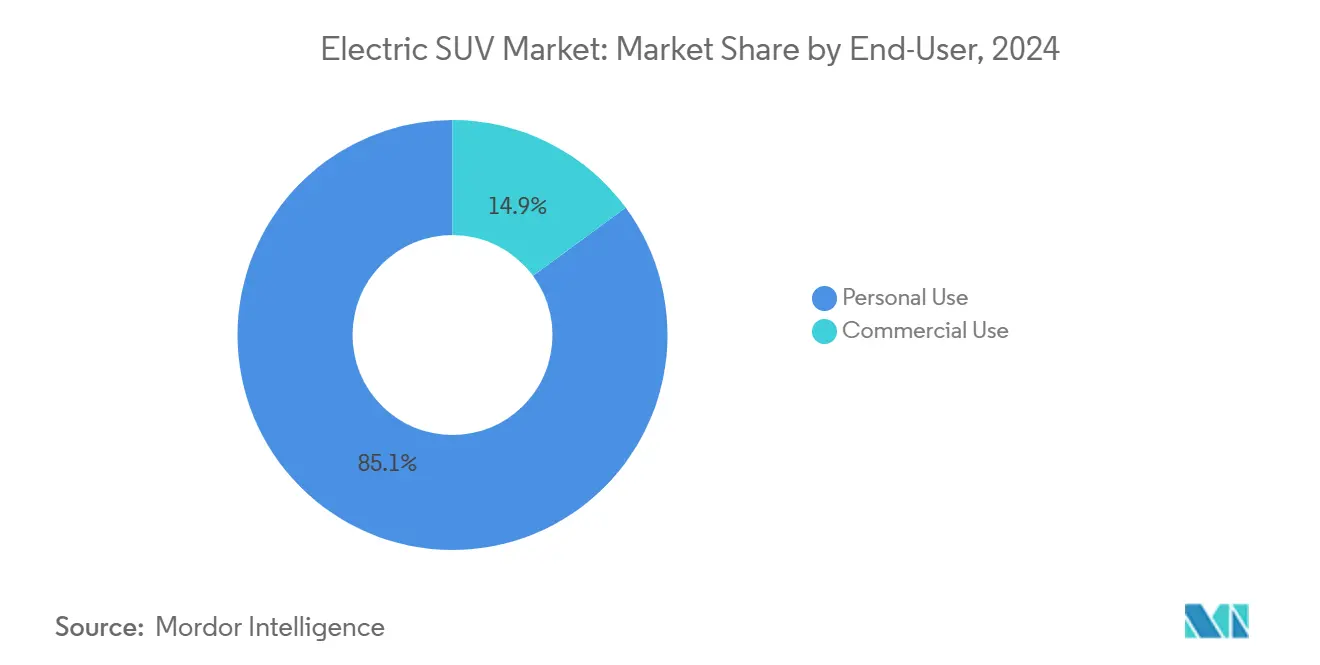
- By end-user, personal applications accounted for 85.11% of the Electric SUV market size in 2024, while commercial demand is growing at a 12.14% CAGR to 2030.
- By seating capacity, the 5-seater models captured 76.21% share of the Electric SUV market size in 2024, while the 7-seater models are moving at 12.78% CAGR through 2030.
- By geography, Asia-Pacific led with 54.28% Electric SUV market share in 2024; it is forecast to grow at 11.13% CAGR through 2030.
Global Electric SUV Market Trends and Insights
Drivers Impact Analysis*
| Driver | (~) % Impact on CAGR Forecast | Geographic Relevance | Impact Timeline |
|---|---|---|---|
| Cheaper, Longer-Range Battery Chemistries | +2.8% | Global, strongest in Asia-Pacific and South America | Medium term (2-4 years) |
| Corporate Fleet Electrification Mandates | +2.1% | North America and EU, expanding to Asia-Pacific | Short term (≤ 2 years) |
| Tighter CO₂ and ZEV Targets | +1.9% | Europe core, United Kingdom, Canada, select United States regions | Medium term (2-4 years) |
| Rapid DC Fast-Charging Corridor Build-out | +1.7% | North America and EU, APAC acceleration | Long term (≥ 4 years) |
| Chinese e-SUV Export Wave | +1.4% | South America, Middle East and Africa, Southeast Asia | Short term (≤ 2 years) |
| Dedicated Skateboard Platform for SUVs | +1.2% | Global, led by North America and China | Medium term (2-4 years) |
| Source: Mordor Intelligence | |||
Falling Battery Prices and Longer-Range Chemistries
Lithium-ion pack prices slid to USD 115 /kWh in 2024 and are nearing the USD 100 tipping point at which large-format SUVs can match gasoline sticker prices without subsidies. Mid-decade pilots of solid-state and high-nickel chemistries promise 50% mass cuts and double the energy density, easing weight penalties that previously limited full-size SUV adoption. CATL’s 1,000-km “Qilin” pack and Tesla’s cost-optimized 4680 cells highlight how chemistry advances are expanding range envelopes while shaving 14% pack-level costs [1]Tesla, “4680 Battery Cell Update,” tesla.com. Automakers are now fitting lower-cost LFP cells into mainstream five-seater trims, slicing sticker prices significantly yet still delivering 300-mile real-world range. The cumulative effect cushions OEM margins and accelerates e-SUV market uptake among price-sensitive households.
Corporate Fleet Electrification Mandates Accelerate SUV Orders
Lease companies have noted a significant uptick in requests for quotes (RFQs) for electric SUVs in 2024, driven by a four-year breakeven point in total cost of ownership. This trend reflects the growing preference for SUVs in executive transport and high-roof delivery van derivatives, as businesses increasingly prioritize sustainability and cost efficiency. The surge in institutional volumes bolsters predictable residuals and facilitates the expansion of charging depots, which are critical for supporting the scaling of electric vehicle adoption. These developments highlight the evolving dynamics of the e-SUV market and its role in shaping the future of fleet management.
Tighter Global CO₂ and ZEV Fleet-Average Targets for SUVs
The EU’s 95 g/km cap, effective 2025, exposes automakers to EUR 95 per gram penalties, virtually obliging high-volume SUV sellers to balance fleets with zero-emission variants [2]European Commission, “Regulation (EU) 2019/631 CO₂ Emission Performance Standards,” europa.eu. California’s ACC II pushes 35% ZEV share by 2026, while China’s dual-credit policy assigns higher weighting to heavier SUVs, intensifying pressure to electrify. Manufacturers boasting strong portfolios in the e-SUV market, such as Tesla, find themselves better shielded from fines, leading to a noticeable competitive edge. This advantage arises from their ability to meet stringent regulatory requirements, which are increasingly critical in the global automotive industry. Furthermore, this regulatory imbalance extends its reach into Canada and the United Kingdom, where similar policies are being implemented to encourage the adoption of electric vehicles and reduce carbon emissions. As a result, manufacturers with weaker portfolios may face higher compliance costs, further widening the competitive gap in these regions.
Rapid Build-Out of Highway DC Fast-Charging Corridors
Global DC fast-charger counts surged 40% to 2.1 million in 2024, and the U.S. NEVI program earmarked USD 7.5 billion to reach 500,000 public chargers by 2030 [3]U.S. Department of Energy, “National Electric Vehicle Infrastructure Program Guidance,” energy.gov. Tesla’s decision to open its Supercharger network to other brands effectively tripled instant-access plugs for Electric SUV owners across North America and Europe. China achieved most highway coverage with new DC posts in 2024, cutting 300-mile recharge times to 25 minutes. The EU’s AFIR rule mandates 350 kW chargers every 60 km in the coming year, ensuring full-size SUVs can undertake holiday journeys without compromise.
Restraints Impact Analysis*
| Restraint | (~) % Impact on CAGR Forecast | Geographic Relevance | Impact Timeline |
|---|---|---|---|
| High Upfront Price Premium for E-SUVs | −1.8% | Global, strongest in emerging markets | Short term (≤ 2 years) |
| Sparse Rural Charging Infrastructure | −1.4% | North America rural, EU periphery, developing Asia-Pacific | Long term (≥ 4 years) |
| Critical-Minerals ESG Pushback Delays Battery Projects | −1.1% | Global supply chains | Medium term (2-4 years) |
| Residual-Value Uncertainty Curbs Fleet Leasing | −0.9% | North America and EU commercial fleets | Medium term (2-4 years) |
| Source: Mordor Intelligence | |||
High Upfront Price Premium Versus ICE SUV Equivalents
Despite declining battery costs, electric vehicles (EVs) carry hefty premiums. Take the Ford F-150 Lightning, for instance: it kicks off at USD 49,995, while its gasoline counterpart starts at a more modest USD 37,970. Buyers are extending their financing terms to 72 months to achieve comparable monthly payments. Additionally, with rising lease penetration, consumers want to mitigate depreciation risks. In Germany, subsidy claw-backs and income-capped credits in the United States are tightening discounts, leaving some mainstream buyers hesitant. As original equipment manufacturers (OEMs) prioritize margin retention amidst constrained supply, it suggests that a full price parity for EVs within the e-SUV market might remain elusive until 2027.
Sparse Rural Charging Infrastructure
The United States rural counties average 2.3 chargers per 1,000 sq miles compared with 45.7 in urban zones, a gulf that amplifies range anxiety among agricultural and recreational SUV users. European periphery markets lag metro regions by 5-7 years, and installation costs in rural properties can be 3-4 times higher due to grid upgrades. The gap limits the Electric SUV market uptake outside metropolitan corridors and keeps ICE SUVs entrenched among countryside buyers.
*Our forecasts treat driver/restraint impacts as directional, not additive. The impact forecasts reflect baseline growth, mix effects, and variable interactions.
Segment Analysis
By Vehicle Size: Compact Dominance Faces Full-Size Acceleration
Compact models led 2024 deliveries with a 48.15% slice of the Electric SUV market share, anchored by Tesla Model Y and BYD Yuan Plus' success in dense cities. Full-size entries, however, record the sharpest 11.56% CAGR to 2030 as BMW, Mercedes-Benz, and Cadillac unleash long-range flagships meeting luxury buyer expectations. Mid-size offerings remain stable, striking a balance between urban maneuverability and family utility.
The compact lead reflects parking constraints and infrastructure concentration in Europe and urban China, while full-size gains show rising faith in 400-mile packs for road-trip practicality. Ford’s Lightning and upcoming Escalade IQ exemplify how towing and cargo demands are now addressable in zero-emission guise. Regional splits stay pronounced: compacts dominate Europe and Japan, whereas U.S. demand tilts toward roomier trims.


By Propulsion Type: BEV Leadership Amid FCEV Emergence
Battery Electric Vehicles (BEVs) secured 72.33% of the Electric SUV market share in 2024, as robust charging ecosystems and falling pack costs cemented buyer confidence. Fuel-cell Electric Vehicle (FCEVs) post a 13.17% CAGR outlook, catalyzed by Hyundai Nexo launches and German-Korean hydrogen corridor projects. Hybrid and plug-in hybrid niches persist as bridge technologies.
Market preference tracks infrastructure. California, Norway, and Shanghai propel BEV dominance, whereas Japan, South Korea, and parts of Germany foster FCEV pilots for logistics and long-haul taxis. Commercial fleets weigh BEV for predictable routes but keep hydrogen on radar for uptime-critical operations.
By Drivetrain: AWD Dominance Reflects Performance Expectations
AWD held 44.16% of the Electric SUV market size in 2024, and is on course for a 10.85% CAGR through 2030 as dual- and quad-motor layouts deliver instant torque vectoring. Rivian’s quad-motor R1S and Tesla’s dual-motor Model Y demonstrate traction gains without mechanical complexity. Two-wheel drive trims serve value shoppers and warm-climate use cases.
Increasing snowfall variability and consumer performance expectations make AWD almost default in premium segments. OEMs can add a second motor for USD 1,500 versus multi-thousand transfer cases in ICE SUVs, shrinking cost differentials and tightening margins between 2WD and AWD SKUs.
By End-User: Personal Dominance Amid Commercial Acceleration
Personal customers generated an 85.11% share of the electric SUV market in 2024 as households embraced home-charging convenience for daily errands. Commercial demand, however, rises 12.14% annually as delivery firms and corporate car pools exploit lower maintenance and fuel bills. Incentives such as preferential downtown access for electric vehicles amplify corporate adoption momentum.
Fleet scale deepens charging infrastructure, looping back positive externalities to personal users. As residual-value clarity improves, leasing and subscription models could boost commercial penetration beyond current projections.
By Seating Capacity: 5-Seater Practicality Versus 7-Seater Growth
Five-seat layouts cornered 76.21% share of the electric SUV market in 2024, prized for optimal range-to-space ratios in urban households. Seven-seater entries expand at 12.78% CAGR through 2030, reflecting larger families’ shift from minivans to zero-emission SUVs; BMW iX and Mercedes EQS SUV headline premium options.
Engineering complexities around battery packaging in three-row cabins are easing thanks to flat-pack architectures and improved energy density. OEMs now deploy 120 kWh packs delivering 350-mile seven-seat range, mitigating earlier compromise fears.
Geography Analysis
Asia-Pacific retained its commanding 54.28% Electric SUV market share in 2024 and continues as the fastest-growing region at 11.13% CAGR through 2030, led by China’s high production and vertically integrated value chain advantages. Subsidies that trimmed 2024 average selling prices and South Korea’s battery leadership and India’s PLI-backed capacity build-outs sustain the region’s cost edge. North America also holds a significant potential, as the Inflation Reduction Act content rules, with Ford, General Motors, and Tesla scaling gigafactories to qualify for incentives. State-level rebates in California and New York deepen affordability, while Canada’s ZEV quota of 20% by 2026 reinforces the regional policy pull.
Europe maintains regulatory leadership yet faces rising Chinese import pressure; the EU’s 95 g/km fleet-average CO₂ cap, effective 2025, makes Electric SUV sales pivotal for compliance. South America is emerging as a strategic growth pod where BYD and SAIC leverage local assembly to retail models at USD 25,000-35,000—USD 15,000-20,000 below Western rivals—rapidly expanding the Electric SUV market size in Brazil and neighboring economies.
The Middle East and Africa trail in absolute units yet present long-run upside: the United Arab Emirates targets 50% electric adoption by 2050 through free charging and duty exemptions, while Saudi Arabia’s NEOM project envisions a fully electric transport ecosystem. South Africa’s mineral resources offer reciprocal supply-chain prospects, though grid reliability and upfront affordability still restrain uptake. Government diversification agendas and renewable energy investments are expected to narrow these gaps, positioning the region for accelerated penetration as infrastructure densifies.

Competitive Landscape
Competitive intensity is climbing even as the Electric SUV market stays moderately concentrated. Tesla leads through vertically integrated battery engineering and the Supercharger network. Legacy OEMs pivot via alliances. Volkswagen’s and Rivian's investment typifies moves to acquire software-defined vehicle expertise without starting from scratch.
Strategically, the field bifurcates between cost-optimized volume players and premium tech leaders utilizing software, over-the-air updates, and ADAS bundling. Chinese exporters chase emerging-market share with aggressive MSRPs, while European luxury brands position on craftsmanship and brand heritage. Supply-chain sustainability is becoming a differentiator as regulators eye cradle-to-grave carbon audits, pushing OEMs toward closed-loop battery recycling partnerships and verified ethical sourcing.
Start-ups such as Rivian and Lucid target lifestyle segments with quad-motor torque and luxury cabin tech that legacy players struggle to emulate quickly. Yet capital intensity and production ramp execution risk remain formidable barriers, evidenced by delayed volume ramps and rising cost of capital. Market exits or consolidation episodes could surface if funding windows tighten before breakeven.
Electric SUV Industry Leaders
Tesla, Inc.
Volkswagen AG
Hyundai Motor Group
BYD Auto Co. Ltd.
SAIC Motor Corp., Ltd.
- *Disclaimer: Major Players sorted in no particular order

Recent Industry Developments
- September 2025: Changan unveiled the Deepal S07, marking its debut in the all-electric SUV segment for the UK market. The SUV, powered by a 160-kW electric motor, boasts a range of up to 295 miles.
- August 2025: Li Auto launched its i8 electric SUV in China. The new model, equipped with a dual-chamber air suspension and a powerful 400kW dual-motor drivetrain, the i8 boasts an impressive range of up to 720 km on the CLTC scale, firmly establishing itself as a premium contender in China's bustling EV landscape.
- June 2025: Xpeng introduced the G7 electric SUV in China, available in the Max and Ultra trim levels. Both trims are equipped with rear-wheel drive, powered by a 218 kW motor, and feature an LFP battery offered in 68.5 kWh and 80.8 kWh capacities.


Global Electric SUV Market Report Scope
| Compact |
| Mid-size |
| Full-size |
| Battery Electric Vehicle (BEV) |
| Fuel-cell Electric Vehicle (FCEV) |
| Hybrid Electric Vehicle (HEV) |
| Plug-in Hybrid Electric Vehicle (PHEV) |
| 2WD |
| 4WD |
| AWD |
| Personal Use |
| Commercial Use |
| 5-Seater |
| 7-Seater |
| North America | United States |
| Canada | |
| Rest of North America | |
| South America | Brazil |
| Argentina | |
| Rest of South America | |
| Europe | United Kingdom |
| Germany | |
| Spain | |
| Italy | |
| France | |
| Russia | |
| Rest of Europe | |
| Asia-Pacific | India |
| China | |
| Japan | |
| South Korea | |
| Rest of Asia-Pacific | |
| Middle East and Africa | United Arab Emirates |
| Saudi Arabia | |
| Turkey | |
| Egypt | |
| South Africa | |
| Rest of Middle East and Africa |
| By Vehicle Size | Compact | |
| Mid-size | ||
| Full-size | ||
| By Propulsion Type | Battery Electric Vehicle (BEV) | |
| Fuel-cell Electric Vehicle (FCEV) | ||
| Hybrid Electric Vehicle (HEV) | ||
| Plug-in Hybrid Electric Vehicle (PHEV) | ||
| By Drivetrain | 2WD | |
| 4WD | ||
| AWD | ||
| By End-User | Personal Use | |
| Commercial Use | ||
| By Seating Capacity | 5-Seater | |
| 7-Seater | ||
| By Geography | North America | United States |
| Canada | ||
| Rest of North America | ||
| South America | Brazil | |
| Argentina | ||
| Rest of South America | ||
| Europe | United Kingdom | |
| Germany | ||
| Spain | ||
| Italy | ||
| France | ||
| Russia | ||
| Rest of Europe | ||
| Asia-Pacific | India | |
| China | ||
| Japan | ||
| South Korea | ||
| Rest of Asia-Pacific | ||
| Middle East and Africa | United Arab Emirates | |
| Saudi Arabia | ||
| Turkey | ||
| Egypt | ||
| South Africa | ||
| Rest of Middle East and Africa | ||


Key Questions Answered in the Report
What is the 2025 forecast for global Electric SUV sales value?
The Electric SUV market size is projected to reach USD 361.35 billion in 2025 based on the current growth trajectory.
Which region leads adoption?
Asia-Pacific held 54.28% share in 2024 and remains the fastest-growing geography through 2030, driven by China’s output scale and cost advantages.
Which segment shows the highest growth?
Full-size Electric SUVs register the fastest 11.56% CAGR to 2030 as luxury buyers demand long-range, high-capability models.
How fast are battery costs falling?
Pack prices dropped 20% in 2024 to USD 115 /kWh, and further chemistry advances are steering toward the USD 100 /kWh parity point.
Page last updated on:


