Market Overview
| Study Period | 2019 - 2031 |
|---|---|
| Market Size (2026) | USD 19.31 Billion |
| Market Size (2031) | USD 72.11 Billion |
| Growth Rate (2026 - 2031) | 30.15% CAGR |
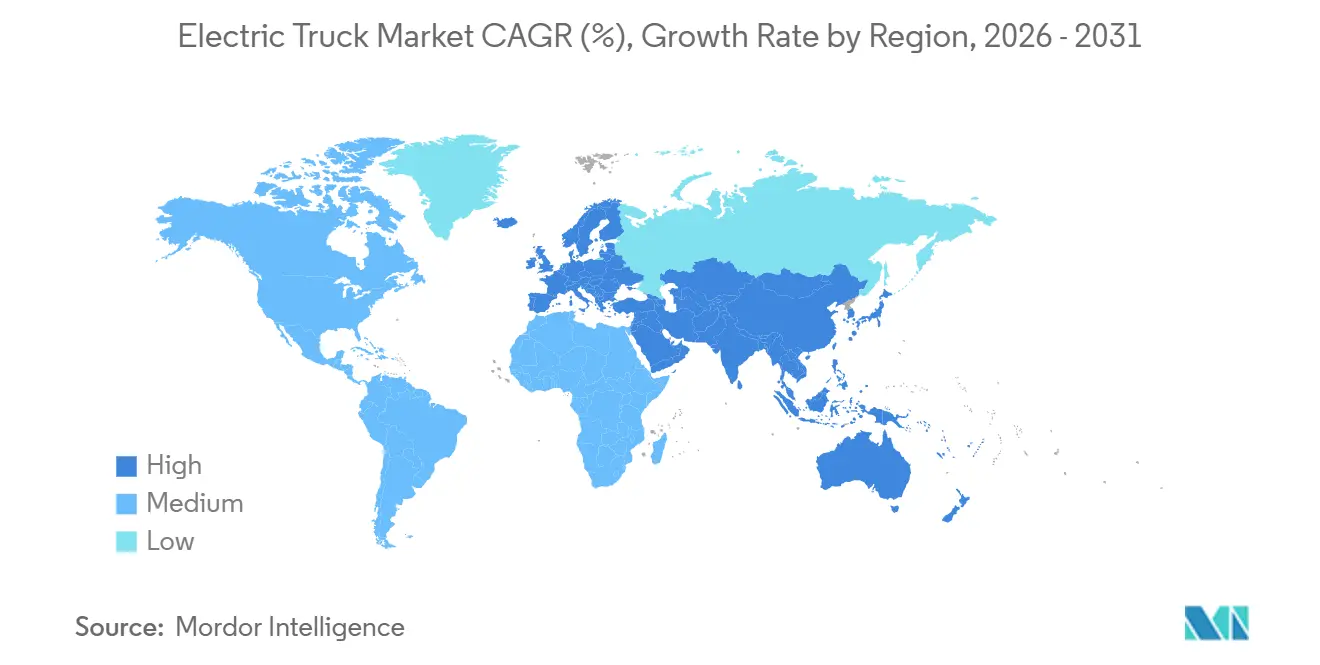
| Fastest Growing Market | Middle East and Africa |
| Largest Market | Europe |
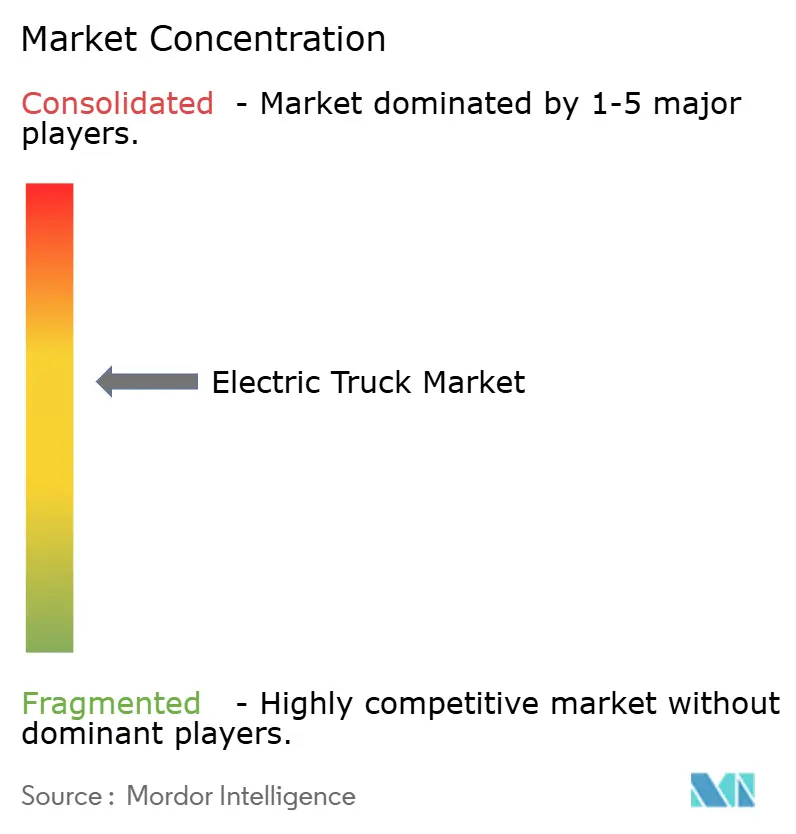
| Market Concentration | Medium |
Major Players*Disclaimer: Major Players sorted in no particular order Image © Mordor Intelligence. Reuse requires attribution under CC BY 4.0. | |

Electric Truck Market Analysis by Mordor Intelligence
The Electric Truck Market size is estimated at USD 19.31 billion in 2026, and is expected to reach USD 72.11 billion by 2031, at a CAGR of 30.15% during the forecast period (2026-2031). As global emissions policies tighten and major corporations commit to ambitious Scope 3 targets, zero-emission trucks are rapidly outpacing their diesel counterparts in adoption. In 2024, lithium-ion battery pack prices experienced a significant decline, making it more cost-effective for many urban duty cycles to recover their total cost of ownership within a shorter timeframe. At the same time, the U.S. EPA's Phase 3 rule and the EU's CO₂ regulations are aligning, pushing original equipment manufacturers to ramp up production of both battery-electric and fuel-cell platforms. Fleet operators are now vying for premium "green-freight" contracts, commanding higher rates than traditional diesel contracts. This shift bolsters their return profiles, even in areas without direct purchase incentives. Meanwhile, strategic opportunities are emerging around megawatt-class charging depots and inductive highway lanes, which offer dynamic power transfer capabilities. These innovations are pivotal in alleviating range anxiety for regional haul operators.
Key Report Takeaways
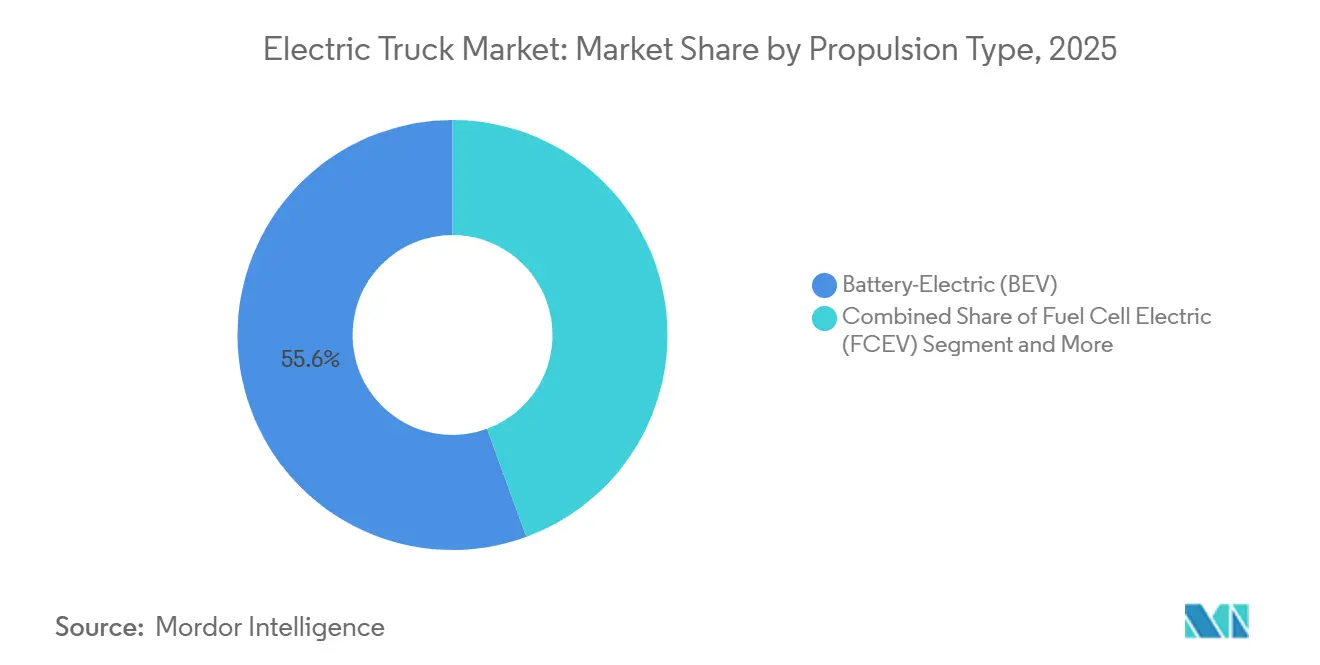
- By propulsion type, battery-electric trucks led with 55.61% of the electric truck market share in 2025, while fuel-cell electric trucks are forecast to post the fastest 30.17% CAGR through 2031.
- By truck type, heavy-duty models above 12 tonnes accounted for 43.47% of revenue in 2025 in the electric truck market and are projected to sustain a 30.19% CAGR out to 2031.
- By application, logistics and parcel delivery dominated at 46.73% share in 2025 in the electric truck market; construction and mining are set to expand at a 30.35% CAGR on the back of site-electrification grants.
- By range, the 150–300 km segment led at 44.37% in 2025 in the electric truck market, whereas trucks exceeding 500 km are expected to rise at a 30.21% CAGR as megawatt charging proliferates.
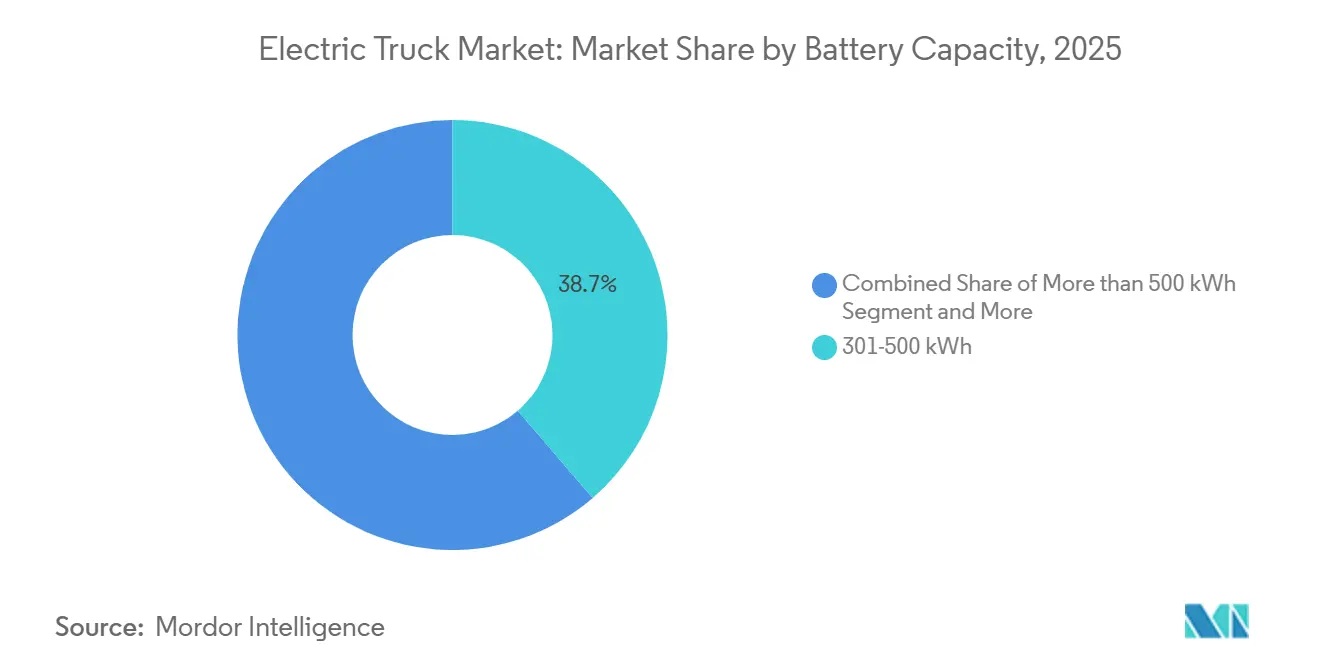
- By battery capacity, 301–500 kWh packs captured 38.71% of demand in 2025 in the electric truck market; systems above 500 kWh will advance at a 30.25% CAGR spurred by long-haul requirements.
- By motor architecture, dual-motor layouts held 42.38% share in 2025 in the electric truck market, yet tri- and quad-motor designs will grow at a 30.31% CAGR because of torque-vectoring advantages for off-road fleets.
- By region, Europe led with 36.77% of the electric truck market share in 2025, while the Middle East and Africa is projected to expand at a 30.23% CAGR through 2031.
Note: Market size and forecast figures in this report are generated using Mordor Intelligence’s proprietary estimation framework, updated with the latest available data and insights as of January 2026.
Global Electric Truck Market Trends and Insights
Drivers Impact Analysis*
| Driver | (~) % Impact on CAGR Forecast | Geographic Relevance | Impact Timeline |
|---|---|---|---|
| Battery-pack price declines | +8.2% | Global, with early gains in China, Europe, North America | Medium term (2-4 years) |
| Tightening CO₂ & NOₓ emission mandates | +7.5% | Europe, North America, China | Long term (≥4 years) |
| Corporate fleet-decarbonization pledges | +6.1% | Global, concentrated in North America and Europe | Medium term (2-4 years) |
| Growing green-freight contract premiums from shippers | +4.8% | North America, Europe, Asia Pacific core | Short term (≤2 years) |
| Dynamic wireless charging pilots | +3.0% | North America, Europe, with pilots in Israel, Sweden | Medium term (2-4 years) |
| Expanded mining-site electrification grants | +2.3% | South America, concentrated in Chile, Brazil, Peru | Short term (≤2 years) |
| Source: Mordor Intelligence | |||


Battery-Pack Price Declines Below USD 100/kWh Threshold
In recent years, lithium-ion pack prices have significantly decreased in the electric truck market and are expected to continue declining, reaching cost parity with diesel tractors in the near future.[1]“CATL Introduces 190 Wh/kg LFP Cell,” Contemporary Amperex Technology Co. Limited, catl.com Chinese cell manufacturers have driven this reduction, achieving notable advancements in energy density with high-volume LFP chemistries. Fleet operators are now experiencing faster payback periods on medium-duty urban routes, significantly shortening replacement cycles that were historically much longer. Recently, PepsiCo’s operations in California reported substantially lower energy costs per mile for its Tesla Semi fleet compared to diesel Class 8 tractors. Additionally, LFP has captured a significant share of new electric truck battery capacity, demonstrating improved cycle life and reduced lifetime capital intensity.
Tightening CO₂ & NOₓ Emission Mandates for Heavy Vehicles
Starting in the late 2020s, the European Union's Euro 7 limits will significantly reduce heavy-duty NOₓ emissions in the electric truck market. Additionally, the EU mandates a substantial reduction in fleet-wide CO₂ emissions by mid-century [2]“Fit for 55: CO₂ Standards for Heavy-Duty Vehicles,” European Commission, europa.eu . In the U.S., the EPA's Phase 3 rule requires OEMs to ensure a significant portion of new Class 8 sales are zero-emission within the next decade. Non-compliance comes with a hefty financial penalty per tractor. Meanwhile, in China, the National VI-b standards will apply to all trucks over a specific weight threshold starting in the near future [3]“Final Rule: Greenhouse Gas Emissions Standards for Heavy-Duty Vehicles—Phase 3,” U.S. Environmental Protection Agency, epa.gov . Furthermore, a stringent limit on urban freight CO₂ emissions is set for the end of the decade. In a proactive move, Volvo Group reported selling a notable percentage of its trucks as zero-emission in Europe during the current year, as fleets rushed to meet the Euro 7 deadline. Adding to the regulatory landscape, mandatory Scope 3 reporting under ISO 14083 tightens the grip of regulations on corporate procurement decisions.
Corporate Fleet-Decarbonization Pledges (Scope 3 Focus)
In a significant move towards sustainability, the Science Based Targets initiative has validated Scope 3 emissions reduction goals for numerous transport companies in the electric truck market, aiming for a substantial cut by the end of the decade. FedEx, with an eye on the future, has committed a significant investment to transition its entire parcel fleet to electric within the next two decades. Not to be outdone, Schneider National has allocated a considerable budget, targeting a large number of zero-emission tractors and yard trucks within the same timeframe. In a testament to the viability of electric transport, PepsiCo, operating a fleet of Tesla Semis in multiple U.S. states, boasts a notable reduction in operating costs per mile compared to diesel units, a figure projected for the near future. Meanwhile, retail giant Walmart is pushing its dedicated carriers to transition a significant portion of U.S. fleets to zero-emission by the end of the decade, making electric propulsion a non-negotiable condition for contract renewals.
Growing Green-Freight Contract Premiums from Shippers
McKinsey projects that by the end of the decade, demand for green freight could grow significantly in the electric truck market, with premiums generally higher than traditional diesel transport. Unilever has committed to a notable surcharge on European road-freight contracts, but only for those executed by zero-emission trucks, and has locked this in for a multi-year period. In a significant move, Amazon’s Climate Pledge Fund invested a substantial amount into Rivian recently, ensuring priority access to a large fleet of electric delivery vans over the next several years. Meanwhile, DHL Express has made a bold pledge: within the same timeframe, a majority of its linehaul capacity will come from electric-truck operators, backed by long-term inflation-indexed contracts. Due to these premiums, the payback period for heavy-duty electric trucks is significantly reduced, especially when factoring in lower fuel and maintenance costs.
Restraints Impact Analysis*
| Restraint | (~) % Impact on CAGR Forecast | Geographic Relevance | Impact Timeline |
|---|---|---|---|
| Sparse megawatt-class charging infrastructure | -5.3% | Global, acute in North America, South America, MEA | Medium term (2-4 years) |
| High up-front vehicle cost vs. diesel in emerging markets | -4.2% | South America, MEA, South Asia | Short term (≤2 years) |
| Grid-connection delays at large depot sites | -3.8% | Global, acute in United Kingdom, Germany, North America | Medium term (2-4 years) |
| Nickel & manganese supply-chain volatility | -2.7% | Global, with acute impact in battery manufacturing hubs | Short term (≤2 years) |
| Source: Mordor Intelligence | |||
Sparse Megawatt-Class Charging Infrastructure
By early 2026, only a limited number of Megawatt Charging System (MCS) stations were operational globally in the electric truck market, lagging significantly behind the rollout of vehicles. The Daimler-Volvo joint venture plans to establish a significant number of high-performance charging points by 2027, but this will only service a small portion of the primary freight corridors. In the U.S., while federal NEVI funds allocated substantial financial resources, only a few charging sites became operational by December 2025, hindered by permitting delays. Additionally, interconnections at depots are causing further setbacks; National Grid ESO has indicated extensive wait times for connections at major logistics centers in the U.K. As a result, fleets are overspecifying their battery packs, significantly increasing unit costs.
High Up-Front Vehicle Cost vs. Diesel in Emerging Markets
In the absence of subsidies or concessional lending, significant price premiums remain prevalent. In early 2025, Brazil reintroduced the IPI tax on electric trucks, leading to a notable increase in list prices and extending the average fleet age. India's FAME II grants expired in early 2024, resulting in electric tractors being priced substantially higher than their diesel counterparts. In its 2025 budget, South Africa introduced an import duty on packs, discouraging procurement among regional carriers. Consequently, operators in these regions are turning to used diesel imports, hindering the short-term growth of the electric truck market.
*Our forecasts treat driver/restraint impacts as directional, not additive. The impact forecasts reflect baseline growth, mix effects, and variable interactions.
Segment Analysis
By Propulsion Type: Hydrogen Gains as Range Demands Rise
Battery-electric trucks commanded a 55.61% share in 2025, underpinned by maturing urban charging networks and dependable 250 km daily cycles. Fuel-cell platforms are set for a 30.17% CAGR through 2031 as the United States funds seven hydrogen hubs with 200 heavy-truck stations planned by 2030. In 2024, Nikola rolled out several Class 8 fuel-cell tractors, highlighting a burgeoning demand for vehicles capable of extended-range duties. Operators in regions with limited infrastructure are gravitating towards plug-in hybrids, which offer a diesel backup. Notably, Volvo’s FH Electric hybrid combines a moderate electric range with an additional diesel margin. While hydrogen prices in California remain significantly higher than diesel when adjusted for energy parity, declining electrolyzer costs hint at a potential substantial reduction by the end of the decade. The electric truck landscape is evolving, with batteries leading the charge in last-mile deliveries, while hydrogen is carving a niche in long-haul transport.
Secondary dynamics are bolstering hydrogen's rise. European transporters prioritize swift refueling to optimize driver hours, and looming CO₂ regulations threaten penalties for payload reductions due to hefty batteries. In a significant move, Daimler’s GenH2 fuel-cell prototype successfully completed an extensive pilot run in late 2025, addressing durability concerns. Concurrently, advancements in lithium-iron-phosphate technology are solidifying battery packs' dominance on high-volume routes with shorter distances, ensuring battery-electric vehicles remain pivotal in bustling urban settings.


By Truck Type: Heavy-Duty Leads in Share and Growth
Heavy-duty models above 12 tonnes represented 43.47% of revenue in 2025 in the electric truck market and will post a 30.19% CAGR through 2031 as California, New York, and the EU demand 40–50% zero-emission Class 8 sales by 2032. By late 2025, Daimler's eActros 600, equipped with a large-capacity LFP pack and boasting an extensive real-world range, garnered significant pre-orders. Platforms in the medium-duty range are securing municipal and urban freight contracts; in 2025, BYD made a mark in North America, delivering a substantial number of units and clinching city waste-collection tenders. Light trucks, benefiting from a cost edge in last-mile services, saw Rivian's EDV-700 achieve impressive uptime over an extensive distance. While the large-capacity batteries on long-haul tractors impose a noticeable reduction in capacity due to payload penalties, the trade-off is deemed acceptable as green-freight premiums compensate for the lost tonnage.
Industry players are eyeing vocational niches as the next frontier. Tipper bodies, utility chassis, and fire-service rigs are in the spotlight, due to their duty cycles syncing perfectly with depot charging. Meanwhile, tractor-trailer setups are pursuing megawatt charging innovations to minimize downtime. The pace of heavy-duty adoption is poised to dictate the trajectory of the electric truck market's expansion into other classes.
By Application: Construction and Mining Surge on Electrification Grants
Logistics and parcel services held 46.73% of demand in 2025 in the electric truck market, propelled by Amazon’s 10,000-unit Rivian fleet and UPS’s parallel 10,000-van Arrival order. Construction and mining will advance at a 30.35% CAGR to 2031 as grant programs proliferate. In 2024, Chile allocated significant funding for zero-emission haul trucks, while Codelco set an ambitious goal for substantial fleet electrification by the end of the decade. Brazil's Vale introduced several battery-electric haulers at Carajás, achieving notable cost reductions in operations. Municipal services are also making strides in electrification; Paris has mandated all refuse trucks to be zero-emission by the end of the decade, leading Renault to supply a considerable number of electric units in 2024.
Fleet economics are driving a shift in the sector. Mining operators are realizing meaningful fuel savings through regenerative braking on steep declines. Meanwhile, construction sites enjoy the benefits of reduced noise compliance demands. Logistics players are advancing to the next phase of procurement, focusing on regional linehaul tractors. This move is broadening the electric truck market's reach, extending beyond just last-mile deliveries.
By Range: Long-Range Segments Accelerate with Megawatt Charging
The 150–300 km segment held a 44.37% share in 2025 in the electric truck market, reflecting urban depot-based duty cycles. Segments above 500 km will surge at a 30.21% CAGR, buoyed by Tesla's Semi achieving an impressive long-range performance and recharging to a significant level in a short time at prototype high-capacity stations; the industry is taking note. The Daimler-Volvo joint network, eyeing the future, has ambitious plans for a substantial number of sites within the next few years. Their stations promise a quick top-up for large battery packs. Meanwhile, BYD's T7 truck, with a range suitable for short-distance operations, is strategically filling the niche for limited-range applications. With lower capital expenditure, it's becoming a favorite among small businesses. In a groundbreaking move, dynamic wireless pilots like Electreon's Detroit corridor have showcased a notable effective range boost using inductive power transfer.
As we approach the decade's end, the once-clear range hierarchy may start to blur. This shift is driven by the convergence of energy-dense chemistries and en-route charging. Operators, balancing battery degradation with dwell time, are likely to adopt a mix of pack sizes within unified fleets. This strategy not only addresses their operational needs but also supports the diverse growth vectors of the electric truck market.
By Battery Capacity: Megawatt-Hour Packs Gain Traction
Packs rated 301–500 kWh captured 38.71% share in 2025, balancing cost and 400 km reach. Systems above 500 kWh will track a 30.25% CAGR through 2031 as long-haul economics normalize around megawatt charging. Daimler's large LFP battery pack offers an extensive range and a long lifespan. In contrast, Tesla's NMC pack provides a greater range and supports rapid recharging within a short time frame. Meanwhile, urban vans like Rivian's EDV-700 utilize smaller battery packs, enabling them to efficiently cover moderate daily loops.
The dynamics of battery chemistry are ever-evolving. In the near future, LFP is expected to become more cost-effective, making large battery packs available at competitive price points. On the other hand, while NMC packs are more expensive for similar capacities, their higher density is advantageous for applications requiring weight efficiency. A comprehensive lifecycle total-cost analysis indicates that as advanced charging technologies become widespread, larger battery packs will gain favor, driving growth in the electric truck market, particularly in the long-haul segment.
By Motor Architecture: Multi-Motor Systems Enable Off-Road Performance
Dual-motor setups held 42.38% revenue share in 2025, furnishing balanced torque across axles and 8–12% regenerative efficiency gains. Tri- and quad-motor configurations will post a 30.31% CAGR, led by construction and mining fleets needing torque vectoring. Rivian's quad-motor commercial pickup, delivering high horsepower, successfully navigated steep grades during tests in pilot mines. Meanwhile, Volvo's FM Electric, equipped with a tri-motor variant, can handle challenging approach angles, positioning it as a prime choice for quarry operations. For cost-sensitive light trucks and vans, a single-motor architecture remains a practical option. While a multi-motor setup may slightly increase the sticker price, it offers significant savings through reduced tire wear on unpaved roads, leading to a relatively short payback period.
By shifting to independent-wheel control, traction algorithms and predictive maintenance have seen marked improvements. This not only bolsters competitiveness in off-road scenarios but also broadens the potential applications for electric trucks in the market.
Geography Analysis
In 2025, Europe held a significant share of the electric truck market with 36.77%, supported by the unified compliance signals of Euro 7 and the EU's CO₂ framework. By the end of the year, Germany, France, and the Netherlands had made substantial progress in installing high-power chargers, ensuring adequate coverage for models like the eActros 600 and FH Electric. Norway's policies, including toll exemptions and partial funding of purchase prices, significantly boosted the adoption of zero-emission trucks, which formed a notable portion of new registrations. In contrast, the U.K. faced challenges with depot electrification due to prolonged grid connection timelines, which slowed the transition for large fleets despite the availability of strong incentives.
Asia Pacific, driven by China's large-scale deployment of electric trucks under its regulatory framework and subsidy programs, is emerging as a strong competitor to Europe in terms of volume. Japan's substantial investment in hydrogen infrastructure supports Hino's fuel-cell development plans. Meanwhile, India's momentum slowed following the expiration of its subsidy program, as the cost of electric trucks remained significantly higher than diesel alternatives. In Australia, government initiatives funded the installation of depot chargers, facilitating pilot projects for interstate freight operations.
North America benefits from federal incentives and state-level regulations mandating a higher share of zero-emission truck sales in the coming years. Tesla's delivery of electric trucks to major corporations highlighted the cost advantages of these vehicles in terms of energy efficiency. Canada's financial incentives have also encouraged the deployment of electric trucks along key logistics routes. The Middle East and Africa logs the fastest 30.23% CAGR through 2031 in the electric truck market, driven by large-scale orders and ambitious government targets for zero-emission commercial fleets. South Africa is testing battery-powered trucks in mining operations, despite potential challenges from proposed import duties. In South America, policy differences are shaping the market: Brazil's tax policies have increased vehicle prices, while Chile's funding for mining fleets is accelerating adoption in the region.

Competitive Landscape
In recent years, Daimler Truck, Volvo Group, PACCAR, and Scania have dominated a significant share of battery-electric unit sales in Europe and North America, leveraging their established dealer networks and captive finance arms. Meanwhile, Tesla, Nikola, and Rivian are pushing for vertical integration, aiming to reduce pack costs and harness insights from charging data. In a strategic move, Daimler and Volvo formed a joint venture to install a substantial number of megawatt chargers within a few years, laying the groundwork for a proprietary ecosystem ahead of potential third-party competitors. Electreon's pilot in Detroit demonstrated continuous power transfer capabilities, hinting at the future of dynamic-charging business models.
Recently, Chinese players BYD and Foton have made significant inroads in North America, introducing a notable volume of trucks and offering competitive pricing through their integrated battery supply chains. The race for technological edge focuses on pack chemistry and thermal management, with numerous patents granted in the United States covering battery cooling, megawatt connectors, and regenerative algorithms. Smaller firms like Quantron and Hyliion are capitalizing on retrofitting diesel chassis to electric or hybrid models, achieving this at a fraction of the cost of new builds, and eyeing fleets in markets where subsidies are dwindling.
There's a clear strategic divide: traditional OEMs, with their asset-heavy approach, lean on dealer networks, while nimble, asset-light disruptors harness data for enhanced routing and uptime. Hydrogen's footprint remains limited; Nikola managed to ship a small number of units recently and, despite reporting substantial cash reserves, seeks additional capital to fuel its ambitions. As policy deadlines loom, the competitive landscape is set to intensify, driving innovation and steering the future of the electric truck market.
Electric Truck Industry Leaders
BYD Auto Co. Ltd.
Daimler Truck Holding AG
Dongfeng Motor Corporation
Groupe Renault
Volvo Group
- *Disclaimer: Major Players sorted in no particular order

Recent Industry Developments
- February 2025: Dongfeng introduced the GX, KC PRO, and KC PLUS electric trucks for Southeast Asia, emphasizing fast-charging compatibility with regional depot infrastructure.
- January 2025: A 600 kWh heavy-duty truck tailored for long-haul posted a 500 km certified range, signaling OEM readiness for regional freight electrification.


Global Electric Truck Market Report Scope
The scope of the report includes Propulsion Type (BEV, FCEV, and PHEV), Truck Type (Light, Medium, Heavy, and Tractor-Trailer), Application (Logistics, Municipal, Construction, Retail, and Utility), Range, Battery Capacity, Motor Architecture, and Geography.
By Propulsion Type
| Battery-Electric (BEV) |
| Fuel-Cell Electric (FCEV) |
| Plug-in Hybrid (PHEV) |
By Truck Type
| Light Truck (Less than or equal to 3.5 t GVW) |
| Medium-Duty Truck (3.6–12 t) |
| Heavy-Duty Truck (More than 12 t) |
| Tractor-Trailer |
By Application
| Logistics & Parcel |
| Municipal Services (Waste, Street-sweep) |
| Construction & Mining |
| Retail & FMCG Delivery |
| Utility & Other Industrial |
By Range
| Less than 150 km |
| 150 – 300 km |
| 301 – 500 km |
| More than 500 km |
By Battery Capacity
| Less than 150 kWh |
| 150 – 300 kWh |
| 301 – 500 kWh |
| More than 500 kWh |
By Motor Architecture
| Single-Motor |
| Dual-Motor |
| Tri/Quad-Motor |
By Region
| North America | United States |
| Canada | |
| Rest of North America | |
| South America | Brazil |
| Argentina | |
| Chile | |
| Colombia | |
| Rest of South America | |
| Europe | Germany |
| France | |
| United Kingdom | |
| Italy | |
| Spain | |
| Netherlands | |
| Norway | |
| Sweden | |
| Russia | |
| Rest of Europe | |
| Asia Pacific | China |
| Japan | |
| India | |
| South Korea | |
| Australia | |
| New Zealand | |
| Indonesia | |
| Thailand | |
| Singapore | |
| Rest of Asia Pacific | |
| Middle East and Africa | Saudi Arabia |
| United Arab Emirates | |
| Turkey | |
| Israel | |
| South Africa | |
| Nigeria | |
| Egypt | |
| Kenya | |
| Rest of Middle East and Africa |
| By Propulsion Type | Battery-Electric (BEV) | |
| Fuel-Cell Electric (FCEV) | ||
| Plug-in Hybrid (PHEV) | ||
| By Truck Type | Light Truck (Less than or equal to 3.5 t GVW) | |
| Medium-Duty Truck (3.6–12 t) | ||
| Heavy-Duty Truck (More than 12 t) | ||
| Tractor-Trailer | ||
| By Application | Logistics & Parcel | |
| Municipal Services (Waste, Street-sweep) | ||
| Construction & Mining | ||
| Retail & FMCG Delivery | ||
| Utility & Other Industrial | ||
| By Range | Less than 150 km | |
| 150 – 300 km | ||
| 301 – 500 km | ||
| More than 500 km | ||
| By Battery Capacity | Less than 150 kWh | |
| 150 – 300 kWh | ||
| 301 – 500 kWh | ||
| More than 500 kWh | ||
| By Motor Architecture | Single-Motor | |
| Dual-Motor | ||
| Tri/Quad-Motor | ||
| By Region | North America | United States |
| Canada | ||
| Rest of North America | ||
| South America | Brazil | |
| Argentina | ||
| Chile | ||
| Colombia | ||
| Rest of South America | ||
| Europe | Germany | |
| France | ||
| United Kingdom | ||
| Italy | ||
| Spain | ||
| Netherlands | ||
| Norway | ||
| Sweden | ||
| Russia | ||
| Rest of Europe | ||
| Asia Pacific | China | |
| Japan | ||
| India | ||
| South Korea | ||
| Australia | ||
| New Zealand | ||
| Indonesia | ||
| Thailand | ||
| Singapore | ||
| Rest of Asia Pacific | ||
| Middle East and Africa | Saudi Arabia | |
| United Arab Emirates | ||
| Turkey | ||
| Israel | ||
| South Africa | ||
| Nigeria | ||
| Egypt | ||
| Kenya | ||
| Rest of Middle East and Africa | ||


Market Definition
- Vehicle Type - The category covers truck category.
- Vehicle Body Type - This includes Medium-duty Commercial Trucks and Heavy-duty Commercial Trucks
- Fuel Category - The category includes various fuel types such as Gasoline, Diesel, LPG (Liquefied Petroleum Gas), CNG (Compressed Natural Gas), HEV (Hybrid Electric Vehicles), PHEV (Plug-in Hybrid Electric Vehicles), BEV (Battery Electric Vehicles), and FCEV (Fuel Cell Electric Vehicles)
| Keyword | Definition |
|---|---|
| Electric Vehicle (EV) | A vehicle which uses one or more electric motors for propulsion. Includes cars, buses, and trucks. This term includes all-electric vehicles or battery electric vehicles and plug-in hybrid electric vehicles. |
| BEV | A BEV relies completely on a battery and a motor for propulsion. The battery in the vehicle must be charged by plugging it into an outlet or public charging station. BEVs do not have an ICE and hence are pollution-free. They have a low cost of operation and reduced engine noise as compared to conventional fuel engines. However, they have a shorter range and higher prices than their equivalent gasoline models. |
| PEV | A plug-in electric vehicle is an electric vehicle that can be externally charged and generally includes all-electric vehicles as well as plug-in hybrids. |
| Plug-in Hybrid EV | A vehicle that can be powered either by an ICE or an electric motor. In contrast to normal hybrid EVs, they can be charged externally. |
| Internal combustion engine | An engine in which the burning of fuels occurs in a confined space called a combustion chamber. Usually run with gasoline/petrol or diesel. |
| Hybrid EV | A vehicle powered by an ICE in combination with one or more electric motors that use energy stored in batteries. These are continually recharged with power from the ICE and regenerative braking. |
| Commercial Vehicles | Commercial vehicles are motorized road vehicles designed for transporting people or goods. The category includes light commercial vehicles (LCVs) and medium and heavy-duty vehicles (M&HCV). |
| Passenger Vehicles | Passenger cars are electric motor– or engine-driven vehicles with at least four wheels. These vehicles are used for the transport of passengers and comprise no more than eight seats in addition to the driver’s seat. |
| Light Commercial Vehicles | Commercial vehicles that weigh less than 6,000 lb (Class 1) and in the range of 6,001–10,000 lb (Class 2) are covered under this category. |
| M&HDT | Commercial vehicles that weigh in the range of 10,001–14,000 lb (Class 3), 14,001–16,000 lb (Class 4), 16,001–19,500 lb (Class 5), 19,501–26,000 lb (Class 6), 26,001–33,000 lb (Class 7) and above 33,001 lb (Class 8) are covered under this category. |
| Bus | A mode of transportation that typically refers to a large vehicle designed to carry passengers over long distances. This includes transit bus, school bus, shuttle bus, and trolleybuses. |
| Diesel | It includes vehicles that use diesel as their primary fuel. A diesel engine vehicle have a compression-ignited injection system rather than the spark-ignited system used by most gasoline vehicles. In such vehicles, fuel is injected into the combustion chamber and ignited by the high temperature achieved when gas is greatly compressed. |
| Gasoline | It includes vehicles that use gas/petrol as their primary fuel. A gasoline car typically uses a spark-ignited internal combustion engine. In such vehicles, fuel is injected into either the intake manifold or the combustion chamber, where it is combined with air, and the air/fuel mixture is ignited by the spark from a spark plug. |
| LPG | It includes vehicles that use LPG as their primary fuel. Both dedicated and bi-fuel LPG vehicles are considered under the scope of the study. |
| CNG | It includes vehicles that use CNG as their primary fuel. These are vehicles that operate like gasoline-powered vehicles with spark-ignited internal combustion engines. |
| HEV | All the electric vehicles that use batteries and an internal combustion engine (ICE) as their primary source for propulsion are considered under this category. HEVs generally use a diesel-electric powertrain and are also known as hybrid diesel-electric vehicles. An HEV converts the vehicle momentum (kinetic energy) into electricity that recharges the battery when the vehicle slows down or stops. The battery of HEV cannot be charged using plug-in devices. |
| PHEV | PHEVs are powered by a battery as well as an ICE. The battery can be charged through either regenerative breaking using the ICE or by plugging into some external charging source. PHEVs have a better range than BEVs but are comparatively less eco-friendly. |
| Hatchback | These are compact-sized cars with a hatch-type door provided at the rear end. |
| Sedan | These are usually two- or four-door passenger cars, with a separate area provided at the rear end for luggage. |
| SUV | Popularly known as SUVs, these cars come with four-wheel drive, and usually have high ground clearance. These cars can also be used as off-road vehicles. |
| MPV | These are multi-purpose vehicles (also called minivans) designed to carry a larger number of passengers. They carry between five and seven people and have room for luggage too. They are usually taller than the average family saloon car, to provide greater headroom and ease of access, and they are usually front-wheel drive. |


Research Methodology
Mordor Intelligence follows a four-step methodology in all its reports.
- Step-1: Identify Key Variables: To build a robust forecasting methodology, the variables and factors identified in Step-1 are tested against available historical market numbers. Through an iterative process, the variables required for market forecast are set and the model is built based on these variables.
- Step-2: Build a Market Model: Market-size estimations for the historical and forecast years have been provided in revenue and volume terms. Market revenue is calculated by multiplying the sales volume with their respective average selling price (ASP). While estimating ASP factors like average inflation, market demand shift, manufacturing cost, technological advancement, and varying consumer preference, among others have been taken into account.
- Step-3: Validate and Finalize: In this important step, all market numbers, variables, and analyst calls are validated through an extensive network of primary research experts from the market studied. The respondents are selected across levels and functions to generate a holistic picture of the market studied.
- Step-4: Research Outputs: Syndicated Reports, Custom Consulting Assignments, Databases & Subscription Platforms.


