Electric Utility Vehicle Market Size and Share
Market Overview
| Study Period | 2019 - 2030 |
|---|---|
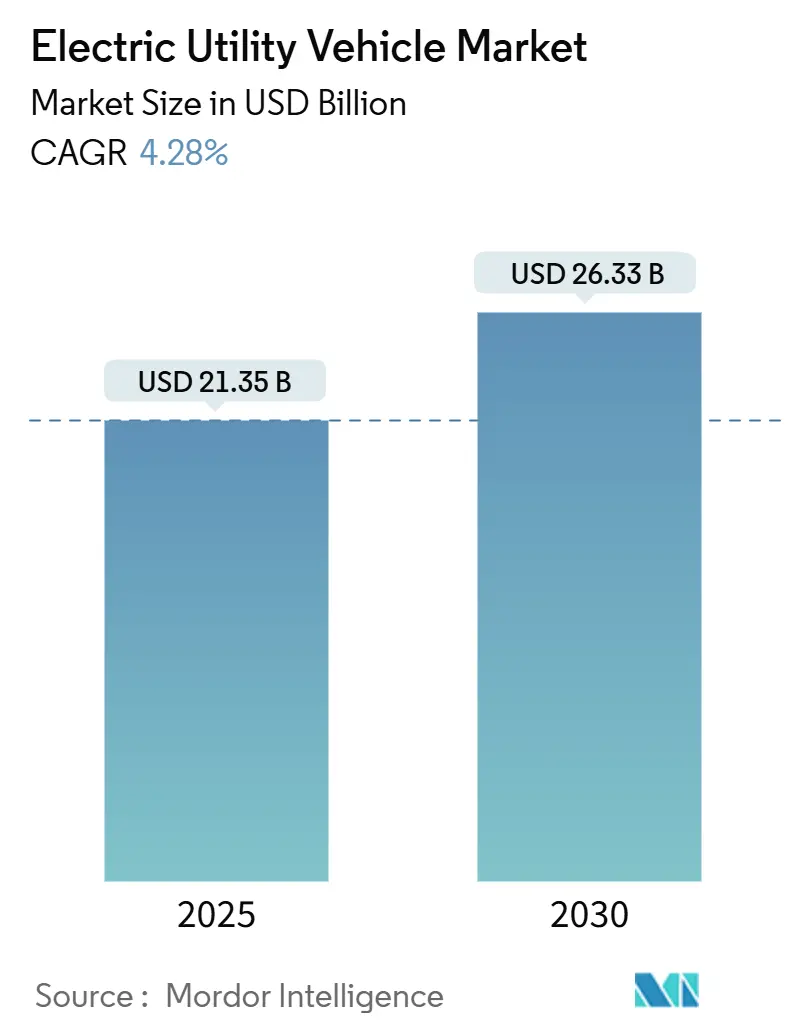
| Market Size (2025) | USD 21.35 Billion |
| Market Size (2030) | USD 26.33 Billion |
| Growth Rate (2025 - 2030) | 4.28% CAGR |
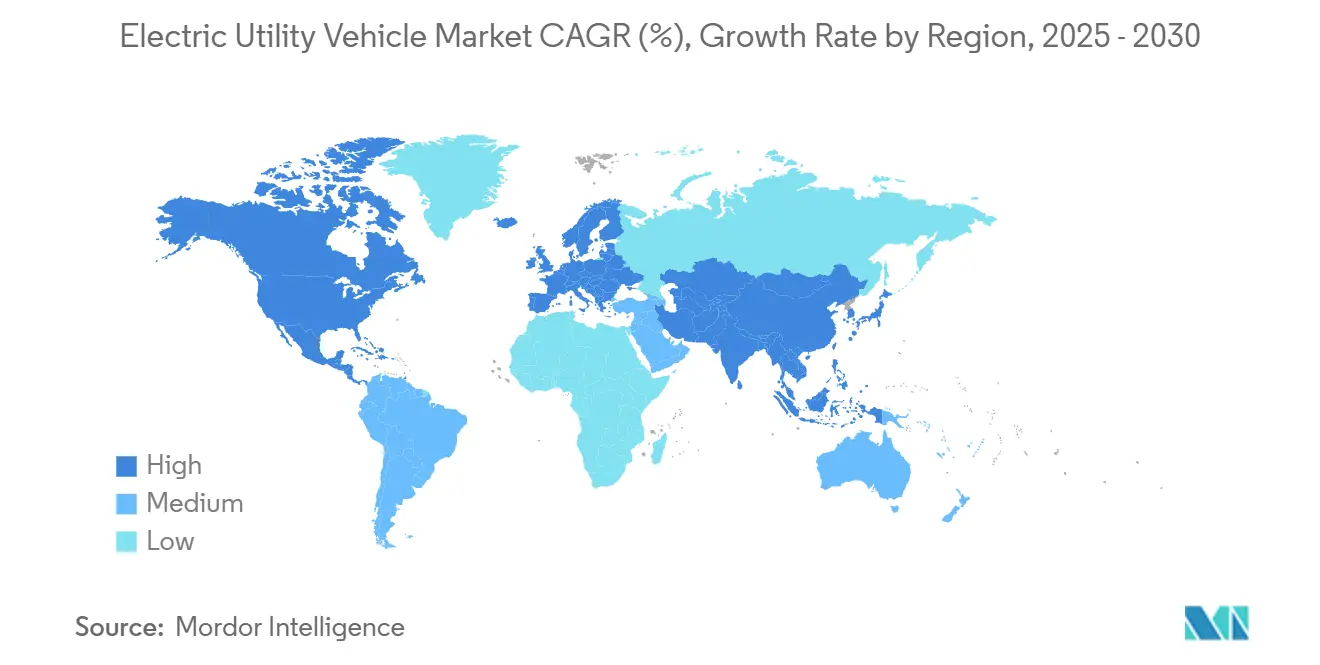
| Fastest Growing Market | Asia Pacific |
| Largest Market | North America |
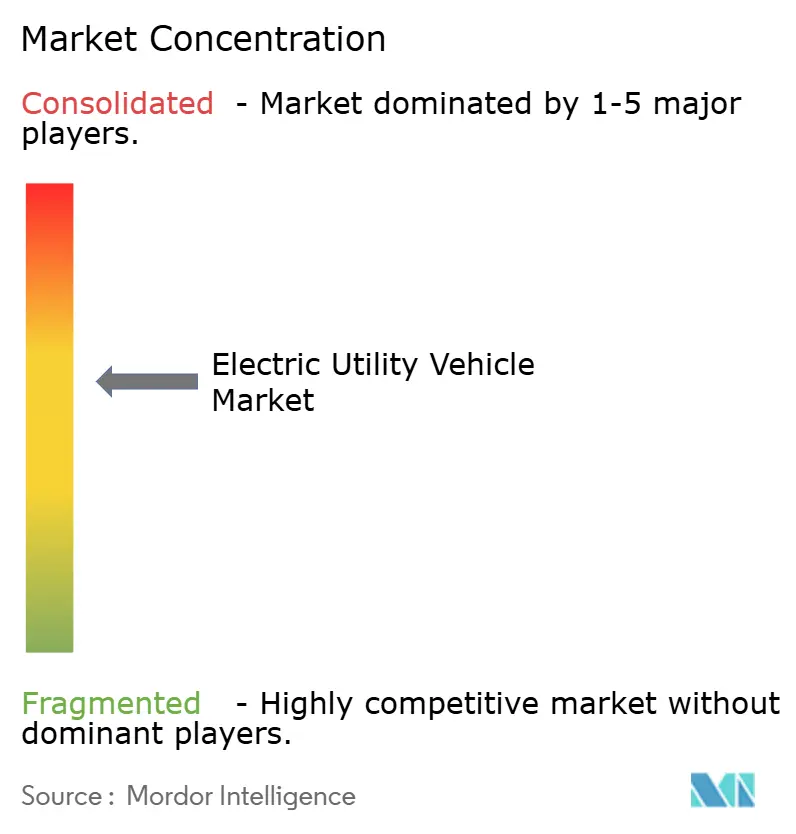
| Market Concentration | Medium |
Major Players *Disclaimer: Major Players sorted in no particular order Image © Mordor Intelligence. Reuse requires attribution under CC BY 4.0. | |
Electric Utility Vehicle Market Analysis by Mordor Intelligence
The electric utility vehicle market size stood at USD 21.35 billion in 2025 and is on track to reach USD 26.33 billion by 2030, reflecting a 4.28% CAGR during 2025-2030. This growth arises from falling battery prices, airport and municipal fleet electrification mandates, and broader acceptance across agriculture and industrial intralogistics. The market now benefits from tax incentives in the United States and the European Union, lithium-ion pack costs trending toward USD 70 /kWh, and a wave of OEM product launches that shrink the total cost-of-ownership gap versus internal-combustion alternatives. Airports, resorts, and municipalities increasingly view zero-emission fleets as strategic assets that boost brand reputation and lower noise footprints. Supply-chain diversification for lithium iron phosphate and solid-state battery investment set the stage for the next technology leap, while high-torque electric motors and harmonized charging standards remain near-term pain points.
Key Report Takeaways
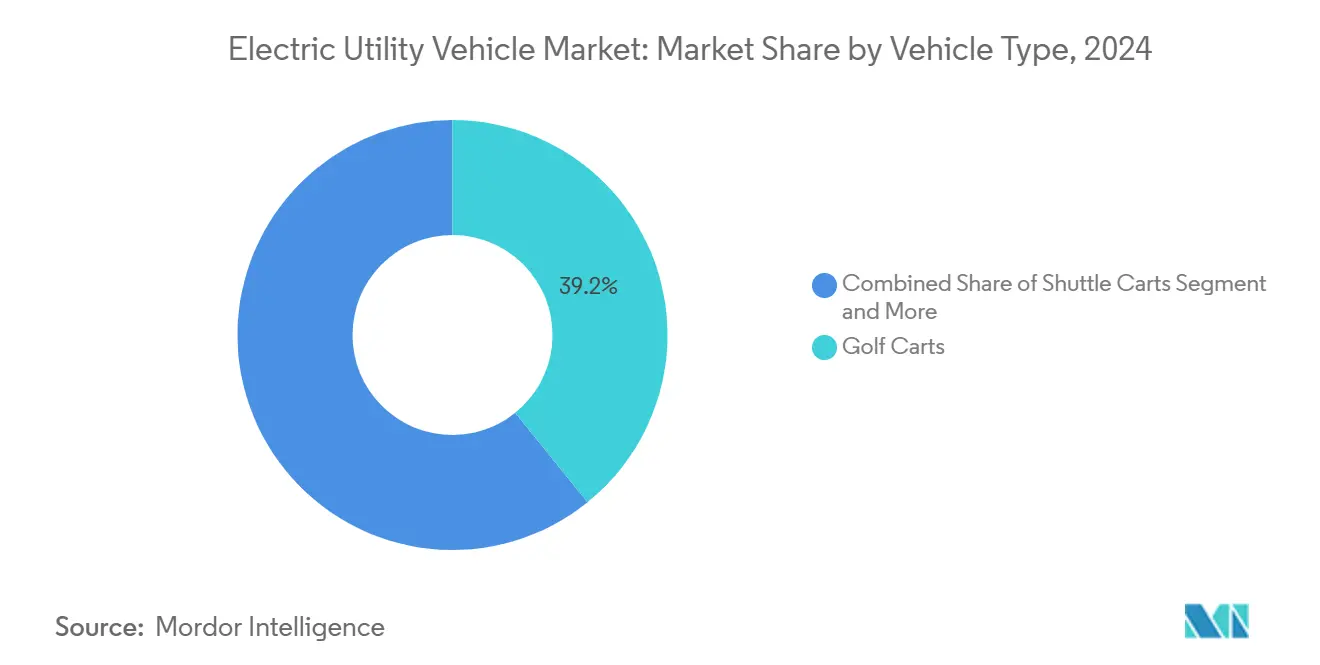
- By vehicle type, golf carts led the electric utility vehicle market with a 39.15% share in 2024; utility task vehicles are advancing at a 6.74% CAGR through 2030.
- By battery type, lithium-ion commanded a 63.44% share of the market size in 2024, while posting the fastest 4.86% CAGR during the outlook period.
- By drive type, 2-wheel drive held a 48.16% share in the Electric Utility Vehicle Market in 2024; all-wheel drive is projected to expand at a 7.12% CAGR to 2030.
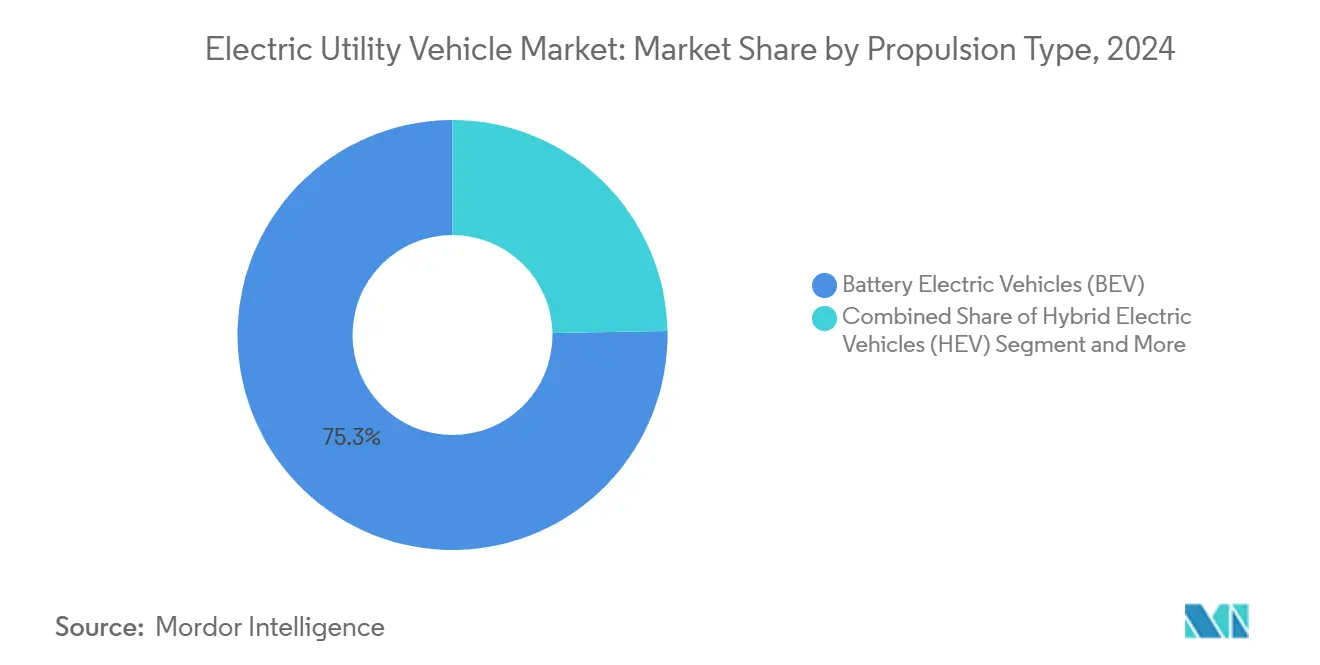
- By propulsion type, battery electric vehicles accounted for a 75.29% share in the Market in 2024 and are forecast to grow at a 6.15% CAGR through 2030.
- By application, airport operations captured a 23.85% share in the Electric Utility Vehicle Market in 2024; municipal services represent the fastest-growing usage, with a 5.45% CAGR to 2030.
- By geography, North America led with a 34.18% share in the Market in 2024, yet Asia-Pacific is set to deliver the highest 5.03% CAGR over 2025-2030.
Global Electric Utility Vehicle Market Trends and Insights
Drivers Impact Analysis*
| Driver | (~) % Impact on CAGR Forecast | Geographic Relevance | Impact Timeline |
|---|---|---|---|
| Agriculture and Municipal Electrification | +1.2% | North America and Europe core, APAC scaling | Long term (≥ 4 years) |
| Lithium-Ion Prices Below USD 70 | +0.9% | Global | Short term (≤ 2 years) |
| Zero-Emission Airport and Resort Fleets | +0.8% | North America and Europe first movers, global rollout | Medium term (2-4 years) |
| Low-Speed E-Utility Tax Credits | +0.7% | North America and Europe | Short term (≤ 2 years) |
| Intralogistics Electric Tow Tractor Demand | +0.6% | Industrial clusters in North America, Europe, and APAC | Medium term (2-4 years) |
| OEM Solid-State Pack Shift | +0.5% | Led by Japan and South Korea technology houses | Long term (≥ 4 years) |
| Source: Mordor Intelligence | |||
Electrification Push in Agriculture and Municipal Service Vehicles
John Deere’s E-Power utility series and CASE’s electric backhoe release underscore agriculture’s pivot toward battery power[1]“John Deere Showcases E-Power Electric Utility Vehicles at CES 2025,” Deere & Company, deere.com. Precision-farming operators view quiet, emission-free utility rigs as compatible with livestock welfare and night-time fieldwork. Additionally, Boston and Porterville have shifted park-maintenance fleets to battery electric, citing lower maintenance labor and fuel costs. Shared requirements for robustness, payload, and duty-cycle stamina spur cross-segment platform strategies, allowing OEMs to spread R&D spending across the wider electric utility vehicle market. In parallel, intralogistics automation in distribution centers specifies electric tow tractors with millimeter-level positioning, pushing advancements in battery-management software that trickle into agricultural and municipal models.
Declining Lithium-ion Battery Prices Below USD 70 /kWh
Large-scale production of LFP cathodes is driving a rapid decline in battery costs. This cost drop is making electric utility vehicles more accessible and economically viable. Yamaha's initiative to develop internal batteries for golf carts underscores a growing trend toward vertical integration, enabling companies to manage supply chain risks better and stabilize material costs. The shift from lead-acid to lithium-based batteries is transforming the economics of low-speed vehicles, offering benefits like reduced maintenance and an extended lifespan. With battery packs becoming standardized and readily available, smaller manufacturers find it easier to enter the market, resulting in heightened competition and faster innovation in the electric utility vehicle sector.
Rapid Adoption of Zero-Emission Fleets by Airports and Resorts
To achieve zero-emission goals, airport operators are shifting their ground-support fleets entirely to electric vehicles. Brands like Textr on’s TUG and Douglas are witnessing a surge in demand for electric baggage tractors, which play a pivotal role in curbing noise and emissions on airport ramps. In a parallel move, resort chains are embracing low-speed electric vehicles, not only to lessen acoustic impact but also to honor their sustainability pledges. This shift is generating economies of scale, subsequently driving down production costs.
These significant adoptions underscore the reliability of electric utility vehicles, leading municipal departments to mirror these procurement choices. Government incentives, including layered tax credits and grants, are hastening return-on-investment timelines, further fueling this adoption trend. Fleet managers are beginning to see electric utility vehicles as more than just compliance tools; they are positioning them as branding assets, especially with impending bans on combustion engines on the horizon.
Tax-Credit Extensions in the U.S. and EU for Low-Speed E-utility Vehicles
The 2025 U.S. Inflation Reduction Act extension grants up to USD 7,500 per qualifying low-speed e-utility vehicle, while EU member states apply accelerated depreciation schedules that slash first-year tax outlays. Local subsidies in Canada, Germany, and France stack additional rebates, compressing payback periods to two-and-a-half years for many fleet buyers. The Philippines and Indonesia mirror these incentives to jump-start regional demand. Synchronized policy sends clear volume signals to suppliers, enabling economies-of-scale purchasing that benefit the global electric utility vehicle market.
Restraints Impact Analysis*
| Restraint | (~) % Impact on CAGR Forecast | Geographic Relevance | Impact Timeline |
|---|---|---|---|
| LFP Cathode Supply Concentrated In China | -0.8% | Global, pronounced in North America and Europe | Medium term (2-4 years) |
| Limited High-Torque Motor Availability | -0.6% | Global, chiefly agricultural and industrial | Medium term (2-4 years) |
| Fragmented Low-Voltage Charging Standards | -0.4% | North America and Europe | Short term (≤ 2 years) |
| South American UTV Homologation Lag | -0.3% | South America | Long term (≥ 4 years) |
| Source: Mordor Intelligence | |||
Supply-Chain Exposure to LFP Cathode Material from China
China's grip on the global supply of LFP battery materials renders the market vulnerable to disruptions from policy shifts or logistical challenges. Such upheavals can trigger significant spikes in battery cell prices. In contrast, initiatives for battery materials in the United States and the EU are nascent, resulting in a continued reliance on imports for the foreseeable future. This reliance breeds uncertainty and dampens growth projections for electric utility vehicles in these Western markets. However, governments in the United States and the EU increasingly focus on policies and investments to bolster domestic production capabilities. These efforts aim to reduce dependency on imports and stabilize supply chains, but their impact is expected to materialize only over the long term.
Limited High-Torque Motor Options for Heavy-Duty Tasks
Utility vehicles requiring sustained 600-Nm torque for steep gradients still rely on diesel because affordable electric motors overheat under continuous load. Permanent-magnet synchronous alternatives alleviate some thermal strain yet elevate vehicle cost. Manufacturers experiment with water-glycol cooling jackets, but envelope expansion erodes payload. The technology gap corrals the electric utility vehicle market into light- and medium-duty niches until higher-density motors reach volume pricing.
*Our forecasts treat driver/restraint impacts as directional, not additive. The impact forecasts reflect baseline growth, mix effects, and variable interactions.
Segment Analysis
By Vehicle Type: UTV Momentum Outpaces Legacy Golf Carts
Golf carts retained a 39.15% share in theMarket in 2024, bolstered by 38,000-plus U.S. courses and hospitality fleets. Yet UTV shipments expand at a 6.74% CAGR, widening the electric utility vehicle market size for high-payload, multi-terrain tasks. Shuttle carts occupy an intermediary niche, benefiting from airport people-mover programs, while all-terrain vehicles remain specialized but resilient. Yamaha’s lithium-ion UMAX and Pilotcar tie-up illustrates flexible platform reuse across categories[2]“Yamaha Unveils Proprietary Lithium-Ion Golf Car Battery,” Yamaha Motor Co., Ltd., yamaha-motor.com. Consolidating chassis and electronic architectures helps manufacturers lower bill-of-materials and speed regulatory approval, reinforcing vehicle diversity within the electric utility vehicle market.
Second-generation UTV designs deploy sealed drivetrains, 12-inch ground clearance, and smart overload alerts, catering to municipal snow removal, vineyard hauling, and mining support. OEM financing arms bundle vehicles with telematics subscriptions that alert fleet managers to misuse. Such data-enabled services generate recurring revenue streams that cushion hardware margin compression, a trend likely to permeate the wider electric utility vehicle market industry.


By Battery Type: Lithium-Ion Strengthens Control
Lithium-ion systems claimed a 63.44% share in the Electric Utility Vehicle Market in 2024 and posted a 4.86% CAGR, reflecting price parity with lead-acid in most 48-V formats. Lead-acid persists only where acquisition cost trumps cycle life, often in seasonal golf fleets.
Enhanced energy density lets OEMs halve pack volume, enabling under-seat integration and lowering center-of-gravity for sharper vehicle handling. Yamaha’s vertically integrated LFP packs slash supplier markups and stabilize margins in volatile commodity cycles. Over-the-air firmware updates now recalibrate charge curves to ambient temperature, prolonging cycle life, a capability fast becoming table stakes across the electric utility vehicle market.
By Drive Type: Software-Enabled AWD Gains Ground
While 2WD garnered a 48.16% share in the Electric Utility Vehicle Market in 2024, software-driven AWD is advancing 7.12% annually. With independent hub motors, a light electric UTV can vector torque for slippery inclines without adding heavy transfer cases. Club Car’s IntelliTrak automatic AWD lowers driver skill thresholds while preserving range by disengaging idle wheels. As battery density climbs, the incremental mass of extra motors diminishes as a design constraint, broadening AWD’s addressable share of the electric utility vehicle market.
Fleet operators in snow-belt cities increasingly specify AWD for year-round sidewalk maintenance, delivering resilient service levels despite harsh winters. Predictive algorithms distribute torque proactively, reducing tire wear and boosting energy efficiency. Over the forecast horizon, AWD penetration could significantly eclipse, adding new complexity layers and value capture opportunities within the electric utility vehicle market.
By Propulsion Type: BEV Leadership Consolidates
Battery electric platforms occupied a 75.29% share in the Electric Utility Vehicle Market in 2024 and are expected to grow at a 6.15% CAGR, as cost reductions and silent operation align with sustainability targets. Hybrid electric variants play a stop-gap role in remote areas lacking charging, while fuel-cell options remain experimental. Kawasaki explores hydrogen-engine crossovers, but infrastructure scarcity constrains rollout[3]“Hydrogen Engine Development for Off-Road Mobility,” Kawasaki Heavy Industries, kawasaki.com. The electric utility vehicle market size, dominated by BEVs, should rise further by decade-end, with hybrids tapering unless modular range-extenders find cost traction.
Swappable-battery pilots at select resorts hint at future operational models where a discharged cassette is exchanged within two minutes, enabling near-continuous deployment. This system could unlock new duty cycles for the electric utility vehicle market, particularly in industrial shifts exceeding 12 hours if standardized.
By Application: Municipal Services Emerge as Growth Engine
Airports still led the electric utility vehicle market with a 23.85% share in 2024, yet municipal services log a 5.45% CAGR as city councils prioritize carbon neutrality. Park maintenance, waste hauling, and street cleaning duties align perfectly with low-speed torque characteristics. The electric utility vehicle market share migrating to municipal budgets also secures public charging spots, indirectly boosting private-sector feasibility.
Precision agriculture rides satellite guidance and farm-management software, nudging growers toward electric UTVs that integrate seamlessly with digital platforms. John Deere’s autonomous electric mowers collect agronomic data while cutting turf, merging agritech and mobility stacks. Industrial buyers integrate electric tow tractors into MES systems for lean manufacturing, further diversifying end-market exposure for the electric utility vehicle market.
Geography Analysis
North America’s 34.18% 2024 share mirrors deep golf-course density, large-scale farming, and federal tax credits up to USD 7,500 that narrow payback gaps. Municipal procurement collaboratives in Texas and California pool demand for 500-unit electric grounds-keeping fleets, unlocking volume discounts that ripple across the market. Dealer coverage spanning more than 3,400 outlets ensures service reach, while rising lithium-ion recycling capacity supports circular-economy objectives.
Europe’s strict CO₂ reduction targets and congestion-charge exemptions create strong business cases for battery fleets. Germany has introduced an incentive package to promote EV adoption and support climate and infrastructure goals. The package features reforms like special depreciation schemes for EVs starting in July 2025. Scandinavian airports pledge 100% electric ground support by 2028, steering incremental demand to the electric utility vehicle market. Infrastructure gaps loom, yet industry consortia in France pilot interoperable 48-V charging hubs to accelerate standardization.
Asia-Pacific’s 5.03% CAGR owes to China’s production depth and supportive policy, such as the 20% purchase tax rebate on low-speed EVs through 2027. The Philippines targets 200,000 EV units by 2024, while Indonesia reduces import tariffs on battery cells, collectively stimulating regional supply-chain investment. Domestic brands like Guangdi and Rayte ride scale advantages into price-sensitive ASEAN fleets, injecting competitive pressure worldwide. As disposable incomes rise, resort and recreation segments from Thailand to Australia adopt battery carts en masse, broadening exposure for the electric utility vehicle market size across consumer and B2B channels.

Competitive Landscape
The electric utility vehicle market remains moderately fragmented. Textron’s E-Z-GO line, Yamaha Motor, and Club Car exploit vertical integration—owning battery packs, telematics, and financing arms—to reinforce channel stickiness. Chinese entrants under brands such as Evolution and Lvtong undercut on price, shipping CKD kits to local assemblers to dodge tariffs.
Strategic plays center on battery control software, swapping ecosystems, and fleet-analytics dashboards rather than raw vehicle hardware. Club Car’s acquisition of premium cart maker Garia extends its reach into street-legal micro-mobility, broadening addressable spend beyond golf. Lincoln Electric’s purchase of generator specialist Vanair signals converging interest from industrial equipment firms seeking cross-selling synergies in the market.
Partnerships proliferate: Yamaha collaborates with Pilotcar to co-develop low-speed street vehicles for U.S. neighborhoods, sharing electric drivetrains and regulatory homologation. Textron allies with Enphase for bidirectional charging pilots, aiming to position electric carts as grid-interactive assets. As high-density solid-state packs near commercialization, battery suppliers court OEM exclusivity, presaging possible technology moats that may recalibrate market share trajectories within the electric utility vehicle market.
Electric Utility Vehicle Industry Leaders
Textron Inc.
Yamaha Golf-Car Company
Club Car LLC
Polaris Inc.
John Deere
- *Disclaimer: Major Players sorted in no particular order

Recent Industry Developments
- July 2025: Kinetic Green Energy teamed with Tonino Lamborghini SpA to produce and export Italian-designed, India-built electric golf carts under the Tonino Lamborghini brand.
- May 2025: Suzhou Lexsong unveiled an aluminum-bodied next-generation electric golf cart featuring an enlarged cargo bed for commercial payloads.
- March 2025: Yamaha Motor released five-seat golf cars powered by proprietary lithium-ion packs, expanding passenger capacity for hospitality fleets.
- November 2024: Massimo Group debuted the MVR 2X Golf Cart and MVR Cargo Max Utility Cart, broadening its low-speed electric lineup for recreational and professional buyers.


Global Electric Utility Vehicle Market Report Scope
| Golf Carts |
| Shuttle Carts |
| ATVs |
| UTVs |
| Lithium-Ion |
| Lead-Acid |
| Others |
| 2-Wheel Drive (2WD) |
| 4-Wheel Drive (4WD) |
| All-Wheel Drive (AWD) |
| Battery Electric Vehicles (BEV) |
| Hybrid Electric Vehicles (HEV) |
| Fuel Cell Electric Vehicles (FCEV) |
| Agriculture |
| Municipal Services |
| Industrial Facilities |
| Logistics |
| Recreation |
| Airports |
| Resorts |
| Others |
| North America | United States |
| Canada | |
| Rest of North America | |
| South America | Brazil |
| Argentina | |
| Rest of South America | |
| Europe | United Kingdom |
| Germany | |
| Spain | |
| Italy | |
| France | |
| Russia | |
| Rest of Europe | |
| Asia-Pacific | India |
| China | |
| Japan | |
| South Korea | |
| Rest of Asia-Pacific | |
| Middle East and Africa | United Arab Emirates |
| Saudi Arabia | |
| Turkey | |
| Egypt | |
| South Africa | |
| Rest of Middle-East and Africa |
| By Vehicle Type | Golf Carts | |
| Shuttle Carts | ||
| ATVs | ||
| UTVs | ||
| By Battery Type | Lithium-Ion | |
| Lead-Acid | ||
| Others | ||
| By Drive Type | 2-Wheel Drive (2WD) | |
| 4-Wheel Drive (4WD) | ||
| All-Wheel Drive (AWD) | ||
| By Propulsion Type | Battery Electric Vehicles (BEV) | |
| Hybrid Electric Vehicles (HEV) | ||
| Fuel Cell Electric Vehicles (FCEV) | ||
| By Application | Agriculture | |
| Municipal Services | ||
| Industrial Facilities | ||
| Logistics | ||
| Recreation | ||
| Airports | ||
| Resorts | ||
| Others | ||
| By Geography | North America | United States |
| Canada | ||
| Rest of North America | ||
| South America | Brazil | |
| Argentina | ||
| Rest of South America | ||
| Europe | United Kingdom | |
| Germany | ||
| Spain | ||
| Italy | ||
| France | ||
| Russia | ||
| Rest of Europe | ||
| Asia-Pacific | India | |
| China | ||
| Japan | ||
| South Korea | ||
| Rest of Asia-Pacific | ||
| Middle East and Africa | United Arab Emirates | |
| Saudi Arabia | ||
| Turkey | ||
| Egypt | ||
| South Africa | ||
| Rest of Middle-East and Africa | ||


Key Questions Answered in the Report
How large is the electric utility vehicle market in 2025?
The electric utility vehicle market size reached USD 21.35 billion in 2025.
What is the forecast CAGR for electric utility vehicles through 2030?
Global revenue is projected to grow at a 4.28% CAGR from 2025 to 2030.
Which vehicle type is growing fastest?
Utility task vehicles post the highest 6.74% CAGR thanks to demand in agriculture, municipal, and industrial sectors.
Which region offers the quickest growth?
Asia-Pacific leads with a 5.03% CAGR driven by supportive policy and China’s manufacturing scale through 2030.
Page last updated on:


