Education Security Market Size and Share
Market Overview
| Study Period | 2020 - 2031 |
|---|---|
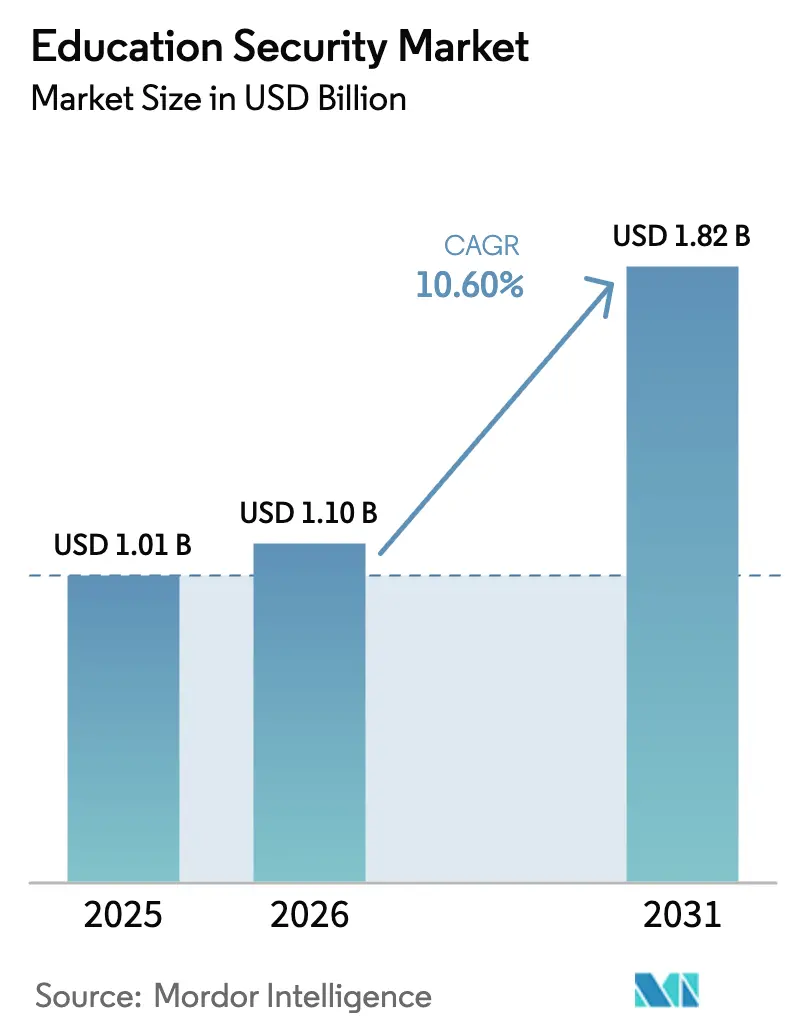
| Market Size (2026) | USD 1.10 Billion |
| Market Size (2031) | USD 1.82 Billion |
| Growth Rate (2026 - 2031) | 10.60% CAGR |
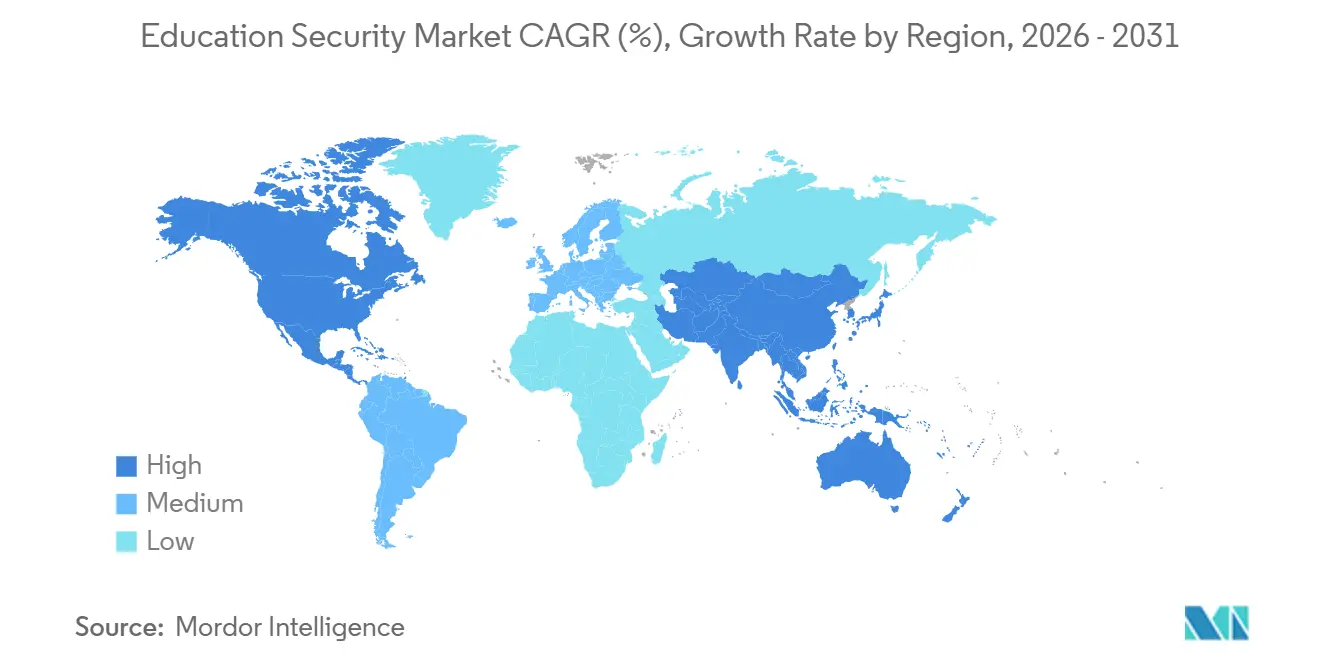
| Fastest Growing Market | Asia Pacific |
| Largest Market | North America |
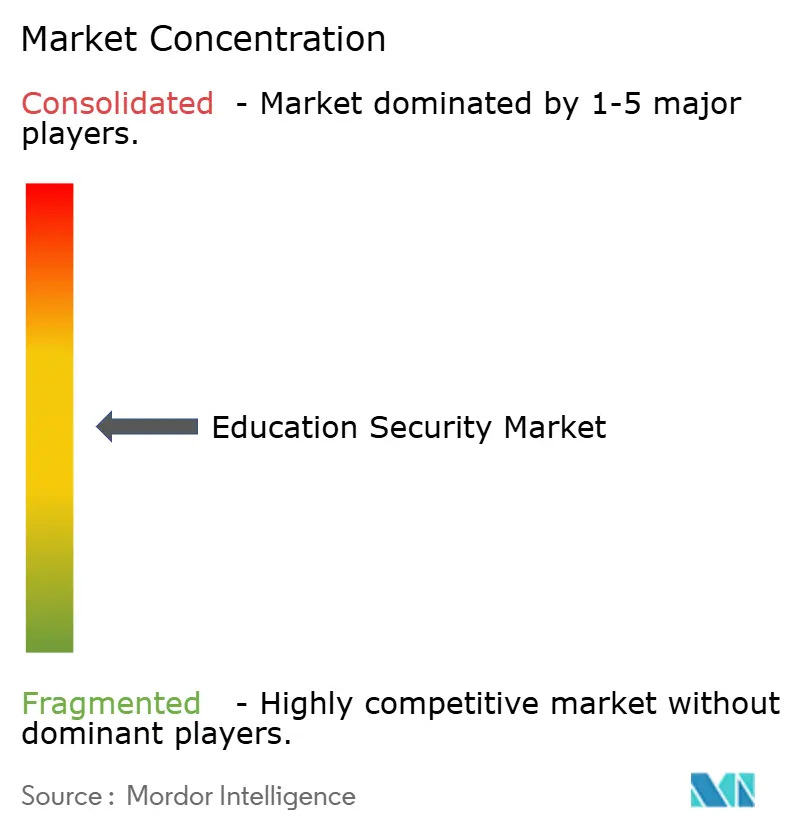
| Market Concentration | Medium |
Major Players *Disclaimer: Major Players sorted in no particular order Image © Mordor Intelligence. Reuse requires attribution under CC BY 4.0. | |
Education Security Market Analysis by Mordor Intelligence
The Education Security market size is projected to be USD 1.01 billion in 2025, USD 1.10 billion in 2026, and reach USD 1.82 billion by 2031, growing at a CAGR of 10.6% from 2026 to 2031. Federal and state safety grants, notably the USD 73 million COPS Office STOP School Violence Program and the USD 83 million BJA STOP pool, are compressing refresh cycles and steering budgets toward integrated physical-cyber architectures. Institutions have shifted from reactive guard staffing to predictive threat mitigation, adopting AI-powered analytics for firearm detection, cross-camera tracking without facial recognition, and Zero Trust cybersecurity baselines. Venture funding for cloud-native platforms, such as Kisi’s USD 30 million Series B and Genea’s USD 8 million Series A, highlights investor confidence in subscription models that eliminate on-premise servers. Meanwhile, emerging regions are bundling video surveillance and access control into broader campus-modernization programs, exemplified by India’s rollout of closed-circuit television across 27,000 schools in Uttar Pradesh.
Key Report Takeaways
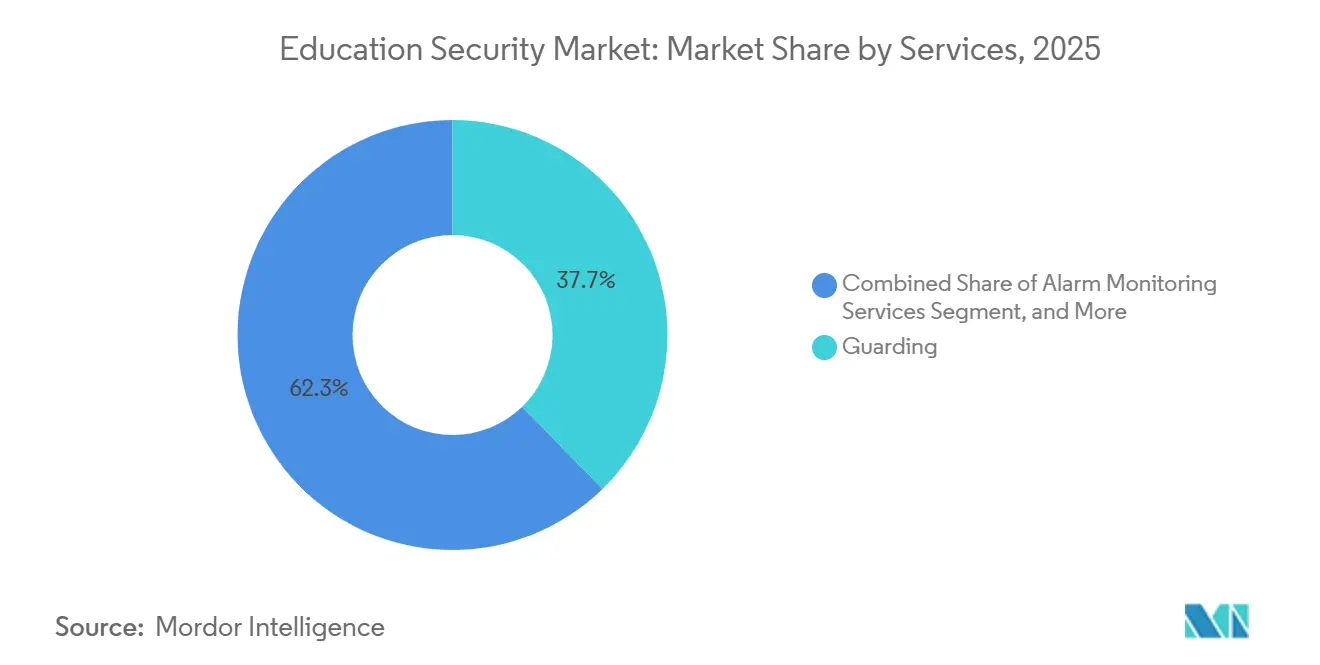
- By services, guarding commanded 37.71% of Education Security market share in 2025, while security consulting is advancing at a 10.73% CAGR through 2031, reflecting the pivot toward behavioral threat assessment.
- By component, hardware led with 45.64% of Education Security market size in 2025; software is projected to expand at a 10.95% CAGR over 2026-2031 as AI analytics migrate to the cloud.
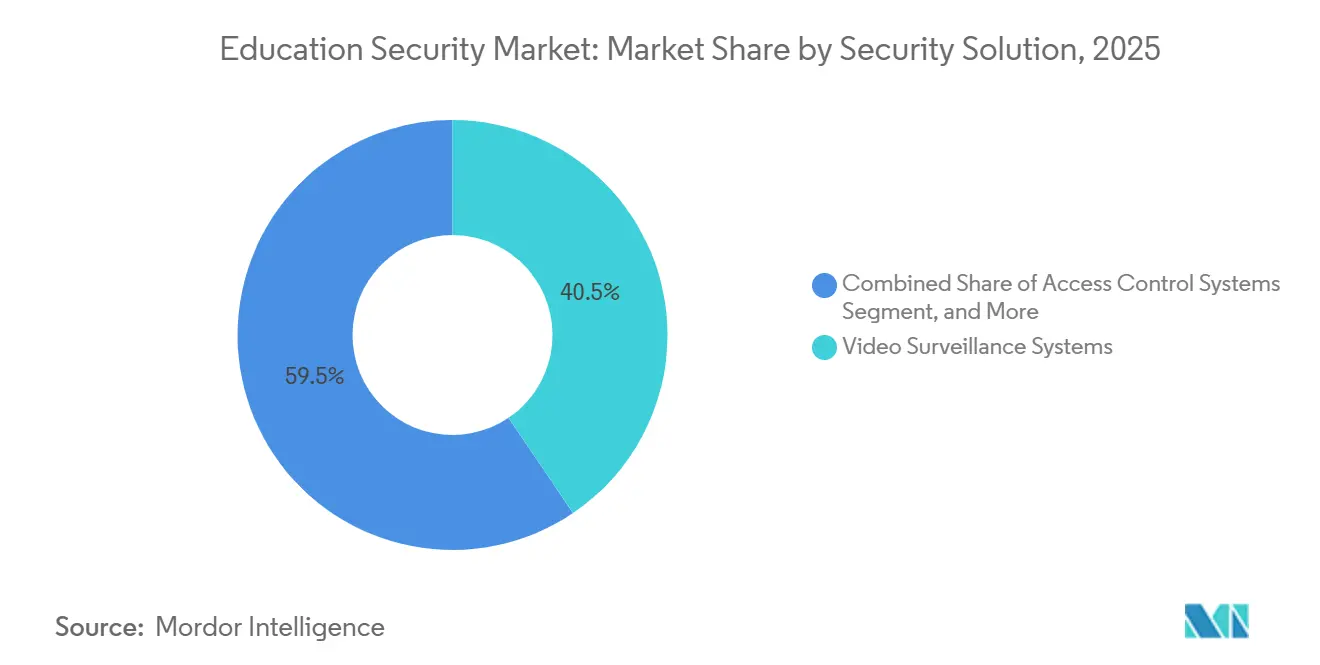
- By security solution, video surveillance systems held 40.53% share in 2025, whereas cybersecurity solutions are forecast to grow fastest at 11.02% CAGR.
- By deployment, on-premise architectures retained 47.62% share in 2025, yet cloud models are set to rise at an 11.14% CAGR, aided by Eagle Eye Networks’ USD 1 million grant program that offsets migration costs.
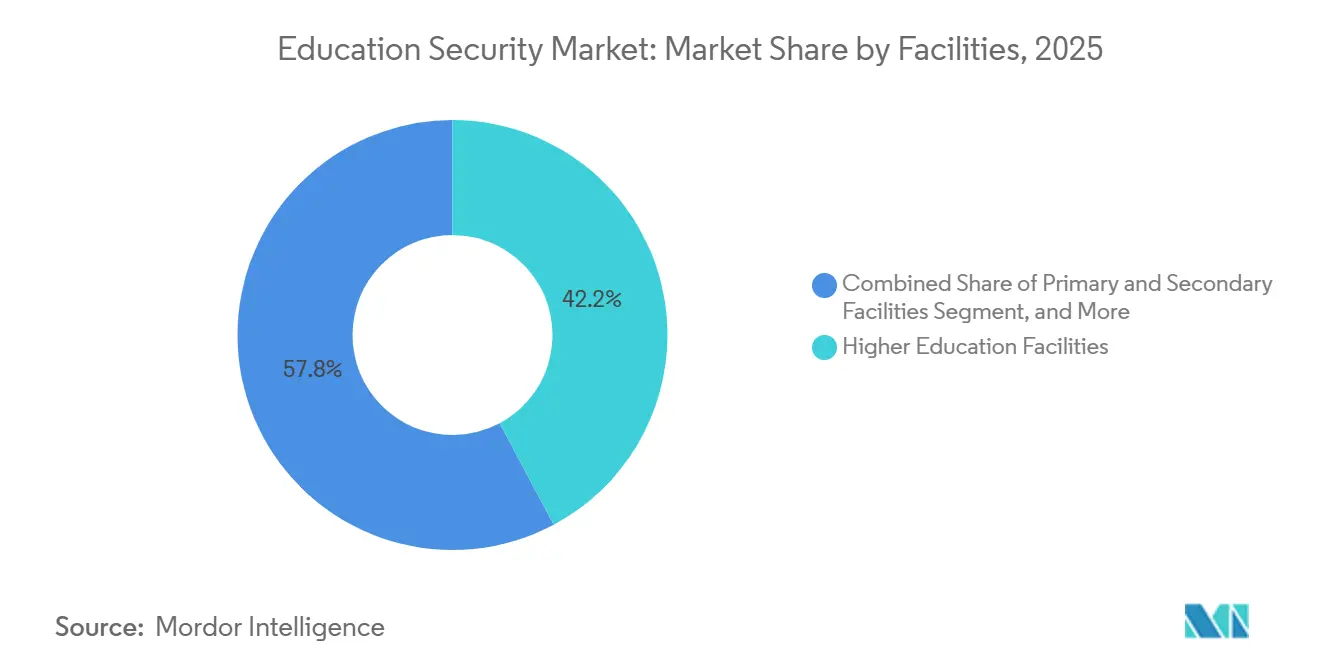
- By facilities, higher-education campuses captured 42.19% share in 2025; primary and secondary schools record the fastest 10.66% CAGR as STOP grants and state mandates drive K-12 security upgrades.
- By geography, North America accounted for 33.54% share in 2025, while Asia-Pacific registers the swiftest 11.36% CAGR supported by China’s national Safe Campus initiative and India’s Vidya Raksha program.
Note: Market size and forecast figures in this report are generated using Mordor Intelligence’s proprietary estimation framework, updated with the latest available data and insights as of 2026.
Global Education Security Market Trends and Insights
Drivers Impact Analysis*
| Driver | (~) % Impact on CAGR Forecast | Geographic Relevance | Impact Timeline |
|---|---|---|---|
| Real-time video analytics on campuses | +2.1% | Global-North America, Europe concentrated | Medium term (2-4 years) |
| Heightened school violence and vandalism | +2.8% | North America primary; Asia Pacific, Europe expanding | Short term (≤ 2 years) |
| Government safety grants | +2.3% | North America, Europe core; Asia Pacific emerging | Medium term (2-4 years) |
| Infrastructure modernisation in emerging economies | +1.9% | Asia Pacific core; Latin America and MEA spill-over | Long term (≥ 4 years) |
| AI-enabled behavioural detection | +1.7% | Global with early adoption in developed markets | Medium term (2-4 years) |
| ESG-linked safety KPIs | +1.2% | North America, Europe then global | Long term (≥ 4 years) |
| Source: Mordor Intelligence | |||


Surging Demand for Real-Time Video Analytics on Campuses
Institutions are replacing forensic playback with AI engines that identify weapons, perimeter breaches, and crowd anomalies in seconds. ZeroEyes exceeded 300 campus deployments by late 2025, and Omnilert’s VOLT AI integrates with existing cameras to automate alerts. U.S. schools logged 10 firearm possessions per 100,000 students in 2021-22, the highest level in a decade.[1]National Center for Education Statistics, “Indicators of School Crime and Safety 2023,” NCES.ed.gov Districts in Michigan and Texas installed AI gun-detection systems in February and July 2025, showing adoption even in rural jurisdictions. Edge processing minimizes bandwidth consumption for schools with limited bandwidth, while privacy-preserving algorithms comply with biometric restrictions in Illinois and Washington.
Heightened Incidence of School Violence and Vandalism
Active-shooter events and viral social-media threats have kept political scrutiny high despite a plateau in overall violent-incident counts. Forty-five percent of U.S. schools employed armed resource officers in 2021-22, down from 51% two years earlier, indicating a shift toward technology rather than personnel. Anonymous tip lines now cover 62% of schools, and behavioral-threat consulting engagements accelerated in 2025. ZeroEyes deployments in Michigan and Verkada installs in Texas underscore the push toward proactive systems that lower guard headcount while improving response times.
Government Safety Grants Accelerating Technology Refresh Cycles
The USD 73 million STOP School Violence and USD 83 million BJA pools, combined with FEMA’s USD 274.5 million Nonprofit Security Grant, compress procurement from years to months.[2]Federal Emergency Management Agency, “Nonprofit Security Grant Program FY2025,” FEMA.gov New Hampshire’s SAFE program layers another USD 10 million across fiscal 2026-2027. Vendors are co-investing: Eagle Eye Networks’ USD 1 million grant (November 2025) subsidizes cloud VMS migrations, and Omnilert’s Secure Schools Grants (June 2025) speed mass-notification rollouts. Grant-enabled upgrades shorten replacement intervals for analog cameras and DVRs, pulling forward demand.
Infrastructure Modernisation Programs in Emerging Economies
Asia-Pacific ministries weave safety systems into smart-campus budgets. Uttar Pradesh installed CCTV in 27,000 schools during 2024-2025. China’s Safe Campus mandate pairs AI cameras with visitor management nationwide. Singapore’s SafeSchools@SG integrates access control with first-responder coordination. Saudi Vision 2030 and UAE smart-school projects allocate capital toward integrated video, access, and cybersecurity platforms. Domestic manufacturing incentives favor local hardware suppliers and reduce import dependency.
Restraints Impact Analysis*
| Restraint | (~) % Impact on CAGR Forecast | Geographic Relevance | Impact Timeline |
|---|---|---|---|
| High upfront procurement and lifecycle costs | -1.8% | Global smaller districts hardest hit | Short term (≤ 2 years) |
| Privacy and data-protection concerns | -1.4% | North America, Europe, spreading worldwide | Medium term (2-4 years) |
| Disjointed physical-cybersecurity architectures | -0.9% | Global legacy installations | Medium term (2-4 years) |
| Skilled security-staff shortages | -0.7% | Global, acute in rural and suburban areas | Long term (≥ 4 years) |
| Source: Mordor Intelligence | |||
High Upfront Procurement and Lifecycle Costs
Deferred maintenance, declining enrollments, and curriculum technology compete with safety spending. Grants often cover initial cameras, but multi-year cloud subscriptions, software licensing, and cybersecurity monitoring inflate the total cost of ownership. Schools without grant access deploy piecemeal solutions-cameras without analytics or siloed access control-that complicate future integrations. Vendors offering modular, pay-as-you-grow platforms win contracts by matching budget realities.
Persistent Privacy and Data-Protection Concerns
FERPA in the United States and GDPR in Europe restrict biometric capture and data retention. Illinois and Washington require explicit parental consent for facial recognition, steering vendors toward object detection and gait analysis. The 108 disclosed K-12 cyberattacks in 2024 spotlighted risks of cloud-stored footage, leading some districts to mandate hybrid storage that keeps sensitive video on site.[3]Multi-State Information Sharing and Analysis Center, “K-12 Cybersecurity 2024,” cisecurity.org Vendors showcasing ISO 27001 compliance and transparent retention policies have a competitive edge.
*Our forecasts treat driver/restraint impacts as directional, not additive. The impact forecasts reflect baseline growth, mix effects, and variable interactions.
Segment Analysis
By Services: Strategic Consulting Accelerates as Guarding Dominates
Guarding services accounted for 37.71% of Education Security market share in 2025. However, consulting revenues are forecast to grow 10.73% annually, reflecting boards’ demand for holistic risk assessments, compliance audits, and Crime Prevention Through Environmental Design blueprints. The Education Security market size for consulting is rising as institutions outsource FERPA and biometric-law compliance to experts. Consulting firms bundle vulnerability scans, tabletop drills, and cybersecurity roadmaps that integrate AI cameras, Zero Trust networks, and emergency-notification platforms. Pre-employment background checks are expanding amid stricter child-safety statutes. Managed-services contracts that wrap guard scheduling, alarm monitoring, and incident-report analytics into a single SLA deepen client stickiness. Labor shortages and wage inflation squeeze guarding margins, prompting Allied Universal and Securitas to augment patrols with mobile dashboards that route AI alerts directly to officers’ smartphones.
The consulting uptrend signifies a maturing Education Security market in which administrators value measurable risk reduction over badge counts. Service providers that demonstrate return on security investment-lower incident rates, faster lockdown times, higher insurance-rating scores-win multi-year frameworks. Start-ups offering behavioral-health consulting and ESG-linked safety reporting tap white-space opportunities as universities tie executive compensation to campus security KPIs. As demand rises, global systems integrators are acquiring boutique advisory firms to package assessments with deployment, cementing end-to-end relationships that crowd out standalone guard contracts.


By Component: Software Surges While Hardware Anchors Emerging Regions
Hardware held 45.64% of Education Security market size in 2025, supported by camera, door-controller, and sensor rollouts in emerging economies. Yet software revenues are projected to climb at a 10.95% CAGR through 2031 as cloud video management, AI analytics, and mobile credentialing displace NVR racks and plastic IDs. Kisi’s Series B and Genea’s Series A fund expansion into subscription platforms that let administrators issue, revoke, and audit credentials remotely. Edge AI embedded in smart cameras shortens decision loops, allowing rural schools with limited bandwidth to deploy advanced analytics. Services revenue grows in lock-step because districts lacking in-house IT hire integrators for configuration, updates, and SOC monitoring.
In mature regions, perpetual hardware refresh gives way to recurring software and services contracts, boosting vendor lifetime value. Cisco’s Meraki MV portfolio and Johnson Controls’ OpenBlue suite bundle cameras with analytics licenses, locking customers into proprietary ecosystems. Conversely, Asia-Pacific governments still earmark budgets for large-scale camera installations, ensuring hardware’s share erodes gradually rather than precipitously. Vendors differentiating on open APIs and privacy-preserving edge processing capture mindshare among GDPR-constrained European buyers.
By Security Solution: Cybersecurity Outpaces Surveillance in Growth
Video surveillance dominated with 40.53% Education Security market share in 2025, but cybersecurity solutions are forecast to post an 11.02% CAGR, propelled by the CISA K-12 Cybersecurity Act and USD 114 million in sector losses tallied by FBI IC3 in 2024. Ransomware exploits unpatched VPNs in security-camera networks, motivating districts to adopt Zero Trust segmentation that walls off operational technology from student information systems. Mass notification platforms such as Omnilert, now live on 4,500 campuses, evolve into bidirectional tools that collect student-generated threat tips and provide responders with situational video feeds. Access control and emergency communications grow steadily as the FCC plans to update Kari’s Law, requiring direct 911 dialing from multi-line phone systems. Cyber-physical convergence drives institutions to procure bundled platforms that secure camera firmware, encrypt door-controller traffic, and provide SOC-as-a-Service dashboards.
Universities pilot Zero Trust micro-segmentation and MFA for VMS log-ins, aligning with Educause’s cybersecurity playbooks. The rising cybersecurity spend indicates that administrators increasingly equate downtime from malware with the reputational and safety fallout of an active-shooter incident, blending physical and digital defenses in budget planning.
By Deployment Mode: Cloud Gains Momentum, Hybrid Bridges Legacy
On-premise deployments represented 47.62% of Education Security market size in 2025, anchored by analog DVR fleets and locally hosted access-control servers. Cloud architectures are marching ahead at an 11.14% CAGR as administrators seek automatic updates, global search across campuses, and mobile dashboards that work without VPNs. Verkada’s contract with Taft ISD in July 2025 underscores small-district appetite for turnkey SaaS that eliminates server swaps every five years. Grant-backed subsidies from Eagle Eye Networks reduce migration friction and seed VMS trials.
Privacy rules spur hybrid models that keep high-resolution video on site and push hashed metadata to the cloud for AI training, balancing compliance with analytics richness. Institutions with thick capital investments in DVRs overlay cloud dashboards via ONVIF bridges, extending asset life while unlocking AI capabilities. Vendors that automate bandwidth throttling and AES-256 video encryption differentiate in risk-averse markets.
By Facilities: K-12 Growth Closes Gap with Higher Education Dominance
Higher education captured 42.19% Education Security market share in 2025 as sprawling campuses and dormitories require layered access control and indoor gun-detection sensors. Universities integrate safety systems with learning-management software, parking controls, and research-lab perimeter locks, creating complex, multi-site deployments that favor enterprise vendors. Tuskegee University’s November 2025 deployment of Honeywell AI-enabled access control illustrates how legacy facilities can leapfrog into edge analytics without wholesale rewiring.
Primary and secondary schools are forecast to surge at a 10.66% CAGR, propelled by STOP grants and state-mandated entry-point hardening. Vestibule retrofits, visitor-management kiosks, and automated lockdown buttons dominate RFPs. Districts bundle security with social-emotional learning budgets, financing behavioral-threat assessment teams that contract external psychologists. Vendors targeting rural schools emphasize cellular gateways and battery-backed edge recorders that operate during power outages. Other educational facilities-vocational institutes, tutoring centers-lag due to smaller budgets but represent a white-space play for low-cost cloud video kits.
Geography Analysis
The Education Security market continues to anchor its highest revenue in North America, where USD 156 million in combined federal STOP and FEMA block grants underwrote nearly 4,000 school projects during 2025. Urban districts in California and New York redeployed a portion of bond issuances toward AI video upgrades, tightening procurement timelines. Canadian provinces replicated grant mechanisms, accelerating cross-border standardization of VMS encryption and data-retention policies. Mexico’s Secretariat of Public Education piloted biometric-free object detection in 15 federal schools, catalyzing demand for GDPR-aligned solutions in Latin America.
Asia-Pacific remains the fastest-growing Education Security market, with governments bundling security infrastructure into e-learning and digital-literacy budgets. China’s Safe Campus decree mandates AI-enabled video in all primary and secondary schools by 2027, ensuring multi-year tailwinds for domestic camera manufacturers. India’s Vidya Raksha program channels state and federal funds to install visitor-management kiosks and electronic locks, while Singapore applies its SafeSchools@SG blueprint across public and private institutions. Japan’s Ministry of Education issued guidance in late 2025 requiring universities to segment OT from IT networks, spurring sales of cybersecurity appliances.
Europe’s adoption rate sits between North America’s maturity and Asia-Pacific’s expansion. GDPR compliance tempers rollouts that rely on biometrics, favoring privacy-preserving analytics. The United Kingdom’s impending Martyn’s Law compels evacuation-notification integrations, pushing universities to replace manual PA systems with cloud-triggered messaging that synchronizes with local constabularies. Southern European economies leverage EU resilience-fund grants to retrofit 1960s-era school buildings with IP cameras and reinforced entry vestibules. Scandinavia experiments with AI-driven crowd-density alerts in university commons to pre-empt harassment and vandalism.

Competitive Landscape
Global integrators, regional guarding firms, cloud-native start-ups, and component manufacturers collide in a moderately concentrated Education Security market. Allied Universal’s acquisition spree, capped by G4S, enables bundled guarding, design-build, and managed SOC services that appeal to districts lacking in-house expertise. Motorola Solutions integrates Rave Mobile Safety’s mass-notification platform with its radio hardware, allowing seamless voice-to-text alerts across handhelds and smartphones. Bosch, Axis Communications, and Hanwha Vision position privacy-compliant AI analytics as differentiators for GDPR-governed tenders.
Cloud-native disruptors, Verkada, Kisi, Genea, expand via SaaS licensing that converts five-year capex cycles into annual opex, burning down barriers for small districts. They add native API hooks that embed camera events into learning-management systems, streamlining alert workflows. Hikvision and Dahua dominate hardware in Asia-Pacific, leveraging domestic manufacturing cost advantages, yet face procurement bans in several Western markets over cybersecurity concerns. Johnson Controls’ OpenBlue and Cisco’s Meraki ecosystems lock institutions into vertically integrated stacks, trading ease of integration for vendor dependence.
Technology roadmaps pivot on AI inference at the edge, cross-camera tracking without PII, and Zero Trust network controls. Vendors race to attain ISO 27001 and SOC 2 certifications to calm privacy watchdogs. ESG-linked bonds push universities to select suppliers that can quantify carbon savings from cloud video versus on-premise servers, adding sustainability to RFP scoring. M&A is set to intensify as incumbents buy niche AI algorithm houses to fill portfolio gaps, while start-ups aggregate into platform roll-ups to reach global scale.
Education Security Industry Leaders
Cisco Systems Inc.
Honeywell International Inc.
Motorola Solutions Inc.
Securitas AB
Hangzhou Hikvision Digital Technology Co., Ltd.
- *Disclaimer: Major Players sorted in no particular order

Recent Industry Developments
- January 2026: Cisco launched edge-AI firmware for Meraki MV cameras that performs weapon detection locally, reducing cloud-round-trip latency for K-12 lockdown triggers.
- November 2025: Honeywell deployed AI-enabled smart access control at Tuskegee University, merging mobile credentials with real-time threat analytics.
- November 2025: Eagle Eye Networks introduced a USD 1 million grant to subsidize cloud VMS migrations for budget-constrained districts.
- August 2025: Acre Security completed cloud-based access control rollouts at three U.S. universities, integrating visitor management with dormitory locks.
- July 2025: Verkada signed Taft ISD in Texas for a district-wide camera and analytics deployment that removes on-site NVRs .
- May 2025: Gallagher unveiled mobile credential access tailored to campuses.


Global Education Security Market Report Scope
The education security market tracks revenue from security services across education facilities globally. The primary drivers include increasing demand for real-time surveillance and growing demand for cost-effective security solutions, and significant infrastructure developments.
The Education Security Market Report is Segmented by Services (Guarding, Pre-Employment Screening, Security Consulting, Systems Integration and Management, Alarm Monitoring Services, and Other Private Security Services), Component (Hardware, Software, and Services), Security Solution (Video Surveillance Systems, Access Control Systems, Emergency Communication Systems, and Cybersecurity Solutions), Deployment Mode (On-Premise, Cloud, and Hybrid), Facilities (Primary and Secondary Facilities, Higher Education Facilities, and Other Educational Facilities), and Geography (North America, South America, Europe, Asia-Pacific, Middle East, and Africa). The Market Forecasts are Provided in Terms of Value (USD).
| Guarding |
| Pre-Employment Screening |
| Security Consulting |
| Systems Integration and Management |
| Alarm Monitoring Services |
| Other Private Security Services |
| Hardware |
| Software |
| Services |
| Video Surveillance Systems |
| Access Control Systems |
| Emergency Communication Systems |
| Cybersecurity Solutions |
| On-Premise |
| Cloud |
| Hybrid |
| Primary and Secondary Facilities |
| Higher Education Facilities |
| Other Educational Facilities |
| North America | United States |
| Canada | |
| Mexico | |
| South America | Brazil |
| Argentina | |
| Rest of South America | |
| Europe | Germany |
| United Kingdom | |
| France | |
| Italy | |
| Spain | |
| Rest of Europe | |
| APAC | China |
| Japan | |
| India | |
| South Korea | |
| South-East Asia | |
| Rest of APAC | |
| Middle East | Saudi Arabia |
| United Arab Emirates | |
| Turkey | |
| Rest of Middle East | |
| Africa | South Africa |
| Nigeria | |
| Rest of Africa |
| By Services | Guarding | |
| Pre-Employment Screening | ||
| Security Consulting | ||
| Systems Integration and Management | ||
| Alarm Monitoring Services | ||
| Other Private Security Services | ||
| By Component | Hardware | |
| Software | ||
| Services | ||
| By Security Solution | Video Surveillance Systems | |
| Access Control Systems | ||
| Emergency Communication Systems | ||
| Cybersecurity Solutions | ||
| By Deployment Mode | On-Premise | |
| Cloud | ||
| Hybrid | ||
| By Facilities | Primary and Secondary Facilities | |
| Higher Education Facilities | ||
| Other Educational Facilities | ||
| By Geography | North America | United States |
| Canada | ||
| Mexico | ||
| South America | Brazil | |
| Argentina | ||
| Rest of South America | ||
| Europe | Germany | |
| United Kingdom | ||
| France | ||
| Italy | ||
| Spain | ||
| Rest of Europe | ||
| APAC | China | |
| Japan | ||
| India | ||
| South Korea | ||
| South-East Asia | ||
| Rest of APAC | ||
| Middle East | Saudi Arabia | |
| United Arab Emirates | ||
| Turkey | ||
| Rest of Middle East | ||
| Africa | South Africa | |
| Nigeria | ||
| Rest of Africa | ||


Key Questions Answered in the Report
What is the projected value of the Education Security market by 2031?
It is forecast to reach USD 1.82 billion by 2031, expanding at a 10.6% CAGR over 2026-2031.
Which service segment is growing fastest in education security?
Security consulting leads growth at a 10.73% CAGR as schools seek behavioral assessment and compliance expertise.
Why are cloud deployments gaining share in school security?
Cloud VMS and access control cut server maintenance costs, offer remote management, and benefit from grant-funded migration subsidies.
How is cybersecurity spending changing in educational institutions?
Cybersecurity solutions are set to grow at 11.02% CAGR, driven by ransomware threats and the CISA K-12 Cybersecurity Act.
Which region will record the highest growth rate to 2031?
Asia-Pacific leads with an 11.36% CAGR, propelled by China’s Safe Campus law and India’s Vidya Raksha program.
What technologies are schools adopting to manage privacy constraints?
Districts favor analytics that detect weapons or crowd anomalies without facial recognition, complying with FERPA and GDPR limits.
Page last updated on:


