Edible Flowers Market Size and Share
Market Overview
| Study Period | 2021 - 2031 |
|---|---|
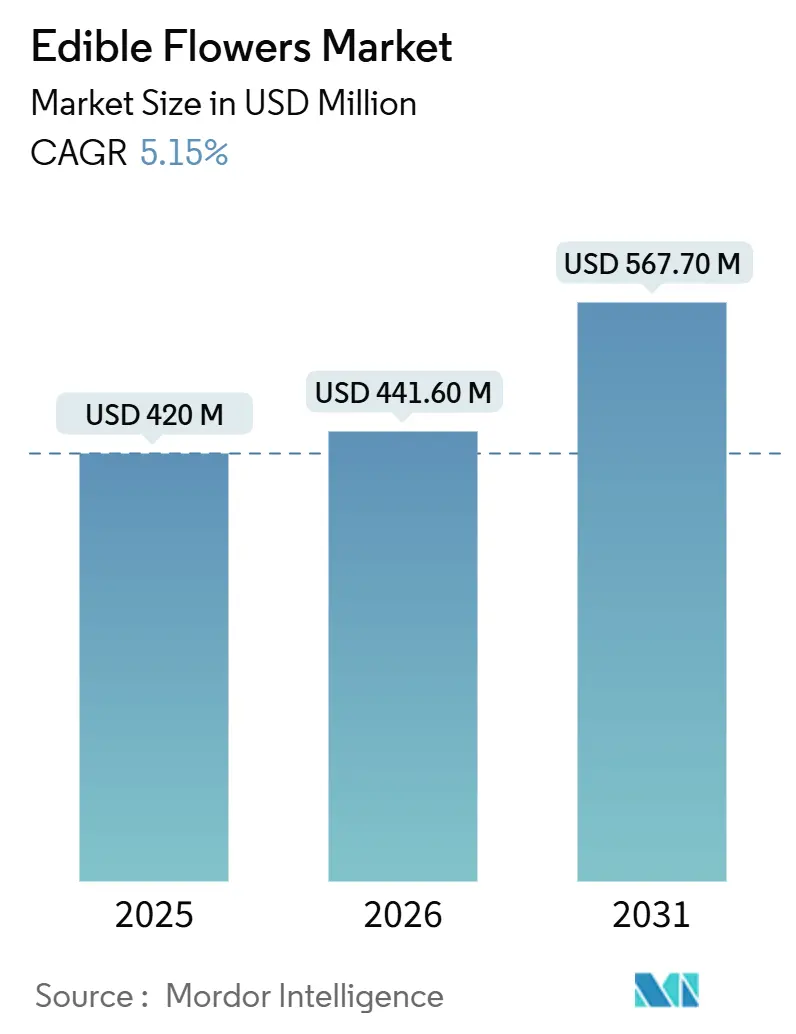
| Market Size (2026) | USD 441.60 Million |
| Market Size (2031) | USD 567.70 Million |
| Growth Rate (2026 - 2031) | 5.15% CAGR |
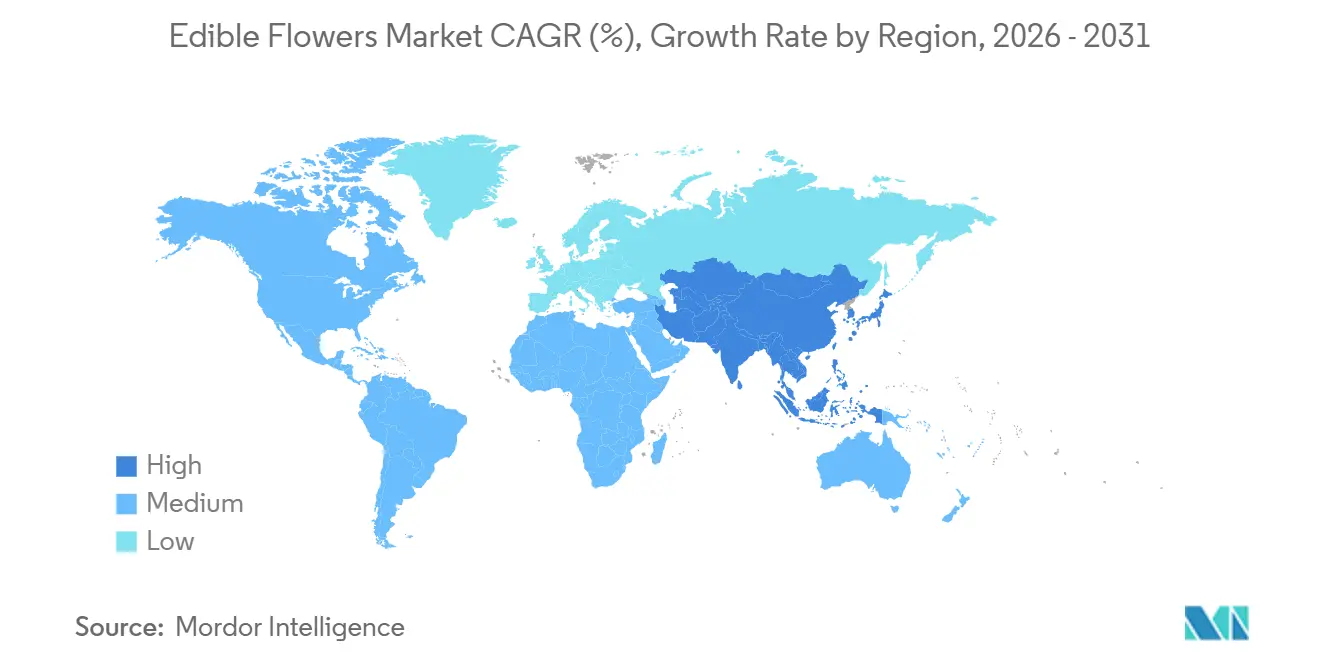
| Fastest Growing Market | Asia Pacific |
| Largest Market | Europe |
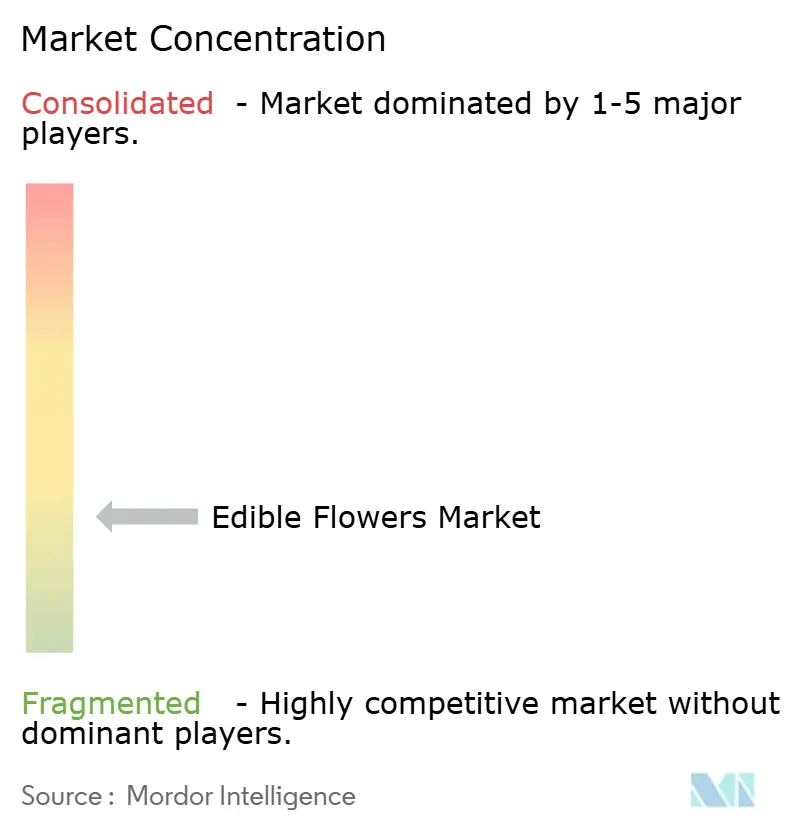
| Market Concentration | Low |
Major Players *Disclaimer: Major Players sorted in no particular order Image © Mordor Intelligence. Reuse requires attribution under CC BY 4.0. | |
Edible Flowers Market Analysis by Mordor Intelligence
The edible flowers market size is projected to be USD 420 million in 2025, USD 441.6 million in 2026, and reach USD 567.7 million by 2031, growing at a CAGR of 5.15% from 2026 to 2031. Heightened demand for clean-label plate décor, federal and supranational organic subsidies, and functional-food innovation is expanding the edible flowers market beyond boutique restaurants into mainstream retail. Plasma-based shelf-life extension is reducing logistics costs for fresh petals, while blockchain-provenance tokens are adding storytelling value that supports premium pricing in luxury foodservice. Functional-beverage formulators are driving a shift toward marigold and hibiscus, catalyzing uptake in the Asia-Pacific region, where zero-alcohol and low-sugar drinks dominate convenience channels. Private-equity investment in scalable greenhouse platforms signals confidence that the edible flowers market can capture white-space opportunities in off-trade retail and nutraceutical extraction.
Key Report Takeaways
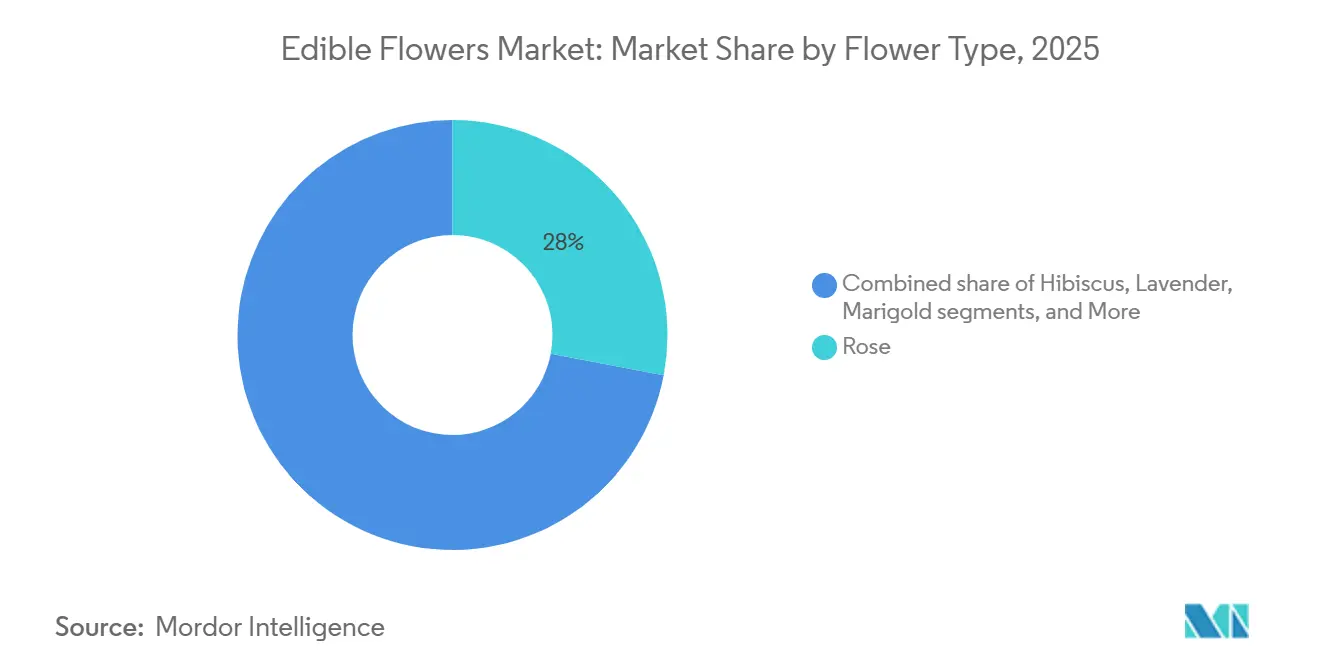
- By flower type, roses accounted for the largest share, representing 28% of the edible flowers market in 2025, while marigolds are projected to be the fastest-growing segment with 6.8% CAGR during 2026-2031.
- By form, fresh formats held the largest share, comprising 63% of the edible flowers market in 2025, whereas the dried form is anticipated to be the fastest-growing segment with a CAGR of 7.9% from 2026 to 2031.
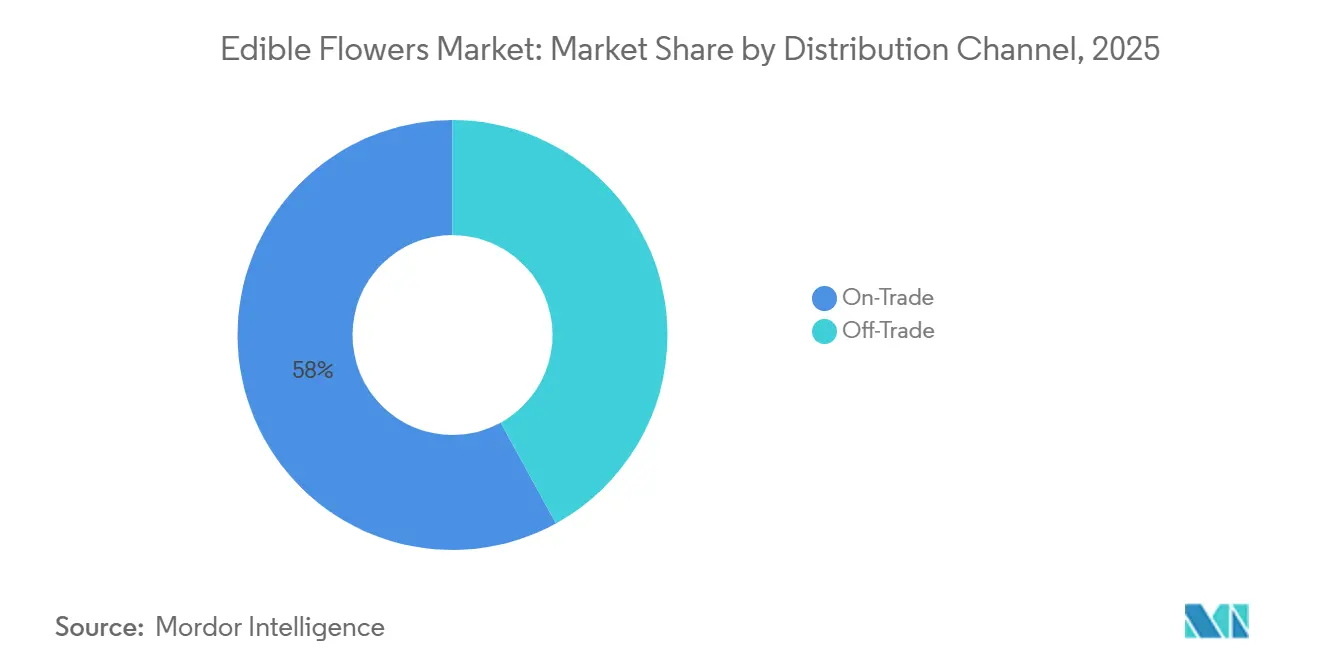
- By distribution channel, on-trade venues accounted for the largest share, making up 58% of the edible flowers market in 2025, while off-trade channels are anticipated to be the fastest-growing segment with a 9.3% CAGR during 2026-2031.
- By geography, Europe held the largest share, contributing 34% of the edible flowers market in 2025, while the Asia-Pacific region is forecasted to be the fastest-growing market with a CAGR of 7.5% from 2026 to 2031.
Note: Market size and forecast figures in this report are generated using Mordor Intelligence’s proprietary estimation framework, updated with the latest available data and insights as of January 2026.
Global Edible Flowers Market Trends and Insights
Drivers Impact Analysis*
| Driver | (~) % Impact on CAGR Forecast | Geographic Relevance | Impact Timeline |
|---|---|---|---|
| Clean-label demand shifting from synthetic to natural plate decor | +1.2% | North America, Europe, and global spillover | Medium term (2-4 years) |
| Organic subsidies lowering floriculture conversion costs | +0.9% | North America, Europe, and emerging Asia-Pacific | Long term (≥ 4 years) |
| Functional-food trends expanding petals into teas, snacks, and nutraceuticals | +0.8% | Asia-Pacific, North America, and global | Medium term (2-4 years) |
| Plasma sterilization extending shelf life and reducing air freight | +0.6% | Europe, North America, and global | Medium term (2-4 years) |
| Cruise tourism rebound boosting demand for visually appealing dishes | +0.5% | North America, Europe, and Asia-Pacific cruise hubs | Short term (≤ 2 years) |
| Blockchain authentication strengthening origin traceability in premium segments | +0.3% | North America, Europe, and Middle East pilots | Short term (≤ 2 years) |
| Source: Mordor Intelligence | |||
Clean-Label Demand Shifting from Synthetic to Natural Plate Decor
Premium restaurants are replacing synthetic dyes with nasturtium, pansy, and hibiscus petals to satisfy diners who scan ingredient lists on mobile apps at the table. Michelin-ranked kitchens in Bangkok and New York showcased rooftop-grown flowers during 2026 dining events, demonstrating that culinary credibility now hinges on visible freshness and traceability. Analytical profiling of seven petals used in Madeira’s fine-dining scene linked geraniol, linalool, and isothiocyanates to distinctive flavor layers that chefs exploit instead of processed extracts. Retailers are aligning with this trend by offering small packs of organic edible flowers marketed as an "affordable luxury," with influencers promoting floral plating concepts. Growers who use organic or Veriflora-certified practices gain advantages, such as prioritized placement on restaurant procurement lists and in specialty produce sections.
Organic Subsidies Lowering Floriculture Conversion Costs
Targeted funding is accelerating acreage conversion. The USDA disbursed USD 72.9 million in Specialty Crop Block Grants during fiscal 2025 and unlocked another USD 1 billion of Assistance for Specialty Crop Farmers in February 2026, directly covering organic certification and cold-chain upgrades for edible-flower growers[1]Source: USDA, “Specialty Crop Block Grant Awards,” usda.gov. In the European Union, Common Agricultural Policy payments cushion the two-year yield dip while growers transition Provence lavender and Italian rose fields to pesticide-free specification. Regulatory clarity is improving in tandem. The U.S. Food and Drug Administration’s (FDA's) 2025 approval of butterfly pea flower extract as a color additive created a template for other species to pursue Generally Recognized as Safe (GRAS) status, further reducing perceived compliance risk.
Functional-Food Trends Expanding Petals into Teas, Snacks, and Nutraceuticals
Anthocyanin-rich hibiscus, lutein-dense marigold, and polyphenol-packed rose are migrating into drinks, snacks, and dietary supplements that promise antioxidant, eye-health, or stress-relief benefits. Asia-Pacific accounts for a substantial portion of global functional beverage consumption, exemplified by ready-to-drink chrysanthemum teas available in convenience channels, which demonstrate the adaptation of traditional botanicals into modern zero-sugar formulations. Ingredient suppliers standardize extract specifications, enabling emerging brands to outsource processing and opening the edible flowers market to firms that lack in-house botanical expertise[2]Source: BIO Web of Conferences, “Optimizing Chrysanthemum Tea Formulation,” biowebconference.org.
Plasma Sterilization Extending Shelf Life and Reducing Air-Freight
Cold plasma treatment eliminates >98% of surface microbes without raising product temperature, extending fresh-petal life to 7 days, and enabling ocean freight on lanes that historically required air. Modular plasma units have been installed in packing houses across Europe and North America to comply with retailer requirements, minimizing shrink rates and enhancing product handling efficiency. Regulatory agencies are reviewing flower-specific parameters to confirm that plasma does not degrade anthocyanins or lutein, a prerequisite for functional-ingredient applications.
Restraints Impact Analysis*
| Restraint | (~) % Impact on CAGR Forecast | Geographic Relevance | Impact Timeline |
|---|---|---|---|
| High perishability increasing cold-chain costs and limiting retail reach | -0.7% | Asia-Pacific, Africa, and global | Medium term (2-4 years) |
| Fragmented regulations raising compliance burden in export markets | -0.5% | European Union-to-Asia, and North America | Long term (≥ 4 years) |
| Pollinator loss from monocropping reducing yield stability | -0.4% | Europe, Africa, and South America | Long term (≥ 4 years) |
| Consumer hesitation in price-sensitive markets limiting adoption | -0.3% | Asia-Pacific, Middle East, Africa, and South America | Medium term (2-4 years) |
| Source: Mordor Intelligence | |||
High Perishability Increasing Cold-Chain Costs and Limiting Retail Reach
Fresh petals have a limited shelf life of 2°C–4°C, necessitating swift transportation and specialized cold-chain logistics, unlike the more stable dried forms. This leads to greater handling complexity, higher product losses, and operational difficulties in retail settings. Although technologies like IoT sensors have enhanced temperature monitoring, they introduce additional costs that smaller producers often struggle to manage. Unless preservation technologies improve significantly or dried formats achieve wider acceptance, cold-chain limitations are anticipated to restrict large-scale market growth.
Fragmented Regulations Raising Compliance Burden in Exports Markets
The European Food Safety Authority (EFSA) published a significant risk assessment in December 2024[3]Source: EFSA, “Microbiological Hazards in Edible Flowers,” efsa.europa.eu. However, member states continue to establish varying pesticide tolerances and species lists, creating challenges for exporters. Meanwhile, the U.S. Food and Drug Administration (FDA)’s Generally Recognized as Safe (GRAS) process requires costly toxicology dossiers for each petal species, often taking up to 18 months. Japan’s positive-list approach excludes numerous flowers permitted in Europe, compelling growers to navigate country-specific regulations that tend to benefit vertically integrated companies with larger regulatory budgets.
*Our forecasts treat driver/restraint impacts as directional, not additive. The impact forecasts reflect baseline growth, mix effects, and variable interactions.
Segment Analysis
By Flower Type: Rose Dominance Masks Marigold’s Functional Surge
Rose accounted for the largest share of 28% of the edible flowers market in 2025, driven by heirloom varieties valued for their fragrance in culinary applications. Marigold is the fastest-growing segment, projected to expand at a 6.8% CAGR during 2026-2031, well above the 5.15% growth rate of the edible flowers market, as lutein-dense petals appeal to producers of vision-health supplements. Hibiscus commands mid-tier volume via ready-to-drink teas that leverage tart flavor and anthocyanin claims, whereas lavender sustains premium-price segments tied to Provence appellation controls and aroma therapy crossover.
Breeders are now optimizing marigold genetics for dual-purpose color and 20 mg lutein per dry gram, narrowing the historic price gap versus rose. Rose growers are increasingly utilizing blockchain-based systems to verify single-estate provenance and enhance premium positioning within restaurant channels. Hibiscus supply chains are experiencing commodity pressure as lower-cost regions compete with established producers, while concerns about pollinators may restrict the expansion of lavender cultivation. Nasturtium is gaining popularity in vertical farming due to its microgreen-like flavor profile. Meanwhile, pansy and viola remain favored in restaurants, though their limited shelf life continues to hinder growth in the retail market.


By Form: Plasma Technology Narrows Fresh’s Logistics Advantage
Fresh flowers accounted for the largest share, representing 63% of the edible flowers market in 2025. This dominance is attributed to strong demand from chefs who prioritize intact color and aroma profiles, which are challenging to replicate in dried formats. The dried segment is anticipated to be the fastest-growing, with a projected CAGR of 7.9% during 2026-2031. This growth is driven by advantages such as longer shelf life and easier handling. Fresh formats, however, continue to face challenges in retail due to higher perishability. Innovations like plasma sterilization are helping to extend shelf life and enhance logistics efficiency, addressing some of these challenges.
Dried and powdered forms eliminate refrigeration, enabling shelf-stable teas and nutraceutical blends that tap functional-food trends. Asia-Pacific, already comfortable with chrysanthemum teas, is the epicenter of dried expansion. In North America, smoothie mix brands that use freeze-dried hibiscus are experiencing strong sales growth. Regulatory agencies are still refining particle-size standards and allergen testing for powders. Still, wider approvals look likely as the U.S. Food and Drug Administration (FDA) and the European Food Safety Authority (EFSA) finalize guidance modeled on 2025 butterfly pea precedents[4]Source: USDA, “Butterfly Pea Color Additive Petition,” usda.gov.
By Distribution Channel: Off-Trade Gains as Grocers Solve Cold-Chain Economics
On-trade channels held the largest share of 58% of the edible flowers market in 2025. Off-trade retail channels are projected to be the fastest-growing segment at 9.3% CAGR through 2026-2031, reflecting grocery adoption of refrigerated micro-produce cases. Vertical-farm suppliers near urban hubs deliver same-day petals that shrink spoilage and introduce home cooks to luxury plating cues popularized on social media. Dried SKUs occupy ambient herbal-tea and spice aisles, giving category managers a low-risk entry that bypasses cold logistics.
The future of channel dynamics depends on the ability of plasma-treated fresh produce to retain visual quality throughout a seven-day shelf life under commercial retail conditions. If successful, off-trade channels could expand further, potentially reducing foodservice's dominance, particularly as labor-constrained restaurants increasingly focus on garnish costs and operational efficiency. However, if regulatory or sensory issues hinder the adoption of plasma treatment, dried formats are projected to gain a larger share in off-trade channels.
Geography Analysis
Europe held the largest share of 34% of the edible flowers market size in 2025, supported by a well-established regulatory and retail framework. The European Food Safety Authority (EFSA) has progressively clarified safety assessments for edible botanicals, facilitating broader commercialization across member states, despite variations in country-specific pesticide tolerances[5]Source: EFSA, “Edible Flowers Risk Assessment,” efsa.europa.eu. Demand in the region is bolstered by premium retail formats, a strong presence of organic products, and the incorporation of edible flowers into high-end culinary applications. Additionally, the region benefits from established cold-chain infrastructure and proximity between growers and end markets, which helps maintain product quality. This has allowed fresh formats to dominate the market while also fostering innovation in value-added products such as powders and extracts.
The Asia-Pacific region is the fastest-growing market, with a CAGR of 7.5% projected through 2026-2031. Growth is driven by increasing urban consumption and the cultural familiarity of floral ingredients in food and beverages. Countries like Japan and those in Southeast Asia benefit from established culinary traditions, although fragmented regulatory pathways and country-specific approval systems influence commercialization strategies. The rapid expansion of modern retail and e-commerce platforms is improving accessibility to both fresh and dried edible flowers. Simultaneously, local production ecosystems are advancing, with controlled-environment agriculture and contract farming models ensuring consistent quality and year-round supply.
In other regions, including North America, South America, and the Middle East & Africa, the edible flowers market is developing at varying rates, shaped by differences in regulatory frameworks and consumer awareness. In North America, the U.S. Food and Drug Administration (FDA) oversees approvals through frameworks such as Generally Recognized as Safe (GRAS), which can delay the introduction of new flower species due to stringent safety documentation requirements. South America is increasingly emerging as a supply base, leveraging favorable growing conditions and export-oriented production. Meanwhile, the Middle East & Africa are experiencing niche adoption, primarily driven by premium hospitality and tourism sectors. Across these regions, market growth is closely linked to regulatory clarity, supply chain development, and efforts to educate consumers on culinary applications.

Competitive Landscape
The edible flowers market demonstrates low concentration in 2025, with leading companies including Fresh Origins, LLC, Koppert Cress B.V., Farm.One Holdings, Inc., The Chef’s Garden, Inc., and Duncan Family Farms, LLC. These companies emphasize vertical integration, managing operations from propagation to packaging. They secure premium culinary clients by offering exclusive varieties, consistent quality, and rapid delivery models tailored to high-end foodservice needs. Recent investments indicate growing interest in controlled-environment agriculture assets, particularly those serving both ornamental and culinary markets, highlighting the sector's appeal to institutional investors.
Technology adoption is a significant factor distinguishing leading and emerging players. Koppert Cress B.V. utilizes geothermal heating to reduce reliance on natural gas in greenhouse operations, aligning with European sustainability mandates. Additionally, innovations like blockchain-enabled traceability are gaining momentum, enabling producers to certify product provenance and quality at the packaging level. Controlled-environment agriculture methods, such as vertical farming and hydroponics, are expanding, especially near urban centers, to ensure fresher supply and lower logistics costs. Mid-tier companies, including Cherry Valley Organics, LLC, Nosh Produce, and Greeneration, focus on niche markets by offering organically certified and specialty varieties designed for premium restaurant demand.
White-space opportunities are emerging in grocery retail expansion and functional ingredient extraction. Retail penetration is currently limited by perishability and shrink rates, but advancements in post-harvest technologies and localized sourcing models are anticipated to enhance shelf stability and distribution efficiency. Simultaneously, ingredient-focused companies such as Mountain Rose Herbs, Bloom Culinary Flowers Ltd., and Gourmet Sweet Botanicals are scaling the procurement of flowers like marigold and hibiscus for pigment and nutraceutical extraction. This shift toward processed applications reduces reliance on fresh formats and creates a complementary revenue stream, potentially expanding the overall market opportunity in the coming years.
Edible Flowers Industry Leaders
Fresh Origins, LLC
Koppert Cress B.V.
Farm.One Holdings, Inc.
The Chef’s Garden, Inc.
Duncan Family Farms, LLC
- *Disclaimer: Major Players sorted in no particular order

Recent Industry Developments
- April 2024: BoomaFood (Australia), an Indigenous-owned company, established an indoor vertical farm in NSW. Using CubicFarms technology, the company emphasizes sustainable, year-round production of leafy greens and aims to incorporate native herbs and edible flowers.
- March 2024: The Dja Dja Wurrung Clans Aboriginal Corporation (DJAARA) has established a native food and fibre enterprise, DJAKITJ, aimed at cultivating, researching, and commercializing traditional native ingredients. The venture specializes in cultivating bush tucker, including native edible flowers, yam daisies (Murnong), and kangaroo grass.
- April 2023: Farm.One, a hydroponic indoor vertical farming business known for its premium salad greens, specialty herbs, edible flowers, and microgreens, has reopened its Neighborhood Farm in Prospect Heights, Brooklyn, following the acquisition of long-term expansion financing from DK-Bell Holding Company.


Global Edible Flowers Market Report Scope
The edible flowers market refers to the production and distribution of flowers that are safe for human consumption, primarily used in culinary and food-related applications. The edible flowers market report is segmented by flower type (rose, hibiscus, lavender, marigold, pansy and viola, nasturtium, and other flower types), by form (fresh, dried, and powders), by distribution channel (off-trade and on-trade), and by geography (North America, South America, Europe, Asia-Pacific, Middle East, and Africa). The market forecasts are provided in terms of value (USD).
| Rose |
| Hibiscus |
| Lavender |
| Marigold |
| Pansy and Viola |
| Nasturtium |
| Other Flower Types |
| Fresh |
| Dried |
| Powders |
| On-Trade |
| Off-Trade |
| North America | United States |
| Canada | |
| Mexico | |
| Rest of North America | |
| South America | Brazil |
| Argentina | |
| Rest of South America | |
| Europe | Germany |
| France | |
| Italy | |
| United Kingdom | |
| Russia | |
| Rest of Europe | |
| Asia-Pacific | China |
| Japan | |
| India | |
| Australia | |
| New Zealand | |
| South Korea | |
| Rest of Asia-Pacific | |
| Middle East | United Arab Emirates |
| Saudi Arabia | |
| Rest of Middle East | |
| Africa | South Africa |
| Kenya | |
| Rest of Africa |
| By Flower Type | Rose | |
| Hibiscus | ||
| Lavender | ||
| Marigold | ||
| Pansy and Viola | ||
| Nasturtium | ||
| Other Flower Types | ||
| By Form | Fresh | |
| Dried | ||
| Powders | ||
| By Distribution Channel | On-Trade | |
| Off-Trade | ||
| By Geography | North America | United States |
| Canada | ||
| Mexico | ||
| Rest of North America | ||
| South America | Brazil | |
| Argentina | ||
| Rest of South America | ||
| Europe | Germany | |
| France | ||
| Italy | ||
| United Kingdom | ||
| Russia | ||
| Rest of Europe | ||
| Asia-Pacific | China | |
| Japan | ||
| India | ||
| Australia | ||
| New Zealand | ||
| South Korea | ||
| Rest of Asia-Pacific | ||
| Middle East | United Arab Emirates | |
| Saudi Arabia | ||
| Rest of Middle East | ||
| Africa | South Africa | |
| Kenya | ||
| Rest of Africa | ||


Key Questions Answered in the Report
How large will global demand for edible petals be by 2031?
The edible flowers market size is projected to reach USD 567.7 million by 2031 on a 5.15% CAGR through 2026-2031.
Which flower type is gaining the most momentum after rose?
Marigold is accelerating at a 6.8% CAGR through 2026-2031 because lutein content aligns with eye-health supplement demand.
Why are grocers now adding flowers next to microgreens?
Plasma-extended shelf life and near-farm vertical production cut spoilage, letting retailers stock clamshells that consumers buy as affordable luxuries.
What technology reduces petal spoilage without chemicals?
Non-thermal plasma sterilization removes more than 98% surface microbes, pushing fresh-petal life to seven days under cold storage.
Page last updated on:


