Edible Insects Market Size and Share
Market Overview
| Study Period | 2021 - 2031 |
|---|---|
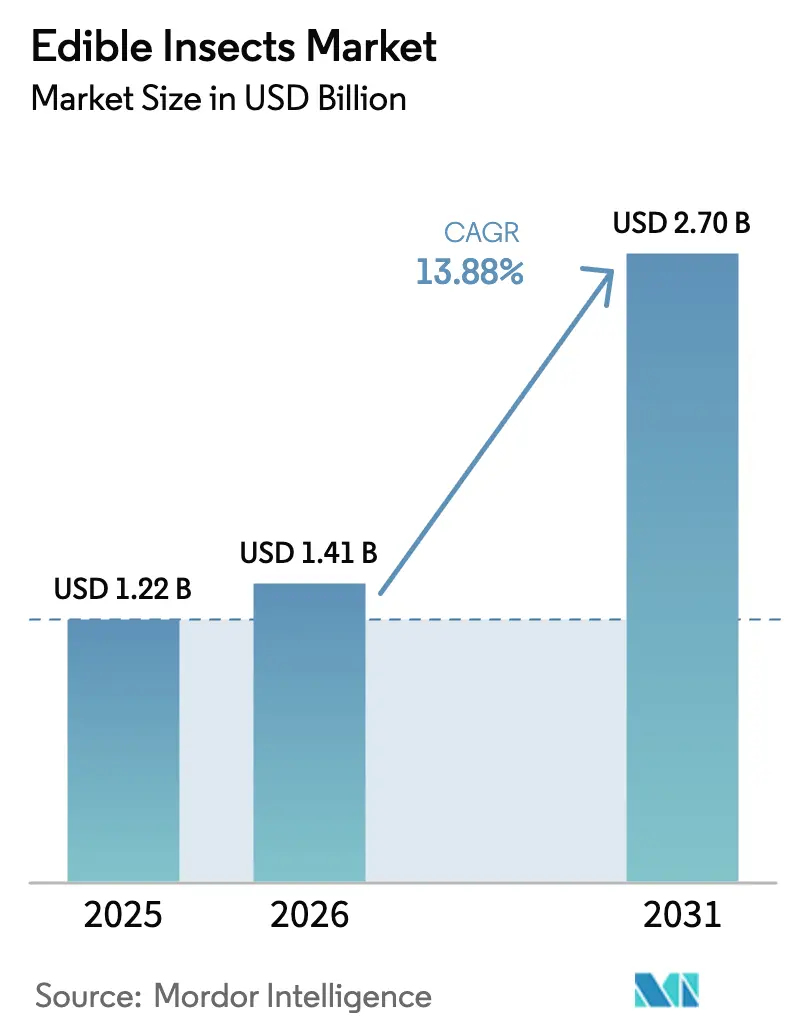
| Market Size (2026) | USD 1.41 Billion |
| Market Size (2031) | USD 2.70 Billion |
| Growth Rate (2026 - 2031) | 13.88% CAGR |
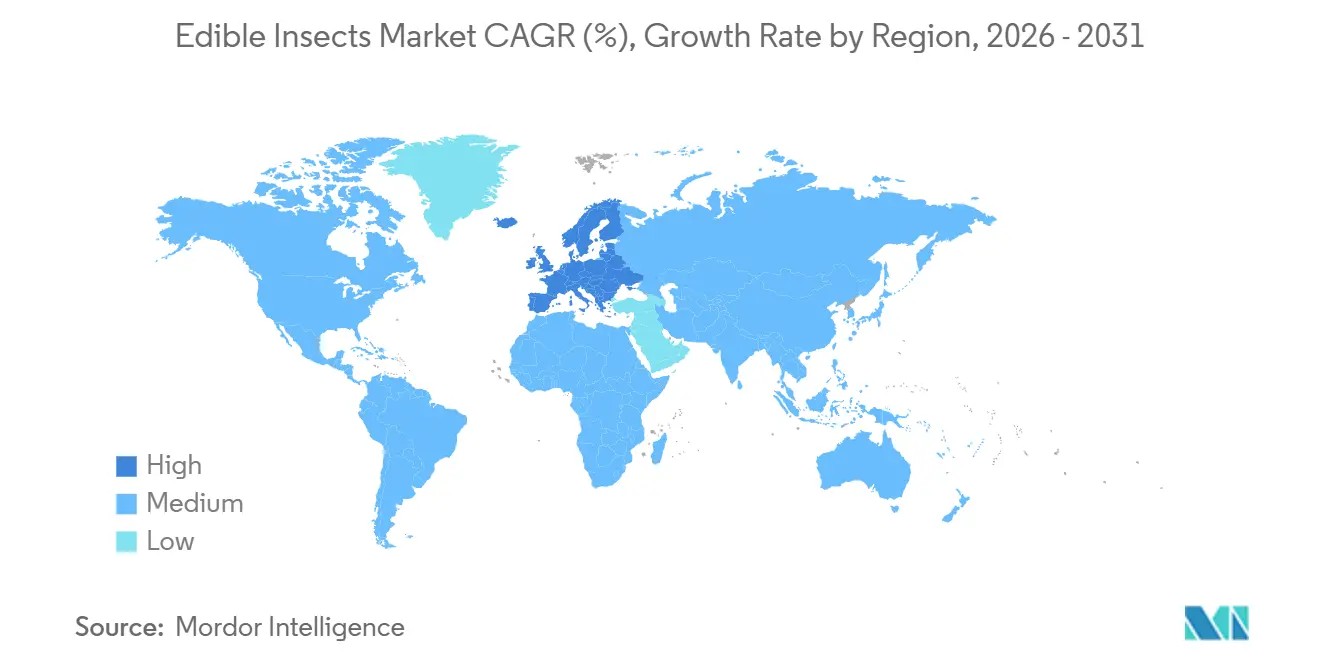
| Fastest Growing Market | Middle East |
| Largest Market | Europe |
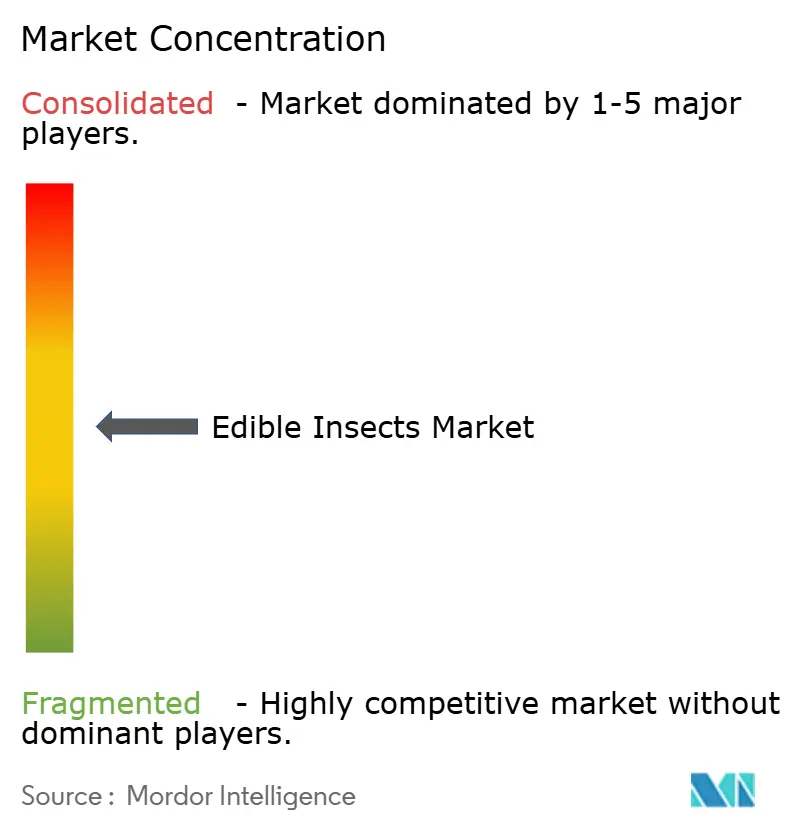
| Market Concentration | Medium |
Major Players *Disclaimer: Major Players sorted in no particular order Image © Mordor Intelligence. Reuse requires attribution under CC BY 4.0. | |
Edible Insects Market Analysis by Mordor Intelligence
The edible insects market size is projected to expand from USD 1.22 billion in 2025 and USD 1.41 billion in 2026 to USD 2.70 billion by 2031, registering a CAGR of 13.88% between 2026 to 2031. Cost-pressured feed mills, widening sustainability mandates, and rapid regulatory approvals for black soldier fly and mealworm proteins are steering the edible insect market toward mainstream adoption. Producers are scaling vertically integrated plants that co-locate larvae with food waste streams, while retailers are adding low-carbon protein thresholds to supplier contracts. Capital now flows from diversified agribusiness firms that view insect protein as a hedge against volatile fish meal and soy meal prices, reinforcing the credibility of the edible insect market among risk-averse aquaculture, poultry, and pet food buyers.
Key Report Takeaways
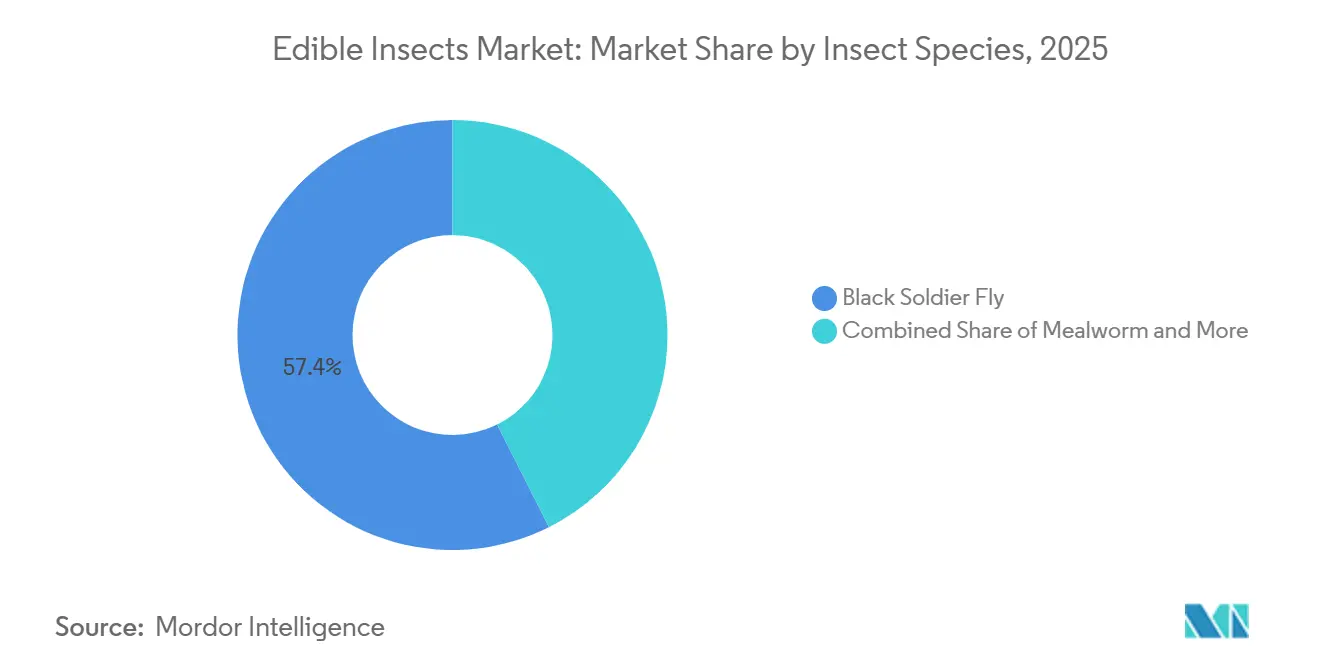
- By insect species, black soldier fly larvae held 57.4% of the edible insects market size in 2025 and are projected to expand at an 11.0% CAGR through 2031.
- By product form, protein meal led with 42.5% of the edible insects market size in 2025, while insect oil is forecast to grow at a 10.2% CAGR between 2026 and 2031.
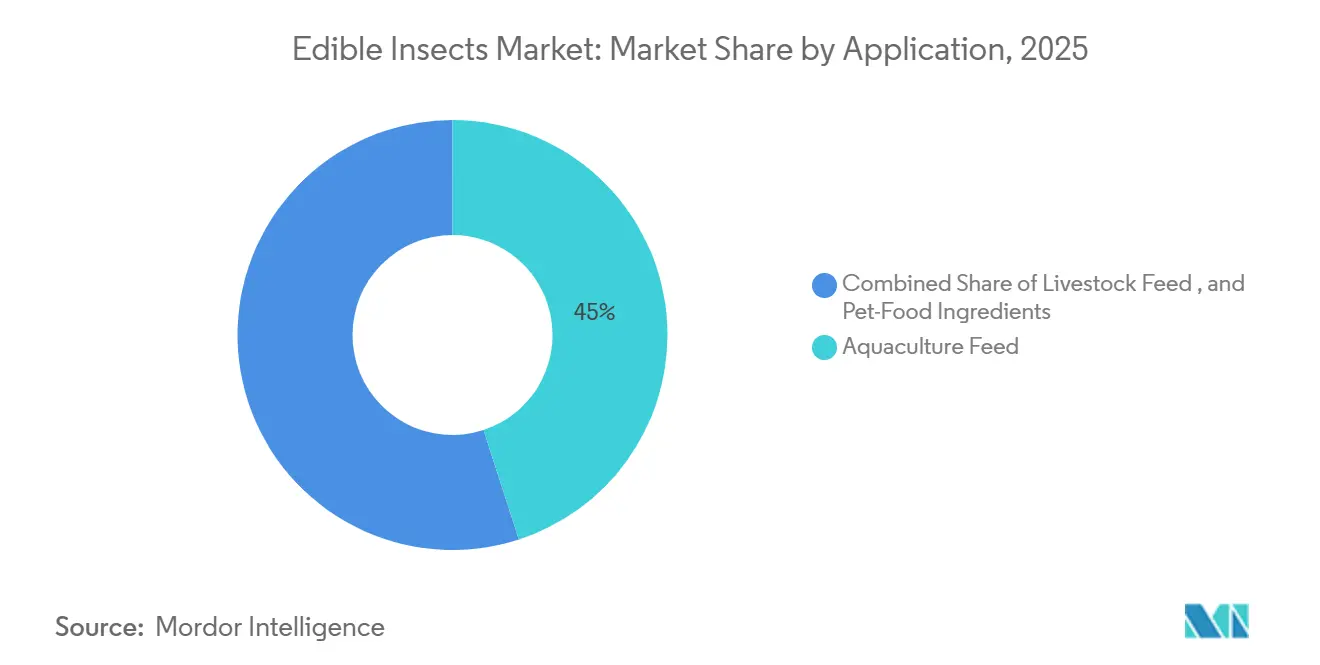
- By application, aquaculture feed accounted for 45.0% of the edible insects market size in 2025, whereas pet food ingredients are advancing at a 9.4% CAGR to 2031.
- By geography, Europe held 55% of the edible insects market share in 2025, and the Middle East is projected to lead regional growth at an 8.0% CAGR through 2031.
Note: Market size and forecast figures in this report are generated using Mordor Intelligence’s proprietary estimation framework, updated with the latest available data and insights as of January 2026.
Global Edible Insects Market Trends and Insights
Drivers Impact Analysis*
| Driver | (~) % Impact on CAGR Forecast | Geographic Relevance | Impact Timeline |
|---|---|---|---|
| Regulatory approval for black soldier fly (BSF) meal in poultry and swine diets | +3.5% | North America and Europe | Short term (≤ 2 years) |
| Escalating fish meal and soy meal prices pressuring feed margins | +3.0% | Asia-Pacific and Europe | Medium term (2–4 years) |
| Growing pet humanization boosting demand for premium insect protein | +2.5% | North America and Europe | Medium term (2–4 years) |
| Carbon credit monetization from organic-waste upcycling | +2.0% | Middle East and Africa | Long term (≥ 4 years) |
| Retailer Scope-3 mandates favoring low-footprint feed ingredients | +2.0% | Europe and North America | Medium term (2–4 years) |
| Emerging circular bioeconomy subsidies for on-farm live larvae systems | +1.5% | Europe and the Middle East | Long term (≥ 4 years) |
| Source: Mordor Intelligence | |||
Regulatory Approval for Black Soldier Fly (BSF) Meal in Poultry and Swine Diets
In August 2024, the United States Association of American Feed Control Officials finalized ingredient definitions for dried black soldier fly larvae in broiler, layer, and swine diets. This removed the final federal barrier to commercial inclusion rates of up to 10% in complete feeds. The decision followed a two-year review of a safety dossier, which confirmed no mycotoxin accumulation or heavy metal bioconcentration when larvae are reared on pre-consumer food waste[1]Source: Association of American Feed Control Officials, “Ingredient Definitions,” aafco.org. Canada’s Canadian Food Inspection Agency approved the use of black soldier fly meal under its feed registration system, enabling cross-border supply chains and allowing United States producers to supply Ontario and Quebec poultry integrators. In March 2025, the European Union extended its 2021 authorization for processed insect protein in aquaculture to include poultry and pig feeds, contingent upon the implementation of traceability protocols to prevent contamination with bovine or porcine protein.
Escalating Fish Meal and Soy Meal Prices Pressuring Feed Margins
Fish meal spot prices reached USD 1,606 per metric ton in the first quarter of 2024 due to El Niño-related anchovy catch declines off the Peruvian coast. Prices later moderated to USD 1,335 per metric ton in the first quarter of 2025 as La Niña conditions restored biomass. Structural volatility persists due to climate-driven recruitment failures and quota reductions by the Peruvian Ministry of Production. Soy meal prices have also fluctuated, with United States Gulf export quotes averaging USD 420 per metric ton in 2024 and USD 450 per metric ton in early 2025, driven by tight South American supplies and strong Chinese import demand. These price dynamics are reshaping procurement strategies, with feed mills increasingly viewing insect protein as a risk mitigation tool. Insect protein is now being incorporated into least-cost formulation models as a capped hedge against marine protein shortages.
Growing Pet Humanization Boosting Demand for Premium Insect Protein
Premium pet food brands are leveraging insect protein as a hypoallergenic, single-source animal protein, appealing to pet owners seeking novel ingredients for dogs with food sensitivities. In 2024, Nestlé Purina expanded its insect-based product line in North America, introducing a black soldier fly larvae meal formula under its Beyond brand, priced at a 25% premium compared to chicken-based equivalents. The company targets the estimated 15% of United States dog owners reporting adverse food reactions. The pet food market is less price-sensitive than the livestock feed market, enabling insect protein producers to achieve gross margins in aquaculture applications. Ynsect, which shifted its focus from fish feed to pet food following its 2024 restructuring, secured a USD 54 million credit facility in October 2024 to scale mealworm production for its Sprÿng brand. This brand is now distributed in over 3,000 pet specialty retailers across Europe.
Carbon Credit Monetization from Organic-Waste Upcycling
Insect farming operations that process pre-consumer food waste are generating verified carbon units under methodologies approved by the Gold Standard and Verra registries. A black soldier fly facility processing 50,000 metric tons of organic waste annually can produce 10,000 metric tons of CO2-equivalent credits. In 2024, the United Arab Emirates introduced a national circular economy strategy that prioritizes feed-grade insect protein, offering project developers expedited permitting and access to sovereign carbon credit offtake agreements. The dual revenue streams from protein sales and carbon credits are reducing the capital cost for greenfield projects. Lenders can underwrite cash flows based on both commodity protein prices and long-term carbon offtake contracts.
Restraints Impact Analysis*
| Restraint | (~) % Impact on CAGR Forecast | Geographic Relevance | Impact Timeline |
|---|---|---|---|
| High production capital expenditure and energy-intensive drying | −2.5% | Europe and Japan | Short term (≤ 2 years) |
| Supply chain bio-security and pathogen risks | −2.0% | North America and Europe | Medium term (2–4 years) |
| Potential insect-welfare legislation increasing operating costs | −1.0% | Europe | Long term (≥ 4 years) |
| Offshoring of European Union capacity is eroding local supply security | −1.0% | Europe | Medium term (2–4 years) |
| Source: Mordor Intelligence | |||
High Production Capital Expenditure and Energy Intensive Drying
Establishing a black soldier fly production facility with an annual capacity of 10,000 metric tons requires a substantial initial capital investment. Drying equipment alone constitutes a significant portion of the total project costs. Thermal drying, which reduces moisture content from 70% to 10%, consumes substantial energy per kilogram of dried larvae. This results in considerable electricity expenses for a mid-scale facility operating in regions with typical industrial power rates. Equipment manufacturers such as Bühler and GEA have introduced vacuum drying and microwave-assisted systems that enhance energy efficiency [2]Source: GEA Group, “Energy-Efficient Drying,” gea.com . These advanced systems entail higher capital costs and require specialized maintenance contracts, which add to operational expenses. These high capital requirements restrict market entry to well-funded players with access to project financing or strategic investors. This has created a two-tier market, where integrated feed companies can spread drying costs across multiple protein lines, while independent insect producers face challenges achieving cash flow breakeven within typical debt covenant timelines of 5 to 6 years.
Supply Chain Bio-security and Pathogen Risks
Insect rearing facilities encounter biosecurity risks comparable to those in intensive livestock operations. Viral, bacterial, and fungal pathogens can devastate larval populations within forty-eight to seventy-two hours. For instance, a 2024 densovirus outbreak at a European black soldier fly facility resulted in a severe mortality rate across 500 metric tons of larvae, leading to a six-week production halt and the activation of force majeure clauses in supply contracts. The absence of approved veterinary pharmaceuticals for insect health management exacerbates these risks, forcing producers to rely on environmental controls such as temperature, humidity, and stocking density to mitigate pathogen loads. In response, feed mills are adopting dual-source supply agreements and maintaining inventories of dried larvae for extended periods. This approach increases working capital requirements for mills consuming significant quantities annually.
*Our forecasts treat driver/restraint impacts as directional, not additive. The impact forecasts reflect baseline growth, mix effects, and variable interactions.
Segment Analysis
By Insect Species: Black Soldier Fly Consolidates Leadership
Black soldier fly larvae held 57.4% of the edible insect market size in 2025 and are projected to expand at a 11.0% CAGR through 2031. This growth is attributed to their high waste bioconversion efficiency and increasing regulatory acceptance in aquaculture and terrestrial livestock feed applications. The species' capability to process a wide range of organic substrates, such as pre-consumer food waste, brewery spent grains, and poultry manure, allows producers to utilize low-cost or even negative-cost feedstocks. This cost advantage has made black soldier fly larvae a competitive alternative to traditional feed ingredients, particularly in regions where feed costs are a significant concern. Furthermore, the larvae's nutritional profile, which includes high protein and fat content, enhances their appeal as a sustainable feed option for various industries, including aquaculture, poultry, and pet food production.
In June 2024, Tyson Foods announced a joint venture with Protix to build a 60,000 metric ton per year black soldier fly facility in Decatur, Illinois. This initiative highlights the scalability of the species, as the facility will be co-located with a poultry processing complex to utilize rendering waste and supply fresh larvae directly to nearby broiler farms. The co-location strategy not only reduces transportation costs but also ensures a consistent supply of feedstock for larvae production, enhancing operational efficiency. Additionally, the black soldier fly's ability to thrive in ambient temperatures of 25 to 35 degrees Celsius makes it a preferred choice for tropical and subtropical markets in regions such as Southeast Asia, the Middle East, and Sub-Saharan Africa, where cooling costs would otherwise significantly impact operating budgets. The species' adaptability to diverse climatic conditions and its potential to address food waste challenges further solidify its position as a key component in the global edible insect market.


By Product Form: Protein Meal Leads, Insect Oil Accelerates
Protein meal led with 42.5% of the edible insects market size in 2025, driven by feed mills adopting defatted grades that match fish meal protein levels while avoiding marine contaminants. The protein meal segment is dividing into commodity and specialty grades, with defatted meal commanding a premium over full-fat meal due to its higher protein concentration. Aquaculture producers targeting carnivorous species, such as salmon and seabass, prefer defatted meal to prevent lipid oxidation during feed storage. In contrast, poultry integrators opt for full-fat meals to leverage the energy density provided by insect lipids. Additionally, the growing demand for sustainable and alternative protein sources is further driving the adoption of protein meal in various feed applications, as it aligns with the industry's focus on reducing environmental impact.
Insect oil is forecast to grow at a 10.2% CAGR through 2031, supported by its lauric acid content, which is comparable to coconut oil and offers antimicrobial properties. These properties reduce the need for synthetic preservatives in premium pet kibble. The insect oil segment is also gaining interest from cosmetics and nutraceutical industries, where buyers are willing to pay a premium for pharmaceutical-grade oil. This creates flexibility for producers to allocate oil output based on real-time price signals across various end markets. Furthermore, the increasing awareness of insect oil's functional benefits, such as its potential to enhance skin health and its use in dietary supplements, is expanding its application scope and market potential.
By Application: Aquaculture Leads, Pet Food Accelerates
Aquaculture feed accounted for 45.0% of the edible insects market size in 2025. This growth is driven by salmon, trout, and shrimp producers seeking to reduce their reliance on fish meal and fish oil, which are constrained by supply limitations as wild capture fisheries approach their maximum sustainable yields. Salmon farmers in Norway and Chile have incorporated black soldier fly larvae meal into grower feed formulations, achieving feed conversion ratios of 1.15 to 1.20. These ratios are within 2% of those achieved with fish meal-based feeds, while also reducing the carbon footprint associated with feed for live weight gain. Additionally, the use of insect-based feed in aquaculture aligns with sustainability goals, as it offers a renewable and environmentally friendly alternative to traditional feed ingredients.
Pet food ingredients are projected to advance at a 9.4% CAGR to 2031, marking the fastest growth among applications. This is driven by premium brands utilizing the hypoallergenic properties of insect protein to stand out in a competitive market. The increasing consumer preference for sustainable and novel protein sources in pet food further supports this growth. Livestock feed, which includes poultry, swine, and ruminants, is also expanding, supported by regulatory approvals that allow the commercial-scale use of insect-based products in starter and grower rations. The poultry segment leads this growth, with black soldier fly larvae meal replacing soy protein concentrate in broiler starter feeds, providing methionine and lysine levels comparable to those of animal protein sources. Furthermore, the inclusion of insect protein in livestock feed contributes to reducing the environmental impact of traditional feed production, addressing growing concerns about sustainability in the agriculture industry.
Geography Analysis
Europe held 55% of the edible insect market share in 2025, driven by early regulatory approvals, a robust aquaculture and poultry industry, and retailer sustainability mandates that emphasize low-carbon feed ingredients. The Netherlands and France are key contributors to European production capacity, with companies such as Protix, InnovaFeed, and Ynsect collectively producing 150,000 metric tons annually. A significant portion of this output is allocated to salmon feed for Norwegian and Scottish farms. Germany and the United Kingdom are emerging as secondary hubs, supported by poultry integrators aiming to meet sustainability requirements from retailers like Carrefour and Tesco, which mandate that 10% of feed protein must come from low-emission sources by 2027.
The Middle East is projected to lead regional growth at an 8.0% CAGR through 2031, fueled by sovereign investments in circular economy infrastructure and the expansion of aquaculture in the United Arab Emirates (UAE), Saudi Arabia, and Oman. Saudi Arabia's Vision 2030 initiative includes a goal to produce 600,000 metric tons of farmed fish annually, thereby driving demand for protein to supplement imports of fish meal and soy [3]Source: UAE Ministry of Climate Change and Environment, “National Circular Economy Strategy,” moccae.gov.ae. Africa is experiencing significant growth, led by Kenya, South Africa, and Nigeria. In these countries, black soldier fly facilities are converting municipal organic waste into larvae, which are sold to tilapia and catfish farmers at prices lower than those of imported fish meal.
Asia-Pacific is projected to grow significantly, led by China, Thailand, and Vietnam, which are major contributors to global shrimp and tilapia production. These countries are leveraging insect-based feed to support their aquaculture industries and reduce reliance on traditional protein sources. South America is experiencing growth concentrated in Brazil and Chile, where salmon and tilapia producers are testing insect meal as an alternative to Argentine soy and Peruvian fish meal. These traditional feed sources face supply challenges due to drought and El Niño cycles, prompting producers to explore more sustainable and stable options. North America is expanding its use of edible insects, with the United States leading adoption in poultry and pet food applications. This growth follows the Association of American Feed Control Officials (AAFCO) approvals in 2024, which have facilitated the integration of insect-based feed into these markets.

Competitive Landscape
The edible insect market demonstrates moderate concentration, with leading players such as Protix B.V, Innovafeed SAS, EnviroFlight LLC, Ynsect, and Enterra Feed Corporation holding a significant combined revenue share by 2025. The competitive landscape exhibits moderate concentration, as major integrated feed companies enter the market through joint ventures, while smaller regional producers expand their operations with government support. Protix B.V., Innovafeed SAS, and EnviroFlight LLC have established first-mover advantages in Europe and North America, securing long-term offtake agreements with companies like Cargill, Skretting, and BioMar, which account for a significant share of their output through 2028.
Technology serves as the primary area of competition for market share. Leading companies are investing in machine vision systems to automate larvae sorting and reduce labor costs, as well as enzymatic fractionation processes to produce high-purity protein concentrates and pharmaceutical-grade oils for premium pet food and nutraceutical applications. Protix holds patents covering innovations in larvae rearing automation, feed substrate optimization, and frass pelletization. These efforts highlight Protix's strategy to protect its process advantages and license technology to smaller producers in exchange for royalty revenues.
New entrants, including equipment manufacturers like Bühler and waste management companies such as Darling Ingredients, are disrupting the market. Bühler provides turnkey insect farming systems under a build-operate-transfer model, while Darling Ingredients vertically integrated insect protein into its operations by acquiring EnviroFlight in 2022. The entry of these capital-intensive players is compressing margins for pure-play insect producers. Integrated operators benefit from the ability to amortize fixed costs across multiple protein lines and manage commodity price volatility, which could otherwise compromise the financial stability of smaller producers.
Edible Insects Industry Leaders
Protix B.V
EnviroFlight LLC
Enterra Feed Corporation
Ynsect
Innovafeed SAS
- *Disclaimer: Major Players sorted in no particular order

Recent Industry Developments
- January 2024: Ynsect became the first company to receive AAFCO authorization in the United States to commercialize defatted mealworm protein (Protein70) for use in dog food, based on safety and nutritional studies. This regulatory milestone opens the significant United States animal nutrition market to insect-based protein ingredients and underscores the growing acceptance of sustainable alternative proteins.
- July 2024: Innovafeed completed the third expansion phase at its industrial insect-meal production site in Nesle, France, significantly increasing capacity for black soldier fly (BSF) processing. The expansion enhances output of high-quality insect proteins and oils used in aquaculture, livestock, and pet feed, reinforcing supply-chain scale for insect-derived nutrition ingredients. This development highlights growing industrial investment in sustainable, alternative protein production to meet rising demand across global animal-feed markets.
- January 2023: Entobel has opened Asia's largest insect-protein production facility in Vung Tau, Vietnam, with an annual production capacity of 10,000 metric tons of black soldier fly-derived protein meal for animal feed. The facility is designed to provide a scalable supply of sustainable insect protein and oil for aquaculture, livestock, and pet nutrition, incorporating automated vertical rearing systems. This development highlights the growing industrialization of insect-based ingredients as environmentally friendly alternatives to traditional feed proteins in the Asia-Pacific region.


Research Methodology Framework and Report Scope
Market Definitions and Key Coverage
Mordor Intelligence defines the edible insects market as all insects bred or wild-harvested for direct human consumption, sold either whole (fresh, roasted, or dried) or processed into powders, oils, and composite ingredients subsequently used in retail food and beverage products. We size revenue at the first retail transaction and standardize figures in constant 2025 US dollars to allow clean year-on-year comparison.
Scope exclusion: Insect-based animal feed, fertilizer, cosmetics, and industrial chitin derivatives are outside this study.
Segmentation Overview
- By Insect Species
- Black Soldier Fly
- Mealworm
- Cricket
- Others
- By Product Form
- Protein Meal
- Whole Dried Larvae
- Insect Oil
- Frass
- By Application
- Aquaculture Feed
- Livestock Feed
- Pet-Food Ingredients
- By Geography
- North America
- United States
- Canada
- Mexico
- Rest of North America
- Europe
- Germany
- United Kingdom
- France
- Italy
- Spain
- Russia
- Rest of Europe
- Asia-Pacific
- China
- Japan
- India
- South Korea
- Australia
- Rest of Asia-Pacific
- South America
- Brazil
- Argentina
- Chile
- Rest of South America
- Middle East
- United Arab Emirates
- Saudi Arabia
- Israel
- Turkey
- Rest of Middle East
- Africa
- South Africa
- Egypt
- Rest of Africa
- North America
Detailed Research Methodology and Data Validation
Primary Research
Mordor analysts interviewed insect farm operators, specialty ingredient processors, regulatory officials, and grocery category buyers spanning Asia-Pacific, Europe, and North America. These conversations validated farm-gate prices, typical processing yields, and shopper acceptance rates, while clarifying how upcoming novel-food approvals could shift addressable volumes.
Desk Research
We began with open datasets from FAO FAOSTAT, UN Comtrade, and the International Platform of Insects for Food & Feed, which outline production volumes, trade flows, and regulatory milestones. Complementary reads from EFSA opinions, USDA/FDA notices, and peer-reviewed journals such as Food Chemistry helped benchmark nutritional yields and safety thresholds. Company filings, start-up pitch decks, and reputable news tracked through Dow Jones Factiva and financial snapshots drawn from D&B Hoovers supplied pricing and capacity clues. These publicly available and paid inputs together framed the demand pool and cost structure; yet many other credible sources also informed our desk work.
Market-Sizing & Forecasting
A top-down "consumption pool rebuild" starts with regional edible insect output, adjusts for import-export balances, shrinkage, and channel mark-ups, and produces base-year value. Results are cross-checked through selective bottom-up indicators such as sampled brand revenues and average selling price × volume snapshots from leading online retailers, allowing gaps to be narrowed quickly. Key model variables include: 1) commercial farm capacity utilization, 2) average retail price per kilogram of cricket and mealworm powder, 3) count of new insect-based SKUs launched per quarter, 4) share of consumers reporting prior tasting in annual food attitude surveys, and 5) regulatory approvals granted by region. We forecast using multivariate regression enriched with scenario analysis; coefficients are stress-tested with our primary experts before finalizing CAGR paths.
Data Validation & Update Cycle
Triangulation rules flag variances beyond 5 percentage points against independent protein-consumption trends, prompting analyst review. Models pass two-step peer checks and a senior sign-off. Reports refresh each year, with interim revisions when material events, such as novel-food clearances, hit the market.
Why Mordor's Edible Insects Baseline Commands Credibility
Published market values often diverge because firms apply distinct product scopes, price assumptions, and refresh cadences. Our disciplined focus on food-grade insects only, coupled with annually updated primary research, yields a balanced baseline decision-makers can trace back to verifiable data series.
Benchmark comparison
| Market Size | Anonymized source | Primary gap driver |
|---|---|---|
| USD 0.99 B (2025) | Mordor Intelligence | - |
| USD 1.35 B (2024) | Global Consultancy A | Includes animal-feed proteins and mixes nominal with real prices |
| USD 1.95 B (2025) | Trade Journal B | Applies aggressive adoption rates and assumes uniform 25 % SKU price premium |
| USD 1.48 B (2024) | Regional Publisher C | Uses broader ingredient scope and a 10-year moving average for currency conversion |
Differences stem mainly from scope breadth and pricing treatment; by isolating human-food channels and applying transparent inflation adjustments, Mordor Intelligence provides a dependable, repeatable starting point for strategic planning.


Key Questions Answered in the Report
Which insect species is most widely used in commercial feeds?
Black soldier fly larvae lead with 57.4% of insect feed market share in 2025, owing to rapid growth, high protein content, and favorable regulatory status.
What makes insect oil attractive to pet food formulators?
Insect oil contains lauric acid, providing antimicrobial benefits and allowing brands to market hypoallergenic formulas at premium prices.
How are retailers influencing adoption of insect proteins in livestock feeds?
European and North American grocery chains now require suppliers to meet carbon-footprint thresholds, effectively mandating the inclusion of insect meal to maintain shelf access.
What is the main operational cost challenge for insect farms?
Drying larvae to a stable meal form consumes up to 1.5 kWh per kilogram and can represent half of total operating costs in regions with high electricity prices.
Page last updated on:


