Sunflower Market Size and Share
Sunflower Market Analysis by Mordor Intelligence
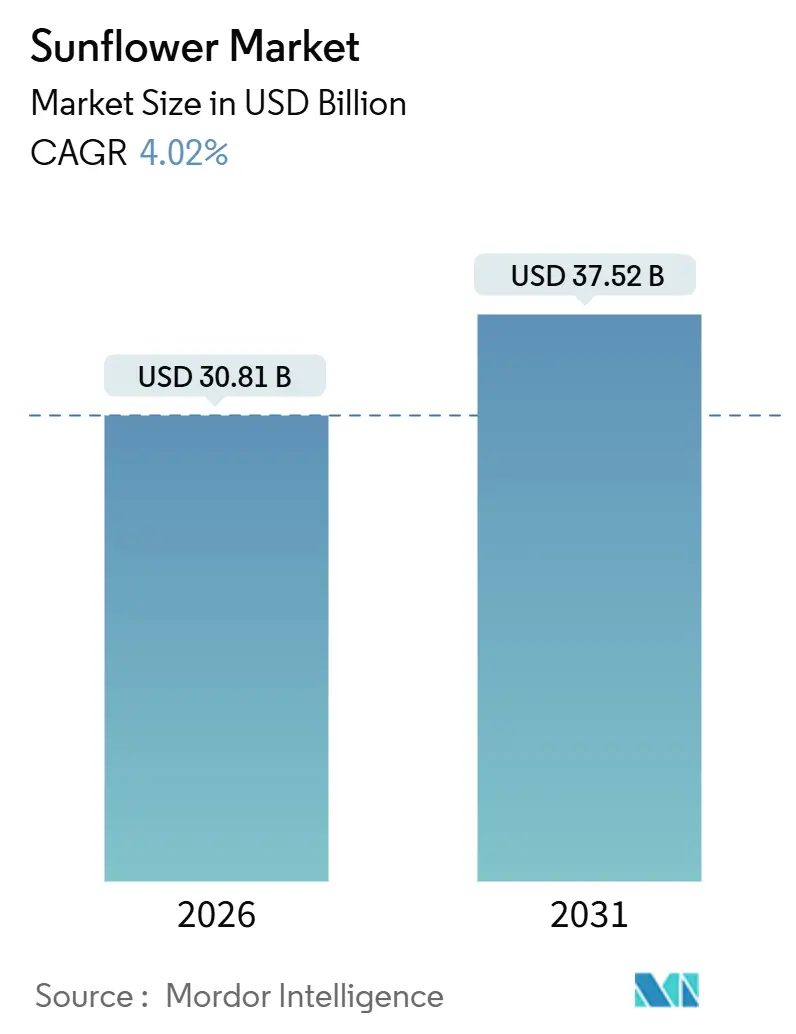
The sunflower market size was USD 30.81 billion in 2026 and is projected to reach USD 37.52 billion by 2031, growing at a 4.02% CAGR. Rising consumer preference for healthy oils, expanding demand for food-service applications, and supportive acreage policies in Russia, India, and Argentina are driving steady volume growth across the supply chain. Russia’s prolonged 50% export duty on raw seeds tilts value capture toward crushing nations, while India’s edible-oil mission pursues self-reliance through higher minimum support prices that encourage the adoption of hybrids. Premiums for high-oleic oil, favored by quick-service restaurants for its oxidative stability, stimulate varietal shifts that raise farmer margins and seed company revenues. Meanwhile, precision agriculture, drought-tolerant hybrids, and regenerative farming incentives are widening the yield frontier and blunting climate-induced supply shocks that have constrained recent harvests in southeastern Europe.
Key Report Takeaways
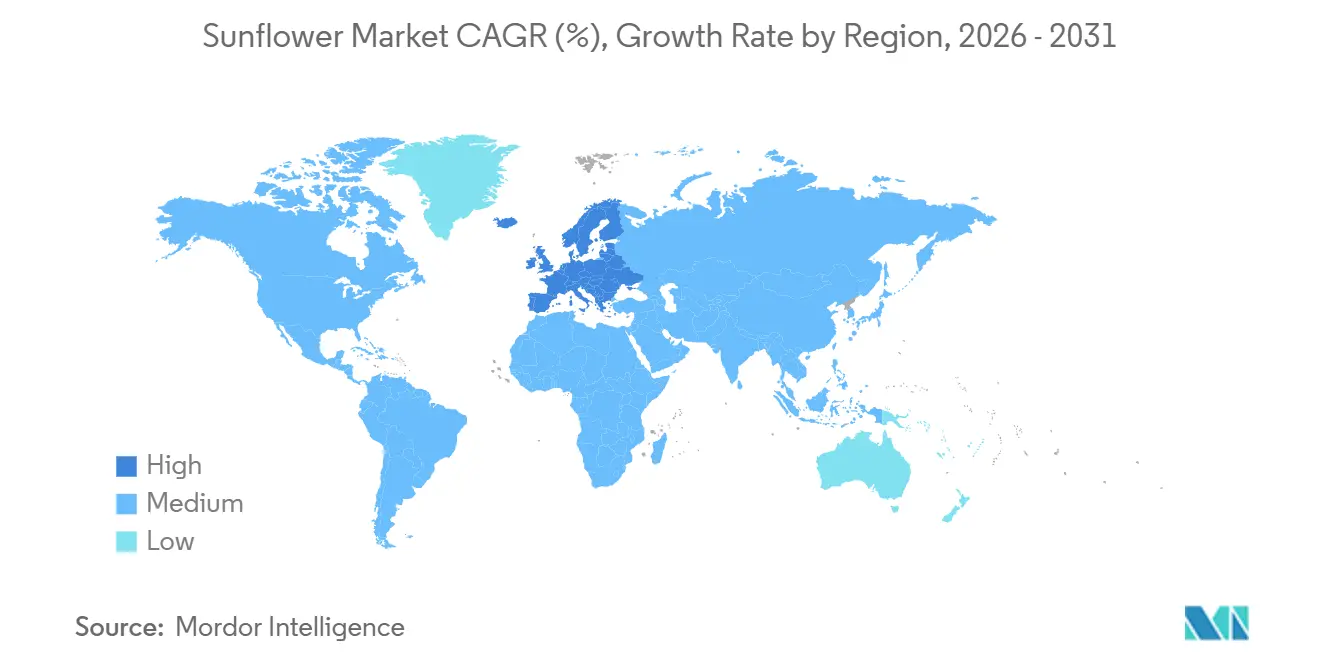
- By geography, Europe held 27% of the sunflower market size in 2025, while the Asia-Pacific region is anticipated to grow at a CAGR of 4.9% through 2031.
Note: Market size and forecast figures in this report are generated using Mordor Intelligence’s proprietary estimation framework, updated with the latest available data and insights as of January 2026.
Global Sunflower Market Trends and Insights
Drivers Impact Analysis*
| Driver | (~) % Impact on CAGR Forecast | Geographic Relevance | Impact Timeline |
|---|---|---|---|
| Increasing demand for edible oils is driving market expansion. | +1.2% | Global, with the highest intensity in the Asia-Pacific and the Middle East | Medium term (2-4 years) |
| Rising Plant-Protein Consumption Boosting Meal Demand | +0.9% | Global, concentrated in the Asia-Pacific poultry and aquafeed sectors | Long term (≥ 4 years) |
| Government acreage and export incentives | +0.8% | Russia, Argentina, India, Kazakhstan | Short term (≤ 2 years) |
| Precision agriculture productivity gains | +0.7% | North America, Europe, Argentina, Australia | Medium term (2-4 years) |
| Increased demand for high-oleic oils in premium applications | +0.6% | North America, Europe, Asia-Pacific food-service sectors | Medium term (2-4 years) |
| Crop-rotation sustainability benefits | +0.4% | North America, Europe, South America | Long term (≥ 4 years) |
| Source: Mordor Intelligence | |||
Increasing Demand for Edible Oils is Driving Market Expansion
Consumer perception of sunflower oil as a healthy alternative to palm and partially hydrogenated oils is driving substitution across retail and food-service channels. India's National Mission on Edible Oils has allocated USD 1.2 billion over 2024-2031 to expand domestic oilseed production[1]Press Information Bureau, “National Mission on Edible Oils,” pib.gov.in. The sunflower area is targeted for growth in Karnataka, Maharashtra, and Andhra Pradesh, with the aim of reducing the country's 60% import dependency on edible oils. Middle Eastern markets are similarly pivoting toward sunflower oil as olive oil prices surged above USD 9 per liter in 2024 due to Mediterranean drought, making sunflower oil a cost-effective substitute for household cooking and restaurant applications. The Asia-Pacific region's rapid urbanization and rising disposable incomes further amplify per-capita oil consumption, with China and Southeast Asia collectively absorbing incremental volumes that would have historically flowed to Europe.
Rising Plant-Protein Consumption Boosting Meal Demand
Sunflower meal, with a protein content ranging from 28% to 36% depending on dehulling efficiency, serves as a cost-effective ingredient in poultry, swine, and aquaculture feed, especially amid high soybean meal prices. The European Union's protein-crop support measures under the 2023-2027 Common Agricultural Policy encourage domestic oilseed production, aiming to reduce dependence on imported soy and support increased sunflower meal usage in compound feed formulations. Although sunflower meal has a lower lysine content compared to soybean meal, its amino acid profile can be economically balanced with synthetic supplements, allowing nutritionists to formulate cost-efficient rations without compromising animal performance. This trend is particularly evident in poultry production, where sunflower meal inclusion rates of 10% to 15% are commonly observed in broiler and layer diets across Europe and South America.
Increased Demand for High-Oleic Oils in Premium Applications
Food-service operators and snack manufacturers are transitioning to high-oleic sunflower oil to eliminate trans fats and extend fry life, thereby reducing the frequency of oil changes and labor costs in commercial kitchens. McDonald's and other quick-service chains in North America and Europe have adopted high-oleic sunflower oil for French fries and fried chicken, citing its neutral flavor and ability to withstand high-temperature applications without degradation. This shift creates a bifurcated market where high-oleic grades trade at premiums of USD 50 to USD 100 per metric ton above conventional linoleic oil, incentivizing seed companies and crushers to expand high-oleic acreage. Cargill's high-oleic sunflower program, which contracts directly with growers and guarantees premium pricing, secured commitments for over 200,000 hectares in Argentina and the United States for the 2025 planting season.
Crop-Rotation Sustainability Benefits
Sunflower's deep taproot and low nitrogen requirement make it an agronomically attractive rotation crop following wheat or corn, breaking pest cycles and improving soil structure. Carbon-credit programs administered by Cargill's RegenConnect and ADM's Sustainable Farming initiatives now compensate growers for incorporating sunflowers into multi-year rotations, with payments ranging from USD 10 to USD 20 per hectare, depending on the verified carbon sequestration. The European Union's eco-schemes under the 2023-2027 Common Agricultural Policy provide direct payments to farmers who adopt crop diversification, with sunflower qualifying as a non-cereal option that enhances biodiversity and reduces reliance on synthetic inputs. North American growers in the Dakotas and Montana similarly value sunflower's ability to tolerate drought better than soybeans, providing a risk-management tool in years when spring moisture is insufficient for corn planting.
Restraints Impact Analysis*
| Restraint | (~) % Impact on CAGR Forecast | Geographic Relevance | Impact Timeline |
|---|---|---|---|
| High price volatility and logistics risks | -0.8% | Global, most acute in Black Sea and Eastern Europe | Short term (≤ 2 years) |
| Intensifying climate-change yield impacts | -0.6% | Europe, Turkey, North Africa, Australia | Medium term (2-4 years) |
| Crush-margin swings toward rival oilseeds | -0.5% | Global, concentrated in multi-oilseed processing regions | Short term (≤ 2 years) |
| Pesticide and land-use constraints | -0.4% | European Union, United Kingdom | Long term (≥ 4 years) |
| Source: Mordor Intelligence | |||
Crush-Margin Swings Toward Rival Oilseeds
Soybean and rapeseed crush margins in 2024 and 2025 frequently exceeded sunflower margins by USD 30 to USD 50 per metric ton, incentivizing processors with multi-oilseed capacity to allocate throughput away from sunflower [2]Source: USDA FAS, “Oilseeds: World Markets and Trade,” fas.usda.gov. This dynamic is most pronounced in the European Union and Argentina, where large-scale crushers such as Bunge, Cargill, and ADM operate flexible plants that can switch between oilseeds based on relative profitability. North American processors similarly prioritized soybean crushing in 2024 as United States renewable diesel capacity expansions absorbed incremental soybean oil supply, leaving sunflower as a secondary feedstock. This margin volatility highlights the sector's vulnerability to inter-oilseed substitution, a risk that intensifies when energy markets or livestock feed demand fluctuate abruptly.
Pesticide and Land-Use Constraints
The European Union's ban on neonicotinoid insecticides, upheld in 2024 despite industry appeals, removed a key tool for controlling aphids and flea beetles in sunflowers, forcing growers to adopt integrated pest management strategies that increase labor and monitoring costs. The European Union Common Agricultural Policy also mandates that 4% of arable land be set aside for biodiversity purposes, effectively reducing the land base available for sunflowers and other row crops. These regulatory constraints compress the European Union's sunflower acreage, shifting production toward less-regulated geographies such as Argentina, Kazakhstan, and Russia, where pesticide options remain broader and land-use mandates are less stringent. The United Kingdom's post-Brexit agricultural policy imposes restrictions on the use of neonicotinoids and prioritizes environmental stewardship over production intensity, presenting a structural challenge for the country's sunflower growers.
*Our forecasts treat driver/restraint impacts as directional, not additive. The impact forecasts reflect baseline growth, mix effects, and variable interactions.
Geography Analysis
Europe held a 27% share of the sunflower market in 2025. Production constraints due to drought in Romania, Bulgaria, and Hungary reduced regional self-sufficiency, leading to increased imports from Argentina and Russia. The European Union 2023-2027 Common Agricultural Policy mandates a 4% set-aside of arable land for biodiversity and restricts the use of neonicotinoid insecticides, thereby compressing acreage and yields while incentivizing crop diversification that includes sunflowers in wheat rotations [3]Source: European Commission CAP Strategic Plans, agriculture.ec.europa.eu. Russia's extension of its export duty through 2028 at 50% redirects global trade flows, as European and Middle Eastern buyers, previously reliant on Russian raw seeds, now source them from Argentina and the European Union, thereby tightening global supply.
The Asia-Pacific region is anticipated to grow at a CAGR of 4.9% through 2031, driven by consumption growth, which is propelled by government support, such as the USD 1.2 billion allocation by the National Mission on Edible Oils in India to expand domestic production and reduce import dependency. China reflects dual demand for cooking oil and confectionery seeds, with urbanization and rising incomes driving per-capita oil consumption. Southeast Asia, including Indonesia, Thailand, and Vietnam, where quick-service restaurant chains are adopting high-oleic sunflower oil for commercial applications, valuing its extended fry life and neutral flavor.
South America's sunflower market is bolstered by Argentina's projected harvest of 4.7 million metric tons in 2024-25, representing a 30.6% year-over-year increase, as estimated by the United States Department of Agriculture (USDA). This growth is supported by export tax policies that favor processed products and encourage the expansion of domestic crushing capacity. In Brazil, the emerging sunflower sector is concentrated in Mato Grosso and Goiás, where farmers value sunflowers' compatibility with double-cropping systems, allowing them to be grown between soybean and corn as an additional cash crop without displacing primary commodities. Africa's sunflower market is driven by Egypt's significant refining sector and South Africa's confectionery production. Limited domestic production necessitates reliance on imports from the Black Sea region and Argentina, making the market vulnerable to fluctuations in freight and currency costs.


Competitive Landscape
Global sunflower market participants, including producers, importers, and exporters, are creating opportunities for regional processors and trader-crushers to generate value in their origin markets. Kernel Holding operates crushing plants and export terminals in Ukraine, enabling it to capture margins throughout the value chain, from farm-level procurement to the sale of refined oil. Strategic approaches in the market emphasize vertical integration, with key players investing in farm-level agronomic support and precision agriculture tools to ensure a consistent supply of high-quality seeds. They also expand crushing and refining capacities to maximize processing margins.
Opportunities exist in India and Southeast Asia, where domestic crushing infrastructure lags consumption growth, forcing reliance on imported refined oil that compresses local value capture. Kazakhstan and Turkey similarly present expansion potential, as government policies favor domestic processing through tariff-quota structures and export tax differentials that penalize raw-seed exports. Technology adoption is accelerating, with Bunge and Cargill deploying satellite imagery and IoT sensors to monitor contracted acreage in real time, enabling early intervention when stress or disease threatens yields.
Smaller regional players, such as Astarta in Ukraine and EFKO in Russia, leverage geographic proximity to production zones and lower overhead costs to compete on price; they lack the global logistics networks and risk-management capabilities of multinational traders. The sector's moderate concentration suggests that mergers and acquisitions activity will continue, as scale advantages in procurement, logistics, and customer diversification drive consolidation, particularly among mid-tier crushers seeking capital to upgrade facilities for high-oleic processing.
Recent Industry Developments
- April 2025: Syngenta Group revealed parthenogenesis results, cutting sunflower breeding cycles to ten months by enabling rapid production of doubled haploid lines, a method previously challenging in sunflowers. This discovery, led by Syngenta Biotechnology China, unlocks efficient and scalable haploid induction in sunflowers through genetic, chemical, and environmental manipulation, thereby accelerating the creation of superior hybrid seeds.
- October 2024: India's Ministry of Agriculture launched the National Mission on Edible Oils with a Rs 10,103 crore (USD 1.2 billion) allocation over 2024-2031, targeting sunflower area expansion in Karnataka, Maharashtra, and Andhra Pradesh to reduce the country's 60% import dependency on edible oils
- April 2024: Turkey's Ministry of Trade maintained a 1.0 million metric ton tariff-quota for sunflower seed and crude oil imports, pairing it with a domestic purchase requirement to stabilize supply for its large refining sector following heat-induced yield losses in Thrace and Central Anatolia.


Research Methodology Framework and Report Scope
Market Definitions and Key Coverage
Our study defines the global sunflower market as the combined farm-gate value of sunflower seed production and the first-level sale of its core derivatives, crude and refined oil, meal/cake, and commercial seed for snacks or sowing, tracked across all major producing and consuming countries.
Scope exclusion: Cut-flower ornamentals and downstream consumer packaged foods that blend sunflower oil with multiple ingredients are not counted.
Segmentation Overview
- By Geography
- North America
- United States
- Production Analysis (Area Harvested, Yield, and Production Volume)
- Consumption Analysis (Consumption Value and Volume)
- Import Market Analysis (Import Value, Volume, and Key Supplying Markets)
- Export Market Analysis (Export Value, Volume, and Key Destination Markets)
- Wholesale Price Trend Analysis and Forecast
- Regulatory Framework
- List of Key Players
- Logistics and Infrastructure
- Seasonality Analysis
- Canada
- Production Analysis (Area Harvested, Yield, and Production Volume)
- Consumption Analysis (Consumption Value and Volume)
- Import Market Analysis (Import Value, Volume, and Key Supplying Markets)
- Export Market Analysis (Export Value, Volume, and Key Destination Markets)
- Wholesale Price Trend Analysis and Forecast
- Regulatory Framework
- List of Key Players
- Logistics and Infrastructure
- Seasonality Analysis
- Mexico
- Production Analysis (Area Harvested, Yield, and Production Volume)
- Consumption Analysis (Consumption Value and Volume)
- Import Market Analysis (Import Value, Volume, and Key Supplying Markets)
- Export Market Analysis (Export Value, Volume, and Key Destination Markets)
- Wholesale Price Trend Analysis and Forecast
- Regulatory Framework
- List of Key Players
- Logistics and Infrastructure
- Seasonality Analysis
- United States
- Europe
- France
- Production Analysis (Area Harvested, Yield, and Production Volume)
- Consumption Analysis (Consumption Value and Volume)
- Import Market Analysis (Import Value, Volume, and Key Supplying Markets)
- Export Market Analysis (Export Value, Volume, and Key Destination Markets)
- Wholesale Price Trend Analysis and Forecast
- Regulatory Framework
- List of Key Players
- Logistics and Infrastructure
- Seasonality Analysis
- Ukraine
- Production Analysis (Area Harvested, Yield, and Production Volume)
- Consumption Analysis (Consumption Value and Volume)
- Import Market Analysis (Import Value, Volume, and Key Supplying Markets)
- Export Market Analysis (Export Value, Volume, and Key Destination Markets)
- Wholesale Price Trend Analysis and Forecast
- Regulatory Framework
- List of Key Players
- Logistics and Infrastructure
- Seasonality Analysis
- Russia
- Production Analysis (Area Harvested, Yield, and Production Volume)
- Consumption Analysis (Consumption Value and Volume)
- Import Market Analysis (Import Value, Volume, and Key Supplying Markets)
- Export Market Analysis (Export Value, Volume, and Key Destination Markets)
- Wholesale Price Trend Analysis and Forecast
- Regulatory Framework
- List of Key Players
- Logistics and Infrastructure
- Seasonality Analysis
- Spain
- Production Analysis (Area Harvested, Yield, and Production Volume)
- Consumption Analysis (Consumption Value and Volume)
- Import Market Analysis (Import Value, Volume, and Key Supplying Markets)
- Export Market Analysis (Export Value, Volume, and Key Destination Markets)
- Wholesale Price Trend Analysis and Forecast
- Regulatory Framework
- List of Key Players
- Logistics and Infrastructure
- Seasonality Analysis
- Romania
- Production Analysis (Area Harvested, Yield, and Production Volume)
- Consumption Analysis (Consumption Value and Volume)
- Import Market Analysis (Import Value, Volume, and Key Supplying Markets)
- Export Market Analysis (Export Value, Volume, and Key Destination Markets)
- Wholesale Price Trend Analysis and Forecast
- Regulatory Framework
- List of Key Players
- Logistics and Infrastructure
- Seasonality Analysis
- Bulgaria
- Production Analysis (Area Harvested, Yield, and Production Volume)
- Consumption Analysis (Consumption Value and Volume)
- Import Market Analysis (Import Value, Volume, and Key Supplying Markets)
- Export Market Analysis (Export Value, Volume, and Key Destination Markets)
- Wholesale Price Trend Analysis and Forecast
- Regulatory Framework
- List of Key Players
- Logistics and Infrastructure
- Seasonality Analysis
- France
- Asia-Pacific
- China
- Production Analysis (Area Harvested, Yield, and Production Volume)
- Consumption Analysis (Consumption Value and Volume)
- Import Market Analysis (Import Value, Volume, and Key Supplying Markets)
- Export Market Analysis (Export Value, Volume, and Key Destination Markets)
- Wholesale Price Trend Analysis and Forecast
- Regulatory Framework
- List of Key Players
- Logistics and Infrastructure
- Seasonality Analysis
- India
- Production Analysis (Area Harvested, Yield, and Production Volume)
- Consumption Analysis (Consumption Value and Volume)
- Import Market Analysis (Import Value, Volume, and Key Supplying Markets)
- Export Market Analysis (Export Value, Volume, and Key Destination Markets)
- Wholesale Price Trend Analysis and Forecast
- Regulatory Framework
- List of Key Players
- Logistics and Infrastructure
- Seasonality Analysis
- Pakistan
- Production Analysis (Area Harvested, Yield, and Production Volume)
- Consumption Analysis (Consumption Value and Volume)
- Import Market Analysis (Import Value, Volume, and Key Supplying Markets)
- Export Market Analysis (Export Value, Volume, and Key Destination Markets)
- Wholesale Price Trend Analysis and Forecast
- Regulatory Framework
- List of Key Players
- Logistics and Infrastructure
- Seasonality Analysis
- Australia
- Production Analysis (Area Harvested, Yield, and Production Volume)
- Consumption Analysis (Consumption Value and Volume)
- Import Market Analysis (Import Value, Volume, and Key Supplying Markets)
- Export Market Analysis (Export Value, Volume, and Key Destination Markets)
- Wholesale Price Trend Analysis and Forecast
- Regulatory Framework
- List of Key Players
- Logistics and Infrastructure
- Seasonality Analysis
- Kazakhstan
- Production Analysis (Area Harvested, Yield, and Production Volume)
- Consumption Analysis (Consumption Value and Volume)
- Import Market Analysis (Import Value, Volume, and Key Supplying Markets)
- Export Market Analysis (Export Value, Volume, and Key Destination Markets)
- Wholesale Price Trend Analysis and Forecast
- Regulatory Framework
- List of Key Players
- Logistics and Infrastructure
- Seasonality Analysis
- China
- South America
- Brazil
- Production Analysis (Area Harvested, Yield, and Production Volume)
- Consumption Analysis (Consumption Value and Volume)
- Import Market Analysis (Import Value, Volume, and Key Supplying Markets)
- Export Market Analysis (Export Value, Volume, and Key Destination Markets)
- Wholesale Price Trend Analysis and Forecast
- Regulatory Framework
- List of Key Players
- Logistics and Infrastructure
- Seasonality Analysis
- Argentina
- Production Analysis (Area Harvested, Yield, and Production Volume)
- Consumption Analysis (Consumption Value and Volume)
- Import Market Analysis (Import Value, Volume, and Key Supplying Markets)
- Export Market Analysis (Export Value, Volume, and Key Destination Markets)
- Wholesale Price Trend Analysis and Forecast
- Regulatory Framework
- List of Key Players
- Logistics and Infrastructure
- Seasonality Analysis
- Paraguay
- Production Analysis (Area Harvested, Yield, and Production Volume)
- Consumption Analysis (Consumption Value and Volume)
- Import Market Analysis (Import Value, Volume, and Key Supplying Markets)
- Export Market Analysis (Export Value, Volume, and Key Destination Markets)
- Wholesale Price Trend Analysis and Forecast
- Regulatory Framework
- List of Key Players
- Logistics and Infrastructure
- Seasonality Analysis
- Brazil
- Middle East
- Iran
- Production Analysis (Area Harvested, Yield, and Production Volume)
- Consumption Analysis (Consumption Value and Volume)
- Import Market Analysis (Import Value, Volume, and Key Supplying Markets)
- Export Market Analysis (Export Value, Volume, and Key Destination Markets)
- Wholesale Price Trend Analysis and Forecast
- Regulatory Framework
- List of Key Players
- Logistics and Infrastructure
- Seasonality Analysis
- Saudi Arabia
- Production Analysis (Area Harvested, Yield, and Production Volume)
- Consumption Analysis (Consumption Value and Volume)
- Import Market Analysis (Import Value, Volume, and Key Supplying Markets)
- Export Market Analysis (Export Value, Volume, and Key Destination Markets)
- Wholesale Price Trend Analysis and Forecast
- Regulatory Framework
- List of Key Players
- Logistics and Infrastructure
- Seasonality Analysis
- Turkey
- Production Analysis (Area Harvested, Yield, and Production Volume)
- Consumption Analysis (Consumption Value and Volume)
- Import Market Analysis (Import Value, Volume, and Key Supplying Markets)
- Export Market Analysis (Export Value, Volume, and Key Destination Markets)
- Wholesale Price Trend Analysis and Forecast
- Regulatory Framework
- List of Key Players
- Logistics and Infrastructure
- Seasonality Analysis
- Iran
- Africa
- South Africa
- Production Analysis (Area Harvested, Yield, and Production Volume)
- Consumption Analysis (Consumption Value and Volume)
- Import Market Analysis (Import Value, Volume, and Key Supplying Markets)
- Export Market Analysis (Export Value, Volume, and Key Destination Markets)
- Wholesale Price Trend Analysis and Forecast
- Regulatory Framework
- List of Key Players
- Logistics and Infrastructure
- Seasonality Analysis
- Egypt
- Production Analysis (Area Harvested, Yield, and Production Volume)
- Consumption Analysis (Consumption Value and Volume)
- Import Market Analysis (Import Value, Volume, and Key Supplying Markets)
- Export Market Analysis (Export Value, Volume, and Key Destination Markets)
- Wholesale Price Trend Analysis and Forecast
- Regulatory Framework
- List of Key Players
- Logistics and Infrastructure
- Seasonality Analysis
- Tanzania
- Production Analysis (Area Harvested, Yield, and Production Volume)
- Consumption Analysis (Consumption Value and Volume)
- Import Market Analysis (Import Value, Volume, and Key Supplying Markets)
- Export Market Analysis (Export Value, Volume, and Key Destination Markets)
- Wholesale Price Trend Analysis and Forecast
- Regulatory Framework
- List of Key Players
- Logistics and Infrastructure
- Seasonality Analysis
- South Africa
- North America
Detailed Research Methodology and Data Validation
Desk Research
We start by compiling multi-year acreage, yield, crush, trade, and spot-price series from public repositories such as FAOSTAT, USDA-FAS, UN Comtrade, International Grains Council, and Eurostat, supported by peer-reviewed agronomy journals for climate-yield links. Company filings and D&B Hoovers snapshots reveal crush capacity and refinery throughput, while Dow Jones Factiva streams policy and logistics news that can shift balances. These sources illustrate our foundation and are not exhaustive.
Primary Research
Mordor analysts interview oilseed crushers, grower-cooperative agronomists, commodity brokers, and seed-breeder economists across Europe, the Black Sea, Asia, and the Americas. Insights on extraction yields, typical contract premiums, and upcoming acreage swings let us reconcile desk figures and fine-tune model assumptions.
Market-Sizing & Forecasting
A top-down build sizes the 2024 base from harvested tonnage and verified ex-mill prices, then feeds net-trade balances into a utilization matrix. Selective supplier roll-ups of crush capacity and average selling prices stress-test the totals. Key variables like planted hectares, yield per hectare, solvent-extraction recovery, biodiesel blending mandates, export differentials, and per-capita edible-oil intake drive a multivariate regression that projects demand and price paths to 2030. Divergent bottom-up clues trigger midpoint adjustments aligned with verified customs data.
Data Validation and Update Cycle
Each model run undergoes variance checks, peer review, and anomaly flags before sign-off. We refresh the dataset annually, or sooner if geopolitical shocks, harvest revisions, or policy moves breach preset thresholds.
Credibility Anchor - Why Mordor's Sunflower Baseline Commands Reliability
Published estimates vary because firms choose different product baskets, pricing nodes, and refresh cadences. Our inclusive farm-gate-to-first-processing scope, coupled with live updates when Black Sea export rules or season-start acreage shift, keeps the baseline current and transparent.
Key gap drivers versus other publishers include:
1. Some report factory-gate seed values only, omitting meal or oil.
2. Others focus on seed or oil alone, narrowing the revenue pool.
3. Several leave prior-season shocks unrefreshed, freezing exchange-rate or price inputs.
Benchmark comparison
| Market Size | Anonymized source | Primary gap driver |
|---|---|---|
| USD 32.10 bn | Mordor Intelligence | |
| USD 24.09 bn | Global Consultancy A | Factory-gate scope; no mid-year price resets |
| USD 29.27 bn | Industry Association B | Seed segment only; excludes oil and meal |
The comparison shows how Mordor's disciplined scope selection and rolling update cadence deliver a balanced, decision-ready baseline for planners who require dependable numbers.


Key Questions Answered in the Report
What is the current value of the global sunflower market?
The global sunflower market size reached USD 30.81 billion in 2026 and is forecast to rise to USD 37.52 billion by 2031.
What policies are driving acreage expansion in India?
The National Mission on Edible Oils provides minimum support prices and infrastructure funds that lower farmer risk and boost hybrid adoption.
Why is high-oleic sunflower oil gaining popularity?
High-oleic oil offers oxidative stability and zero trans fat, which cuts fryer changeouts and meets clean-label demands, leading to premiums of up to USD 100 per ton.
How are climate risks affecting sunflower yields?
Drought and extreme heat reduced 2024-25 yields by up to 0.5 metric ton per hectare in southeastern Europe, prompting higher imports.
Page last updated on:


