Green Packaging Market Size and Share
Market Overview
| Study Period | 2020 - 2031 |
|---|---|
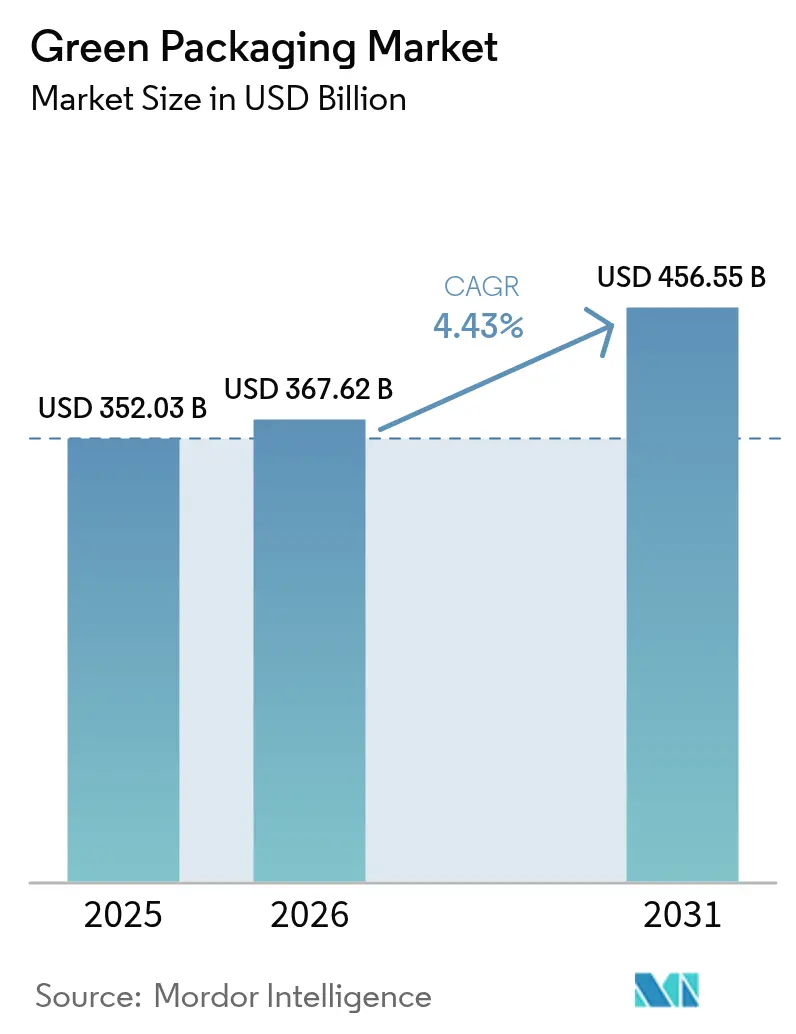
| Market Size (2026) | USD 367.62 Billion |
| Market Size (2031) | USD 456.55 Billion |
| Growth Rate (2026 - 2031) | 4.43% CAGR |
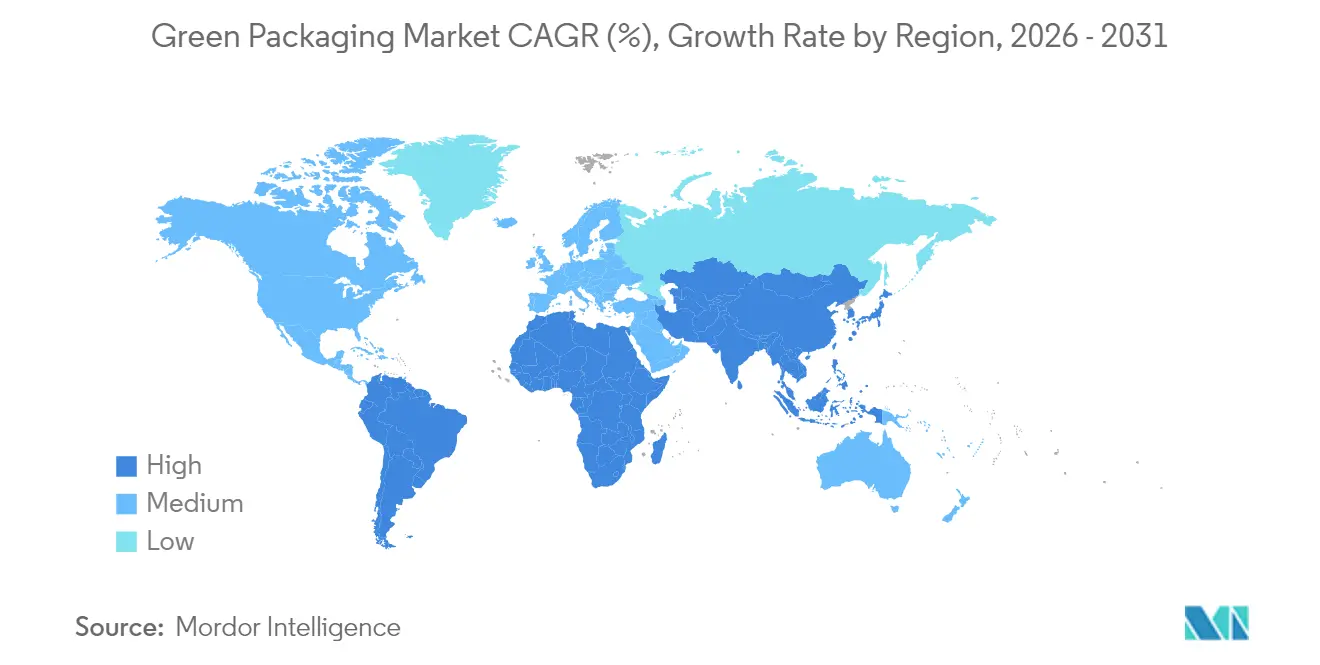
| Fastest Growing Market | Asia Pacific |
| Largest Market | Europe |
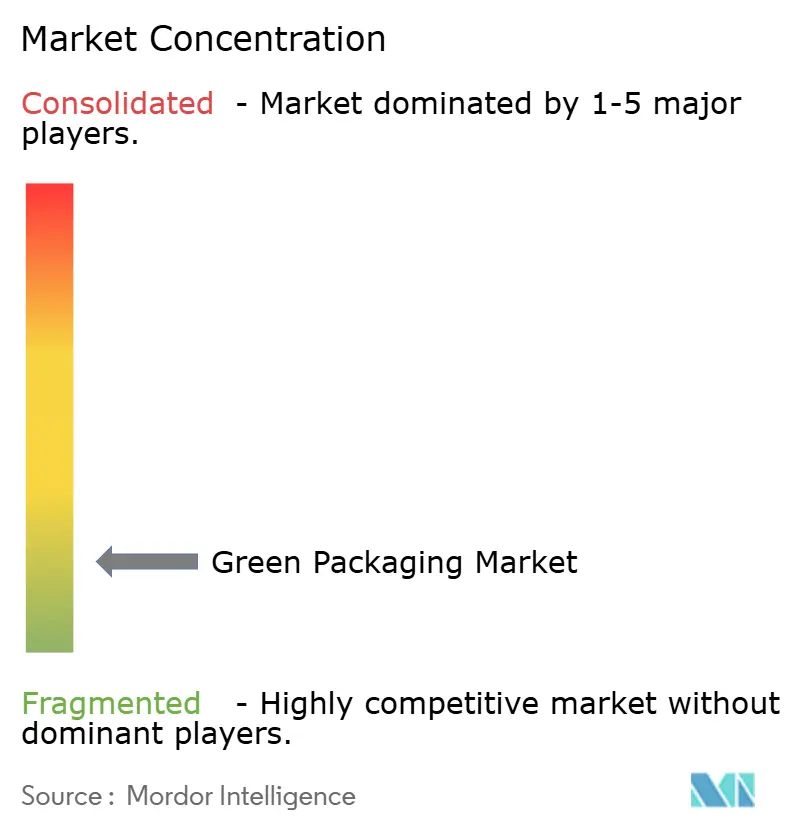
| Market Concentration | Low |
Major Players *Disclaimer: Major Players sorted in no particular order Image © Mordor Intelligence. Reuse requires attribution under CC BY 4.0. | |
Green Packaging Market Analysis by Mordor Intelligence
green packaging market size in 2026 is estimated at USD 367.62 billion, growing from 2025 value of USD 352.03 billion with 2031 projections showing USD 456.55 billion, growing at 4.43% CAGR over 2026-2031.This steady growth results from converging forces: binding regulations such as the European Union’s PPWR, corporate net-zero packaging targets, and cost reduction from recycled feedstocks. Europe leads in policy stringency, mandating full recyclability by 2030, compulsory digital traceability, and step-wise recycled-content quotas. Asia-Pacific delivers the fastest incremental demand as India, South Korea, and Japan combine expanding consumption with escalating bans on single-use plastics. At the company level, megamergers such as Smurfit Kappa–WestRock and Novolex–Pactiv Evergreen signal that global scale now underpins compliance, R&D, and multi-material capabilities. Technology breakthroughs—particularly digital watermarking and advanced polymer chemistry—remove earlier quality and speed constraints in closed-loop recycling.
Key Report Takeaways
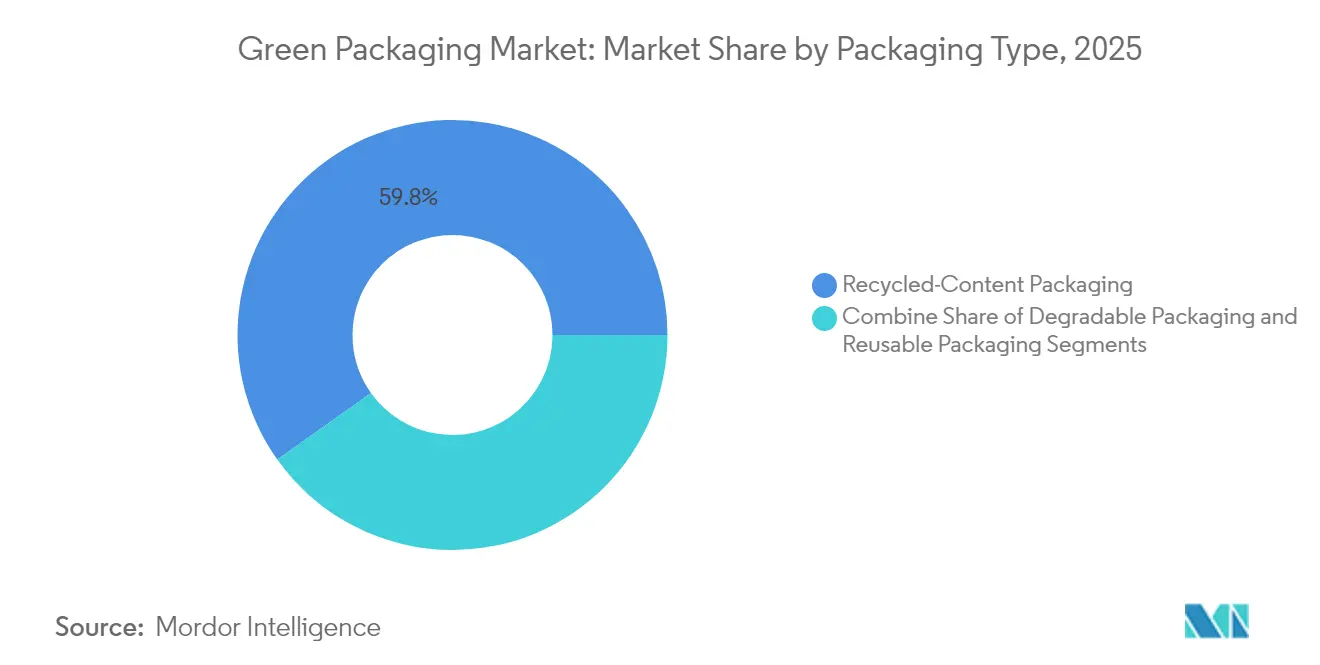
- By packaging type, recycled-content formats controlled 59.84% of green packaging market share in 2025; degradable packaging is forecast to accelerate at a 7.58% CAGR to 2031.
- By Material, Rigid and Flexible Recyclable Plastics retained 67.71% share in 2025, whereas Biopolymers are expanding at a 8.06% CAGR.
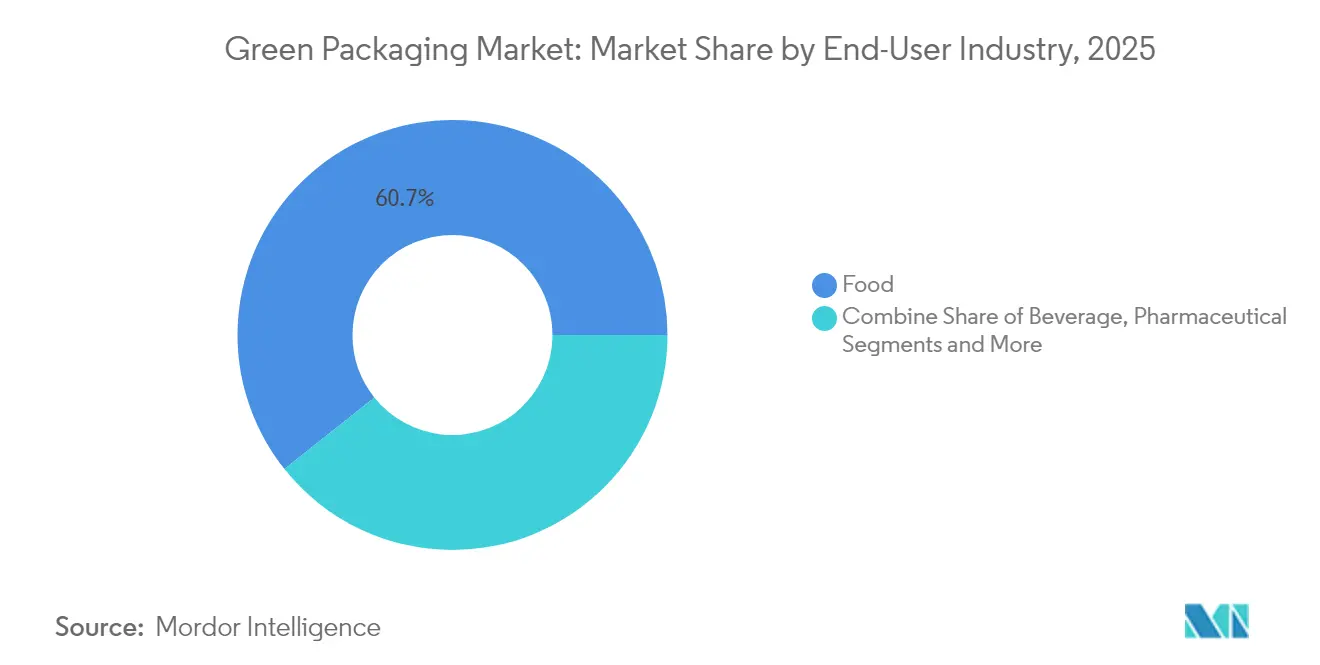
- By end-user industry, the food sector held 60.72% of revenue in 2025 and is advancing at a 6.45% CAGR through 2031, supported by brand commitments from Nestlé and PepsiCo.
- By packaging function, primary applications retained 69.76% share in 2025, whereas secondary applications are expanding at a 6.05% CAGR on the back of e-commerce logistics optimization.
- By geography, Europe dominated with a 36.21% share of the green packaging market in 2025, while Asia-Pacific is projected to post the quickest 7.95% CAGR through 2031.
Note: Market size and forecast figures in this report are generated using Mordor Intelligence’s proprietary estimation framework, updated with the latest available data and insights as of 2026.
Global Green Packaging Market Trends and Insights
Drivers Impact Analysis*
| Driver | (~) % Impact on CAGR Forecast | Geographic Relevance | Impact Timeline |
|---|---|---|---|
| Stringent bans on single-use plastics | +1.2% | Global, with EU and India leading implementation | Medium term (2-4 years) |
| Corporate ESG and net-zero packaging pledges | +0.9% | Global, concentrated in North America and Europe | Long term (≥ 4 years) |
| Cost savings from light-weighting and recycling | +0.8% | Global, with highest impact in Asia-Pacific | Short term (≤ 2 years) |
| Digital watermarking enabling high-speed sortation | +0.6% | North America and Europe initially, expanding to APAC | Medium term (2-4 years) |
| Rapid roll-out of closed-loop refill logistics | +0.5% | Europe and North America, pilot programs in Asia | Long term (≥ 4 years) |
| Source: Mordor Intelligence | |||
Stringent bans on single-use plastics
Accelerated policy roll-outs across the European Union, India, and Chile sharply limit legacy polymers and stimulate immediate switches to compostable films and high-recycled-content PET. Russia’s September 2025 prohibition on specific PET items and the EU’s blanket ban on Bisphenol A in food contact packaging wipe out entire material categories, forcing converters to fast-track biopolymer commercialisation. Indian rules introduce 30% post-consumer recycled content for beverage bottles in 2025, while Chile pushes the requirement to 70% by 2060, compressing innovation cycles and redirecting CAPEX toward seaweed-based and PHA blends. South Korea’s Marine Innovation illustrates how these rules nurture startups that hold patents for ocean-biomass substrates, proving market-ready viability. California’s extended producer responsibility regime layers on reuse mandates, turning material substitution into a competitive necessity rather than a branding exercise. [1]Wkai Global Editorial Team, “Global Plastic Packaging Regulations Tighten,” Wkai Global, wkaiglobal.com
Corporate ESG and net-zero packaging pledges
Brand owners now translate sustainability rhetoric into purchase orders that exceed regulatory floors. Ball Corporation is moving to 85% recycled content by 2030 and targets a 90% global aluminum recycling rate, effectively guaranteeing demand for secondary smelter output. Unilever’s May 2024 pledge to achieve 100% recyclable, reusable, or compostable formats by 2025 combines design changes with absolute material reduction targets, amplifying pressure on suppliers. L’Oréal’s EUR 72 million fund backs recycling start-ups despite the company only hitting 49% recyclability so far, indicating that capital is migrating toward scalable solutions rather than incremental tweaks. Seven & i Holdings’ GREEN CHALLENGE 2050 specifies 50% sustainable inputs by 2030, anchoring multi-country offtake agreements that justify dedicated production lines for PHA or bio-PE. Once these multinationals set baseline specifications, tier-2 suppliers must comply to remain on approved vendor lists.
Cost savings from light-weighting and recycling
Financial logic joins environmental logic as converters squeeze resin volumes and substitute recycled fibre. Seven-Eleven Japan’s 30% plastic reduction in Cup Deli trays cuts resin spend while meeting plastic taxes. Green Bay Packaging’s USD 1 billion capacity build in Arkansas hinges on recycled kraft linerboard cost advantages versus virgin fibre. Saito Eiji Shoten’s carbon-neutral cardboard secures premium shelf prices, turning ESG into margin expansion rather than cost leakage. Kanamae Corporation’s closed-loop aluminum recycling palette demonstrates a 20% CO₂ reduction relative to incineration at only marginal capex, unlocking payback through lower energy use. When savings on material and landfill taxes outpace transition costs, adoption speeds up in price-sensitive Asian markets.
Digital watermarking enabling high-speed sortation
Invisible codes embedded directly in labels and substrates allow automated lines to recognise material type, layer count, and contamination at industrial speed. Digimarc’s alliance with OMRON demonstrates 10-ton-per-hour throughput, dramatically lowering the cost per recycled ton. Elopak cartons carrying digital watermarks perform full-loop identification without sacrificing aesthetics, a critical factor in beverage brand marketing. Real-time material telemetry produced by this technology feeds back to converters, enabling recipe optimisation based on actual recovery rates instead of theoretical recyclability. As precision sorting lifts recycled feedstock purity, polymer processors enjoy better mechanical properties and lower additive costs, reinforcing the profitability of closed loops.
Restraints Impact Analysis*
| Restraint | (~) % Impact on CAGR Forecast | Geographic Relevance | Impact Timeline |
|---|---|---|---|
| Bio-based feedstock supply constraints | -0.7% | Global, with acute shortages in North America and Europe | Medium term (2-4 years) |
| Higher unit costs vs. legacy packaging | -0.5% | Global, most pronounced in price-sensitive emerging markets | Short term (≤ 2 years) |
| Barrier-property limitations in compostables | -0.4% | Global, critical in food and pharmaceutical applications | Medium term (2-4 years) |
| Patchy composting / anaerobic-digestion infra | -0.3% | North America and developing markets in APAC, MEA | Long term (≥ 4 years) |
| Source: Mordor Intelligence | |||
Bio-based feedstock supply constraints
PLA, PHA, and starch derivatives hinge on agricultural inputs that compete with food and biofuel demand. SK Chemicals and NatureWorks face corn and sugar price volatility that dictates resin pricing, making biopolymers less competitive during commodity spikes. Limited fermentation and purification assets in North America and Europe create bottlenecks that lead to spot shortages, forcing converters to dual-source or revert to recycled PET. Large-scale capacity additions require multi-hundred-million-dollar plants with decade-long depreciation, dampening rapid response to demand surges. Seasonality compounds risk as harvest cycles shape annual throughput, complicating inventory and cash-flow management. [2]SK Chemicals, “Biopolymer Portfolio,” SK Chemicals, skchemicals.com
Higher unit costs vs. legacy packaging
Compostable trays and films still cost 20-40% more than conventional multilayer PE or PS in most markets, hitting margins for FMCG manufacturers reliant on high-volume, low-price ranges. Price-sensitive consumers in Southeast Asia and Latin America exhibit limited willingness to pay for green attributes, restricting SKU uptake in mass retail. SMEs struggle because they lack purchasing power to negotiate down biopolymer prices or to amortise retooling across large runs. Additional costs accrue from specialised storage and humidity-controlled logistics required by PLA or PHA, unlike shelf-stable PP. Unless financial incentives or material parity emerge, adoption in price-elastic categories will lag. [3]Brett Parker, “Huhtamaki India Hosts Discussion on Recycling Guidance,” Packaging Strategies, packagingstrategies.com
*Our forecasts treat driver/restraint impacts as directional, not additive. The impact forecasts reflect baseline growth, mix effects, and variable interactions.
Segment Analysis
By Packaging Type
Recycled-content solutions retained 59.84% of the green packaging market in 2025, supported by mature collection systems for paper, metal, glass, and PET. Degradable formats, while smaller now, are pacing a 7.58% CAGR and benefit from imminent bans on single-use plastics. The current green packaging market supports investment in both streams because recycling delivers immediate cost advantages whereas degradables future-proof against stricter end-of-life rules. Primary adopters in FMCG select recycled PET for bottle-to-bottle loops, while QSR chains pilot seaweed-based straws that degrade in marine settings. Industrial players leverage reusable drums and crates, demonstrating that longevity and material circularity can coexist within a single green packaging market architecture.
Start-ups in refill logistics deploy IoT-tagged containers that cycle through 30 uses before refurbishment, driving total cost downward across high-density urban corridors. The green packaging market size for reusable systems is projected to climb alongside mass-retail initiatives such as Germany’s PFAND scheme. In parallel, Loop and På(fyll) extend deposit-and-return models into beauty and household segments, evidence that consumer convenience can align with circularity mandates. Collectively, the interplay of recycled, degradable, and reusable designs diversifies revenue pools while creating hedges against raw-material shocks.


By Material: plastics remain dominant but biopolymers accelerate
Recyclable PET, HDPE, and PP combine for 67.71% of 2025 revenue thanks to wide curbside coverage and bottle-grade rPET demand from beverage majors. Mechanical and chemical recycling expansions announced by Indorama and Eastman supply the feedstock required to reach EU recycled-content thresholds. However, PLA and PHA post an 8.06% CAGR, leveraged by policy bans, corporate pilots, and new blends that achieve freezer-grade barrier properties. Paper and paperboard regain share via nano-cellulose coatings that repel grease and water, giving quick-service restaurants an alternative to fluorinated chemistries. The green packaging market size for advanced fibre substrates is projected to expand fastest in e-commerce channels where dimensional quality outranks visual shelf appeal.
Glass and metal’s infinite recyclability secures niche positions in premium beverages and cosmetics where brand equity offsets weight penalties. Aluminum trends up as Ball Corporation’s 85% recycled-content target guarantees contracted demand. Conversely, multilayer laminates lose share because disassembly costs outweigh recycling value, propelling brand owners to mono-material PE or PP solutions. Material substitution decisions thus hinge on balancing functionality, cost, and compliance within each green packaging market application.
By End-User Industry: food sector determines pace and direction
Food applications accounted for 60.72% of revenue in 2025 and are expanding at a 6.45% CAGR, largely because shelf-life, flavour integrity, and safety remain non-negotiable. Nestlé pilots digital watermarking on pet-food sachets to guarantee correct polymer streams while eliminating aluminium layers. Beverage bottlers increase rPET uptake in jurisdictions with deposit systems, thus lifting green packaging market share metrics for recycled plastics. Pharmaceuticals adopt multilayer paper-foil hybrids with tamper-evident features, meeting stringent barrier needs without defaulting to PVC. Beauty brands shift toward refill pods sold in aluminium or paper cartridges, reducing plastic intensity per use by up to 70% and aligning with net-zero marketing narratives.
E-commerce and retail packaging seize attention as breakage reduction and dimensional efficiency improve last-mile economics. Corrugated mailers with on-demand sizing reduce void fill and greenhouse gas emissions, capturing brand loyalty among sustainability-aware online shoppers. Active antimicrobial sachets embedded in produce packs extend freshness, contributing to food-loss mitigation goals that regulators increasingly embed into waste directives. In short, each demand vertical interprets the green packaging market toolbox through its own technical and marketing lens.
By Packaging Function: primary formats drive consumer perception
Primary containers own 69.76% of 2025 sales because the unit that reaches shoppers most strongly shapes brand value. The green packaging market leverages shelf-front real estate to showcase recycled-content logos and QR-enabled provenance data. Secondary packaging, growing at 6.05% CAGR, gains from omnichannel commerce where goods travel longer and face higher drop counts. Automated fit-to-size box machinery minimises corrugate usage and pairs with bio-based hot-melt adhesives that cut fossil inputs by one-third. Tertiary and transport formats chase cost and durability, gravitating to reusable plastic pallets and RFID-tagged totes that track cycle counts and carbon savings.
Digital twin technology now links primary and tertiary layers, enabling inventory and returns optimisation. Operators feeding real-time data into warehouse management systems can adjust material ordering and cleaning cycles, reinforcing cost logic for reusable fleets. Consequently, packaging functions converge into data-rich ecosystems that fine-tune sustainability and efficiency within the wider green packaging market.
Geography Analysis
Europe maintained a 36.21% share in 2025, propelled by the PPWR mandate that compels full recyclability by 2030 and 30% recycled plastic content. Germany’s deposit return rate surpasses 98%, ensuring high-quality PET for bottle-to-bottle loops, while France’s 2025 reuse legislation accelerates refill infrastructure. Nordic innovators deploy fibre-based barriers and digital watermarks, setting functional benchmarks for the region’s sophisticated retail networks. Complex cross-border compliance, however, burdens SMEs that must align labelling, recycled-content, and reporting standards across 27 jurisdictions.
Asia-Pacific delivers the fastest 7.95% CAGR through 2031 as population density and urban consumption surge. India’s packaging sector aims for USD 204.81 billion by 2025 and enforces QR-code traceability to curb informal recycling practices. Japan’s premium brands adopt bio-PET in cosmetic bottles, while South Korea records over 90% food-waste separation, enabling compostable packaging end-of-life processing. China’s export-oriented converters move to meet EU compliance so they can retain market access, cascading stricter specifications through regional supply bases. Rapid uptake, though, strains bio-resin supply, fostering joint ventures in Thailand and Indonesia to localise PLA capacity.
North America shows mixed momentum. California’s EPR rules mandate 50% recyclable or reusable design by 2030 and incentivise refill pilots from big-box retailers. Canada’s Plastics Pact reaches 50% design-for-recycling but still struggles with downstream sorting infrastructure. Meanwhile, mergers such as Novolex–Pactiv Evergreen embed scale advantages in navigating disparate state laws. Mexico’s integration into US supply chains draws investment in recycled-paper mills, aligning cost and sustainability imperatives. These dynamics position the continent to advance selectively, with leadership pockets clustered where regulation, consumer sentiment, and infrastructure intersect.

Regulatory Landscape
Green packaging regulation is being shaped by harmonized rules and enforcement milestones that affect material choice, labeling, and producer obligations. In the European Union, the Packaging and Packaging Waste Regulation (PPWR) and Regulation (EU) 2025/40 entered into force on 11 February 2025 and applies from 12 August 2026, establishing a single compliance framework across Member States for sustainability and labeling requirements. From 12 August 2026, producers must prepare a Declaration of Conformity for packaging, meet stricter heavy-metal concentration limits (lead, cadmium, mercury, and hexavalent chromium not exceeding 100 mg/kg), and comply with restrictions affecting substances such as PFAS in food-contact applications, which is pushing redesign and traceability investments.
In North America, Extended Producer Responsibility (EPR) frameworks are moving toward coordinated reporting and compliance across multiple states, raising the burden for data capture, recycled-content documentation, and fee exposure. Six US states (California, Colorado, Oregon, Minnesota, Maryland, Washington) are progressing EPR reporting obligations, with a milestone reporting deadline of 31 May 2026 in the compliance cycle. California SB 54 further anchors producer registration requirements via the Circular Action Alliance and CalRecycle by 1 June 2026, reinforcing the shift from voluntary sustainability claims to auditable packaging outcomes across procurement, finance, and product development.
Competitive Landscape
The green packaging market remains fragmented, yet recent M&A is raising concentration in core substrates. Smurfit WestRock, now a USD 34 billion paper-based giant, fields 500-plus converting plants across 40 countries and leverages R&D scale to embed barrier-coated fibre in beverage carriers. Novolex’s USD 6.7 billion merger with Pactiv Evergreen secures choke-point positions in food-service disposables, enabling full-portfolio bids that bundle compostable trays, recycled paper bags, and mono-material films. Aluminum can-makers Ball and Ardagh maintain high entry barriers via patented alloy and D&I manufacturing assets, anchoring a near-duopoly in beverage applications.
Technology differentiation pivots on digital watermarking, smart sensors, and chemical recycling IP. Digimarc’s sorting codes, licensed to OMRON, grant early-mover access to closed-loop data that converters exploit for design validation. Marine Innovation’s seaweed matrix patents deliver marine-degradable solutions, winning Korean convenience-store pilots that validate niche but high-visibility channels. Fiber packaging start-ups targeting molded-pulp premium cosmetics brands capture venture funding as luxury players prioritise tactile unboxing experiences with reduced plastic. Larger incumbents hedge via minority stakes—Amcor recently invested in Amylum Systems’ foamed bio-polymer sheets—to keep option value on disruptive chemistries.
Regional specialists persist where logistics or regulation favours proximity. European SMEs producing insulated mushroom-mycelium liners or Nordic fibre trays command local loyalty thanks to shorter lead times and circular supply loops. In emerging markets, flexible-pack converters retrofit extruders for 30% recycled content, an easier lift than full material changeover. These strategic moves reveal a green packaging market balancing consolidation for compliance muscle with niche agility for innovation speed.
Green Packaging Industry Leaders
Amcor PLC
Crown Holdings, Inc.
Mondi Group
International Paper
Sealed Air Corporation
- *Disclaimer: Major Players sorted in no particular order

Market Opportunities and Future Outlook
The most actionable whitespace is at the point where compliance-driven redesign meets scalable capacity for fiber-based, recycle-ready, and solvent-free converting. With the EU PPWR applying from 12 August 2026, demand strengthens for packaging that can be backed by Declarations of Conformity, supported by traceability and harmonized labeling. This creates room for converters to industrialize recyclable mono-material structures, barrier-coated fiber, and higher-PCR solutions without weakening food performance. Company activity in 2026 shows where suppliers are putting capital and partnerships: Amcor began construction of a 7,000-square-meter expansion at its flexible packaging site in Dongguan, China (July 2026) to add automated, solvent-free laminators and high-speed bag-making, and it partnered with Kelpi (June 2026) to explore seaweed-based barrier coatings for fiber packaging, supporting an approach to replace legacy barrier chemistries while keeping fiber formats viable for demanding food applications.
A second opportunity area is regionalizing supply and adding scale in growth markets where brand commitments and regulation converge, but local material and converting capability lags. Capacity actions such as Oben Group signing for a new 12-meter BOPP film line in Brazil with 94,000 tons per year capacity (June 2026) and Mondi completing a EUR 1.2 billion capex program across corrugated and flexible assets (March 2026) increase availability of upgraded substrates and converting infrastructure that can be tuned for downgauging, improved recyclability, and higher recycled content. As EPR reporting and fee mechanisms broaden in the US and Europe moves further into recyclability grading, packaging formats that reduce complexity while remaining compatible with high-throughput sorting and established collection streams support FMCG, food, and e-commerce shippers seeking to standardize specifications across geographies.
Recent Industry Developments
- July 2026: Amcor commenced an expansion project at its flexible packaging facility in Dongguan, China, adding a new 7,000-square-meter manufacturing space and an automated warehouse as part of a broader modernization program. The upgrade brings additional automated, solvent-free laminating and high-speed bag-making capability, strengthening local supply for recyclable flexible formats. It also supports tighter control of quality and throughput for brand owners standardizing sustainable packaging specifications across Asia-Pacific.
- June 2026: Amcor partnered with UK-based startup Kelpi to explore seaweed-based barrier coating technologies for its AmFiber fiber-based packaging solutions. The collaboration targets improved barrier performance for fiber packaging where grease and moisture resistance are critical, especially in food applications. Advancing fiber-based barriers expands the addressable space for plastic replacement while keeping packaging compatible with recycling-focused policy and brand requirements.
- July 2024: Smurfit Kappa and WestRock closed their USD 34 billion merger, creating Smurfit WestRock and expanding global scale in paper-based packaging. The combined footprint increases access to barrier-coated fiber R&D and integrated converting capacity across multiple end markets. Consolidation at this level strengthens the ability to fund compliance-driven innovation and offer multinational customers standardized solutions across regions.


Research Methodology Framework and Report Scope
Market Definition and Coverage
For this study, the green packaging market is defined as packaging materials and formats designed to reduce environmental impact through recyclability, recycled content, reusability, or biodegradability, as they are used to pack and transport goods across end-use industries.
Scope exclusions: This sizing excludes unrelated sustainability services (such as recycling operations and waste collection) unless they are priced and sold as part of a packaging product offering.
Segmentation Overview
- By Packaging Type
- Recycled-Content Packaging
- Paper
- Metal
- Plastic
- Glass
- Reusable Packaging
- Drums
- Plastic Crates and IBCs
- Pallets and Dunnage
- Degradable Packaging
- Compostable Biopolymers
- Edible and Water-soluble Films
- Recycled-Content Packaging
- By Material
- Paper and Paperboard
- Glass
- Metals (Al, Steel)
- Rigid and Flexible Recyclable Plastics
- Biopolymers (PLA, PHA, Starch blends)
- By End-User Industry
- Food
- Beverage
- Pharmaceutical
- Personal Care and Cosmetics
- E-commerce and Retail
- Other End-User Industry
- By Packaging Function
- Primary
- Secondary
- Tertiary / Transport
- By Geography
- North America
- United States
- Canada
- Mexico
- Europe
- Germany
- United Kingdom
- France
- Italy
- Spain
- Russia
- Rest of Europe
- Asia-Pacific
- China
- India
- Japan
- South Korea
- Australia and New Zealand
- Rest of Asia-Pacific
- Middle East and Africa
- Middle East
- United Arab Emirates
- Saudi Arabia
- Turkey
- Rest of Middle East
- Africa
- South Africa
- Nigeria
- Egypt
- Rest of Africa
- Middle East
- South America
- Brazil
- Argentina
- Rest of South America
- North America
Data Sources, Market Sizing, and Validation
Desk Research
We start with public information that helps anchor packaging demand and materials availability, and then we align it to what buyers actually purchase. Common references include sources such as the US EPA for packaging waste and recycling context, Eurostat for EU packaging and waste statistics, UN Comtrade for packaging material trade flows, and the World Bank for macro indicators linked to consumption and manufacturing.
Company annual reports, investor presentations, and packaging association publications are used to understand product mixes, pricing direction, and adoption timelines by region. For specific checks, we also use paid subscriptions focused on company financials and intelligence, patent databases, and shipment-level import and export data to validate activity signals. These desk sources are not exhaustive, and we also used other public and paid references to collect data, run cross-checks, and clarify specific assumptions during the work.
Primary Interviews and Surveys
Inputs were then validated through expert interviews and structured surveys with packaging converters, material suppliers, brand owners, and channel participants. We also covered major demand regions so differences in regulation, recycling infrastructure, and end-use intensity could be reflected in assumptions, and then we checked those assumptions again before finalizing the model.
Distribution of primary research fieldwork respondents
| Company type | Respondent position | Region |
|---|---|---|
| Top tier: 36% | CXOs: 12% | APAC: 46% |
| Mid tier: 49% | Functional/Unit leaders: 32% | EMEA: 33% |
| Smaller Players: 15% | Managers: 56% | Americas: 21% |
Market-Sizing & Forecasting
Sizing is built using a top-down approach where packaging demand is reconstructed from end-use activity and material use patterns, and then allocated into green packaging based on adoption and substitution rates. To keep the totals realistic, we corroborate results with selective bottom-up approximations, such as sampled price per unit by format and region, supplier and converter revenue signals, and channel checks on mix shifts.
Key inputs used in the model include packaging material consumption trends (paper and paperboard, glass, metals, plastics, and biopolymers), recycled content availability, trade movement for packaging materials, regulatory push indicators around single-use packaging, and end-use output trends in food and beverage and retail shipping. When the data is thinner for a country or a niche format, we handle gaps by using proxy indicators like regional per-capita packaging use and then adjusting based on interview feedback on penetration.
For forecasting, scenario analysis is used to reflect how fast recycled-content and reusable packaging adoption can progress under different policy strength and infrastructure readiness assumptions, and then the scenarios are narrowed using the most consistent expert consensus from primary work. The final forecast is converted into market values using transparent price progression logic that follows raw material direction and observed premium changes for sustainable formats.
Data Validation & Update Cycle
Outputs are triangulated across independent signals, and we run variance checks by region, material group, and end-use intensity to catch totals that move out of line with observable packaging demand. When an anomaly shows up, the underlying drivers are rechecked, and we complete a second pass through follow-up questions to the sources who informed the specific assumption.
Before sign-off, the model and assumptions go through multi-step analyst reviews so calculation logic and input selections remain consistent. Reports are refreshed annually, and interim updates are triggered when material policy changes, major capacity shifts, or sharp feedstock price moves can change the near-term view. Right before delivery, we complete a fresh update pass so clients receive the latest available market numbers and commentary.
Mordor Intelligence's Green Packaging Market Size Versus Other Published Estimates
Published market sizes for green packaging can differ even when the same headline term is used, and this usually comes down to what is counted, the timing of the base year, and how pricing is carried through the forecast. Differences also show up when one study leans more on stated targets versus observed adoption, especially for recycled-content packaging and reusable formats.
Some published figures use a broader sustainable packaging umbrella and may blend adjacent environmental services or loosely defined eco-claims into the total. In Mordor Intelligence, the number is limited to packaging products and formats that are sold into end-use packaging functions and then filtered by clear green criteria across materials and packaging types, which reduces double counting when recycled content and degradable claims overlap.
Benchmark comparison
| Source | Market Size | Gaps in Research Methodology |
|---|---|---|
| Mordor Intelligence | USD 367.62 B (2026) | |
| Global Consultancy A | USD 365.46 B (2025) | Uses a different base year and a shorter forecast window, and the definition emphasizes green materials and solutions but can treat certain end-use applications and premium pricing assumptions differently by region. |
| Industry Publisher B | USD 362.01 B (2025) | Reports a higher-growth outlook over a longer horizon, and the estimate can shift depending on how recyclable versus biodegradable formats are grouped, plus how currency timing and price progression are applied. |
The spread in the table is mainly explained by year selection and by how tightly the green criteria are applied to packaging formats across materials and functions. By keeping assumptions tied to observable packaging demand signals and then validating adoption and pricing with primary inputs, we end up with a market size that can be traced back to clear steps and updated consistently.


Key Questions Answered in the Report
What is the current size of the green packaging market?
The green packaging market size reached USD 367.62 billion in 2026 and is projected to rise to USD 456.55 billion by 2031.
Which region leads the green packaging market?
Europe holds the largest share at 36.21% thanks to strict EU regulations that mandate recyclability and recycled-content targets.
Which segment is growing the fastest within green packaging?
Degradable packaging shows the highest growth with a 7.58% CAGR to 2031 as bans on single-use plastics intensify.
Why are digital watermarks important in green packaging?
Digital watermarks enable high-speed automated sorting that upgrades recycled material purity and lowers processing costs.
How are companies addressing cost barriers in sustainable packaging?
Firms pursue light-weighting, reuse cycles, and recycled feedstocks to offset higher unit prices of eco-friendly materials.
What recent M&A activity has reshaped the competitive landscape?
The USD 34 billion Smurfit Kappa–WestRock merger and USD 6.7 billion Novolex–Pactiv Evergreen deal illustrate moves toward global consolidation to meet diverse sustainability mandates.
Page last updated on:


