Recycled Materials Packaging Solutions Market Size and Share
Market Overview
| Study Period | 2020 - 2031 |
|---|---|
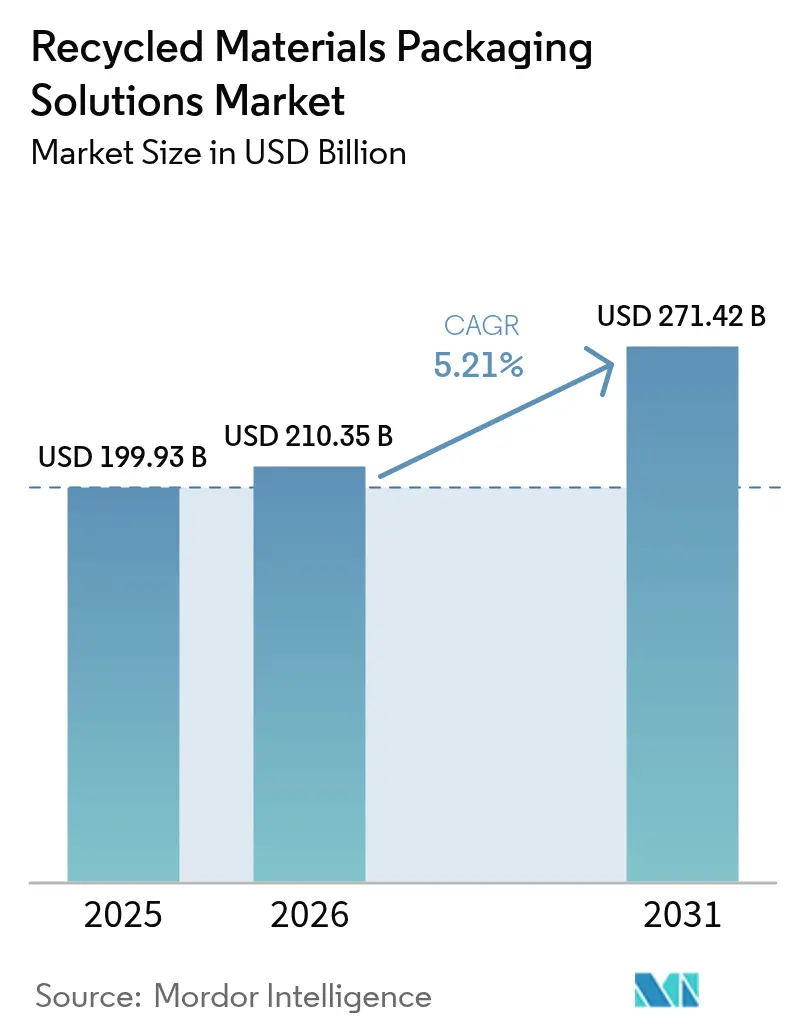
| Market Size (2026) | USD 210.35 Billion |
| Market Size (2031) | USD 271.42 Billion |
| Growth Rate (2026 - 2031) | 5.21% CAGR |
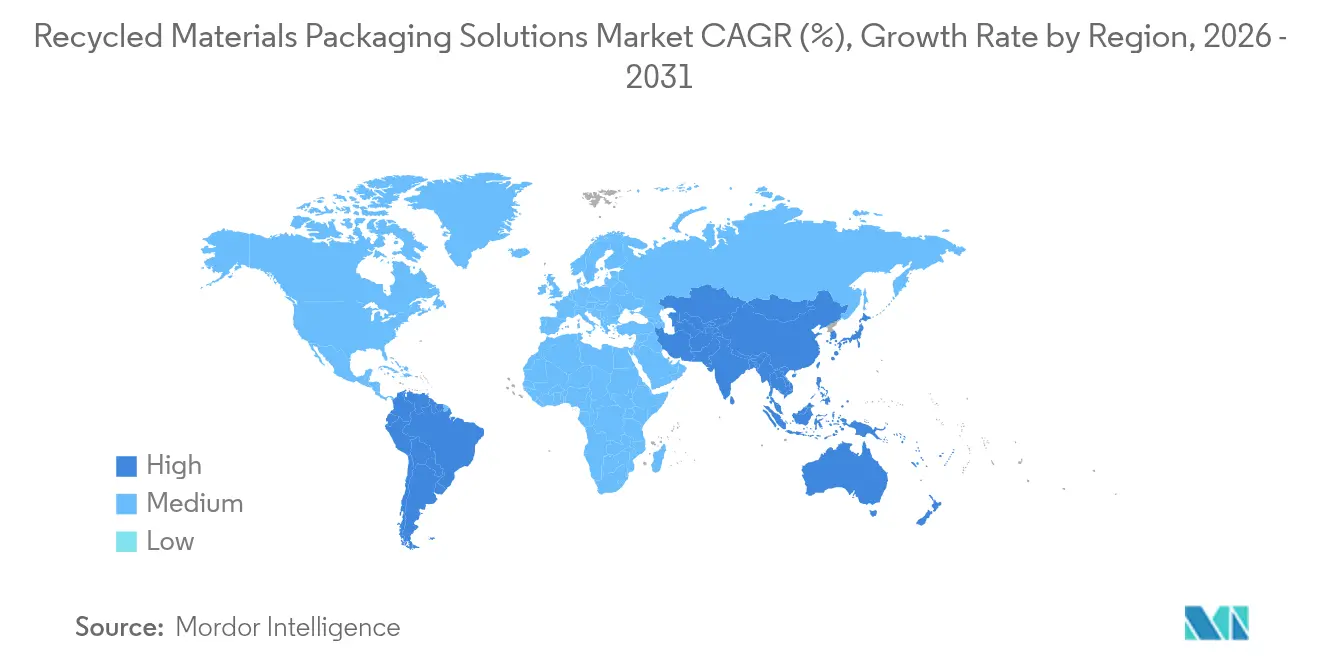
| Fastest Growing Market | Asia Pacific |
| Largest Market | Asia Pacific |
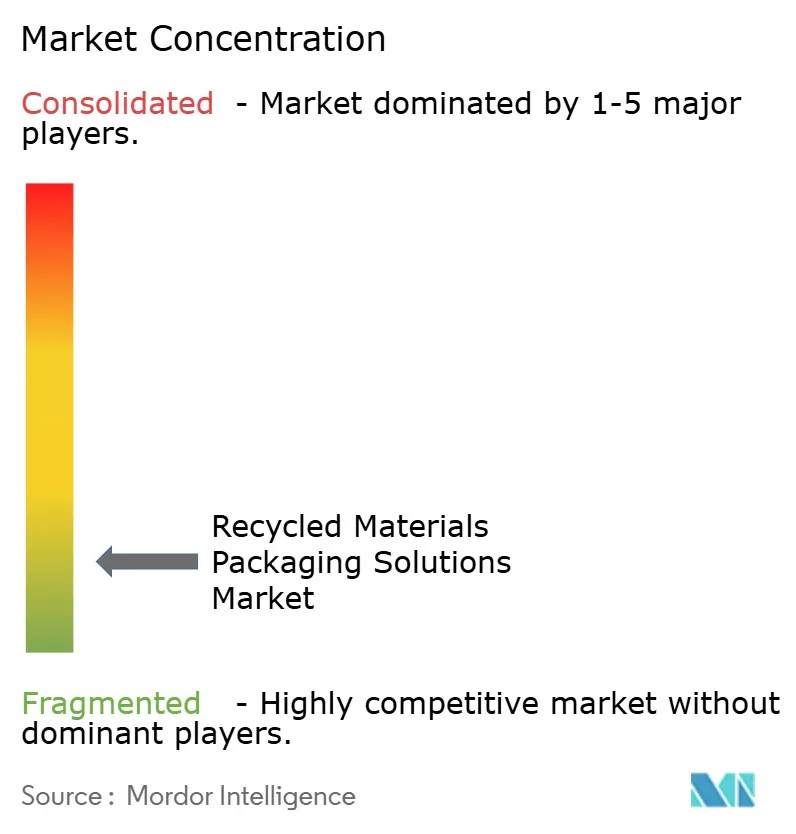
| Market Concentration | Low |
Major Players *Disclaimer: Major Players sorted in no particular order Image © Mordor Intelligence. Reuse requires attribution under CC BY 4.0. | |
Recycled Materials Packaging Solutions Market Analysis by Mordor Intelligence
The recycled materials packaging solutions market size in 2026 is estimated at USD 210.35 billion, growing from 2025 value of USD 199.93 billion with 2031 projections showing USD 271.42 billion, growing at 5.21% CAGR over 2026-2031. Rising Extended Producer Responsibility mandates, brand-owner recycled-content targets, and investments in artificial-intelligence sortation are collectively positioning the recycled materials packaging solutions market for sustained growth. Asia-Pacific secures early-mover advantages through evolving regulations and large-scale infrastructure projects, while North America and Europe build capacity through chemical recycling and vertically integrated feedstock procurement. Demand is reinforced by consumers willing to pay premiums for low-carbon packaging, which smooths cost differentials between recycled and virgin materials. At the same time, supply-side innovations such as dissolution-based recycling and mono-material flexible pouches are narrowing performance gaps against incumbent virgin solutions.
Key Report Takeaways
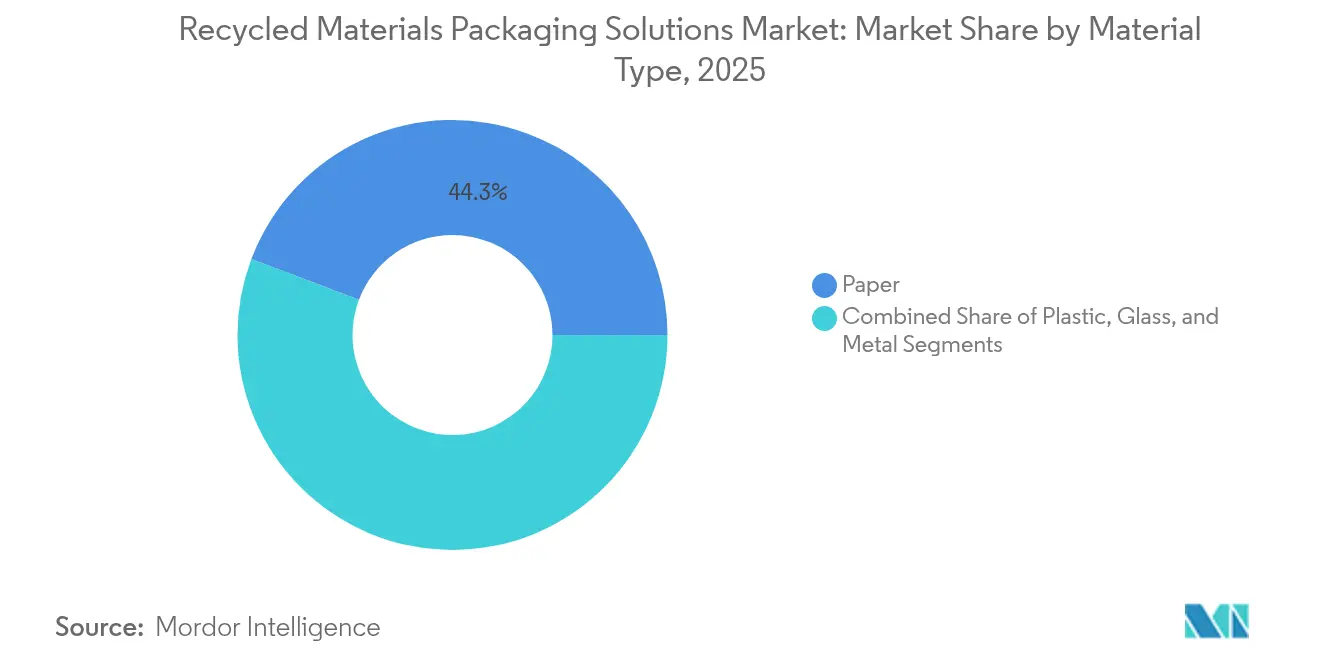
- By material type, paper captured 44.25% of the recycled materials packaging solutions market share in 2025, whereas the plastic segment is projected to grow at a 6.03% CAGR between 2026-2031.
- By end-user industry, food applications captured 36.20% of the recycled materials packaging solutions market share in 2025, whereas the home and personal care segment is projected to grow at a 6.58% CAGR between 2026-2031.
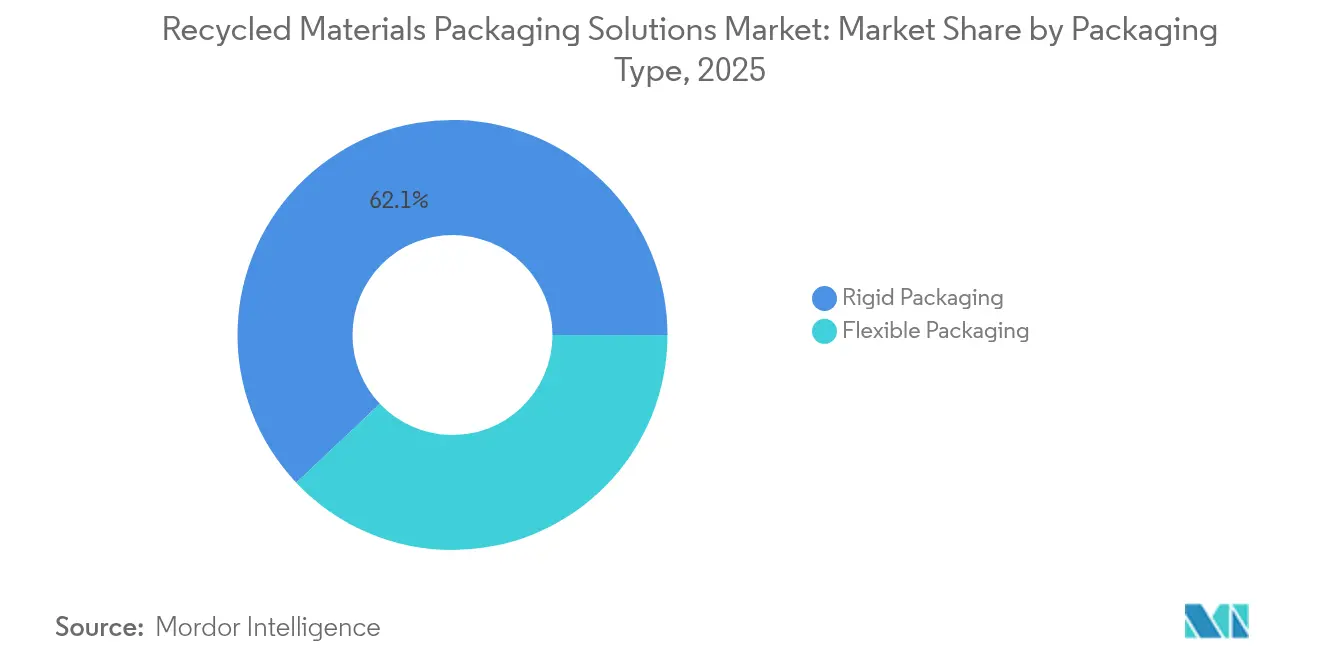
- By packaging type, the rigid packaging segment captured 62.05% of the recycled materials packaging solutions market share in 2025. The flexible packaging segment is projected to grow at a 6.84% CAGR between 2026-2031.
- By source of recycled material, post-consumer recyclate captured 48.55% of the recycled materials packaging solutions market share in 2025. The ocean-bound waste segment is projected to grow at a 7.32% CAGR between 2026-2031.
- By geography, Asia-Pacific captured 45.80% of the recycled materials packaging solutions market share in 2025 and is projected to grow at a 7.55% CAGR between 2026-2031.
Note: Market size and forecast figures in this report are generated using Mordor Intelligence’s proprietary estimation framework, updated with the latest available data and insights as of 2026.
Global Recycled Materials Packaging Solutions Market Trends and Insights
Drivers Impact Analysis*
| Driver | (~) % Impact on CAGR Forecast | Geographic Relevance | Impact Timeline |
|---|---|---|---|
| Extended Producer Responsibility (EPR) Mandates Expansion | +1.2% | Global, with early gains in Europe, North America, and the Asia-Pacific | Medium term (2-4 years) |
| Brand-Owner 2025 Recycled-Content Targets | +0.9% | Global, concentrated in North America and Europe | Short term (≤ 2 years) |
| Advanced Sortation Technologies: Reducing Contamination | +0.7% | North America & EU, spill-over to the Asia-Pacific core | Medium term (2-4 years) |
| Consumer Preference for Low-Carbon Packaging | +0.8% | Global, with premium markets leading adoption | Long term (≥ 4 years) |
| Corporate Net-Zero Commitments Accelerating PCR Procurement | +1.1% | Global, with multinational corporations driving demand | Medium term (2-4 years) |
| Surging Investment in Chemical Recycling Capacity | +0.6% | North America & EU, expanding to Asia-Pacific | Long term (≥ 4 years) |
| Source: Mordor Intelligence | |||


Extended Producer Responsibility (EPR) Mandates Expansion
EPR statutes shift end-of-life costs from municipalities to producers, making recycled content economically attractive. Vietnam’s 2024 rules require 22% recycling for rigid PET and 40% material recovery rates, sparking rapid equipment upgrades. South Korea is boosting the required recycled plastic in PET bottles from 3% to 10% and targets 30% by 2030. Thailand’s label-free PET initiative trims contamination and considers tax credits for recycled resin. The EU Packaging and Packaging Waste Regulation mandates 30% recycled PET in food packaging by 2030.[1]National Law Review, “EU Proposal on Packaging Waste Regulation,” natlawreview.com India now allows specified recycled plastics in food packaging, requiring traceability labelling.
Brand-Owner 2025 Recycled-Content Targets
Global brands are voluntarily outpacing regulation. Estée Lauder seeks at least 25% PCR and to halve virgin plastic by 2030. Mars moved key confectionery jars to 100% recycled resin, cutting 1,300 tonnes of virgin plastic each year. Mondelēz will package 300 million Cadbury sharing bars in 80% attributable recycled plastic. Cadbury Australia sourced 1,000 tonnes of chemically recycled polypropylene for Dairy Milk bars.
Advanced Sortation Technologies: Reducing Contamination
AI-enabled optical sorters now reach 99% purity in PET, boosting mechanical recycling yields.[2]Packaging World, “Cadbury Uses Chemically Recycled Plastic,” packworld.com Real-time contamination analytics at more than 150 materials-recovery facilities increase capture rates by 30% and enhance feedstock predictability. Computer-vision platforms accurately classify 28 materials, informing designers of recyclability trade-offs. Flexible packaging streams benefit most, as AI unlocks higher value from what was previously landfill-bound.
Consumer Preference for Low-Carbon Packaging
Around 73% of global shoppers say they will change buying habits to cut environmental impact, with sustainable packaging ranking just behind price and quality. Willingness-to-pay premiums reaches 81% among Europeans, reinforcing recycled content strategies in premium segments. Millennials and Gen Z lead demand, driving rapid uptake in personal care and food categories that can justify premium pricing.
Restraints Impact Analysis*
| Restraint | (~) % Impact on CAGR Forecast | Geographic Relevance | Impact Timeline |
|---|---|---|---|
| Volatile Supply of High-Quality Recycled Feedstock | -0.8% | Global, with acute shortages in the Asia-Pacific and MEA | Short term (≤ 2 years) |
| Competing Demand from Fiber-Based Substitute Packaging | -0.5% | North America & EU, expanding to Asia-Pacific | Medium term (2-4 years) |
| Unfavorable Economics when Virgin Resin Prices Decline | -0.7% | Global, with oil-dependent regions most affected | Short term (≤ 2 years) |
| Recycling Infrastructure Gaps in Emerging Markets | -0.6% | Asia-Pacific core, MEA, and Latin America | Long term (≥ 4 years) |
| Source: Mordor Intelligence | |||
Volatile Supply of High-Quality Recycled Feedstock
Pricing for recycled PET and high-density polyethylene swings widely, imposing budgeting challenges for converters. Beverage brands recently queued 6-8 weeks for food-grade rPET while virgin alternatives were available in 3 weeks. Contamination means 15-25% of collected plastics fail food-grade tests, forcing some brands to under-fulfill recycled-content pledges. The volatility is most acute for barrier materials that demand specialty grades.
Competing Demand from Fiber-Based Substitute Packaging
Molded fiber solutions now mimic plastic barriers, eroding share in cosmetics, electronics, and convenience food packaging. Compostable fiber pouches with water-based coatings meet grease-resistance requirements at a lower unit cost. Established paper recycling networks ease consumer disposal, pulling demand away from recycled plastic whenever barrier performance is acceptable.
*Our forecasts treat driver/restraint impacts as directional, not additive. The impact forecasts reflect baseline growth, mix effects, and variable interactions.
Segment Analysis
By Material Type: Paper Dominance Faces Plastic Innovation
In 2025, paper commanded 44.25% of the recycled materials packaging solutions market share, reflecting mature fiber collection systems and corrugated recovery rates above 90% in North America. Plastic is projected to post a 6.03% CAGR through 2031 as chemical recycling improves food-grade quality and unlocks new applications. Glass continues serving premium beverage and cosmetic niches where brand equity values tactile heft. Metal offers infinite recyclability that attracts closed-loop purchasers, buttressing its role in aerosol, beverage, and cosmetics packaging even when volumes remain modest.
Paper maintains steady growth due to global e-commerce, but plastics claim future upside. Investment topping USD 8 billion accelerates chemical recycling to offset the shortfall in food-grade rPET. Examples such as Eastman’s Gemini compact underscore plastics’ progress into cosmetics using molecularly recycled resins. Consequently, the recycled materials packaging solutions market expects a gradual convergence in the material mix between paper and plastic solutions.


By End-User Industry: Food Leadership Yields to Personal Care Growth
Food applications generated 36.20% of 2025 demand, but regulatory safety thresholds constrain growth. India’s new allowance of specific recycled plastics in food packaging under strict traceability slightly relaxes barriers. Beverage brands such as PepsiCo demonstrate 50% recycled polypropylene snack packs, hinting at broader adoption where performance permits.
Home and personal care is set to rise at a 6.58% CAGR, as consumers accept premiums for low-carbon formats. Ball Corporation financed Meadow to launch fully recyclable aluminum cartridges for soaps and shampoos, showing brand readiness to switch materials swiftly. Secondary industries such as e-commerce and industrial packaging also incorporate more PCR as collection networks mature, broadening the recycled materials packaging solutions market.
By Packaging Type: Rigid Formats Leverage Deposit Systems and Reuse Models
Rigid packaging captured 62.05% of the recycled materials packaging solutions market share in 2025. Deposit return schemes for bottles and containers deliver high-purity feedstock that underpins the segment’s reliable recovery economics. Formats such as bottles, jars, and molded containers maintain dimensional stability that protects products and simplifies downstream sortation relative to flexible laminates. Glass preserves premium status in cosmetics and beverages, while aluminum cans average 75% recycled content and circulate indefinitely, reinforcing closed-loop economics. Deposit infrastructure also curbs contamination, enabling rigid plastics to satisfy food-grade thresholds more consistently than flexible counterparts.
Mature curbside and take-back networks grant rigid formats cost advantages when extended producer responsibility fees hinge on recyclability scores. Brother Industries’ cartridge remanufacturing program exemplifies how sturdy housings can be refurbished multiple times, lengthening material life spans well beyond single-use cycles. Reusable shipping boxes from The Ocean Package highlight the segment’s pivot toward e-commerce, achieving several delivery cycles before entering recycling streams. Regulatory momentum reinforces this outlook: the EU will require all packaging to meet recyclability grades of at least 70% by 2030, a benchmark most mono-material rigid items already satisfy. Taken together, these factors point to steady volume growth for rigid formats even as flexible packaging advances technologically, preserving their central role in circular value chains.
By Source of Recycled Material: Ocean-Bound Waste Emerges
Post-consumer recyclate supplied 48.55% of feedstock in 2025, underscoring reliance on curbside collection infrastructure. Ocean-bound and recovered waste streams are set for a 7.32% CAGR as companies monetize marine pollution prevention. Clear Ocean and better-packaging alliances collect coastal plastic that commands brand premiums. PlastX provides traceable recovered plastic across Asia, meeting supply-chain transparency requirements.
Post-industrial recyclate keeps its role as a low-contamination material for specialty applications. Yet ocean-bound initiatives supply new narratives that translate into shelf differentiation, reinforcing the recycled materials packaging solutions market trend toward diverse feedstock portfolios.
Geography Analysis
Asia-Pacific held 45.80% of the recycled materials packaging solutions market size in 2025 and will grow at a 7.55% CAGR. Regulatory clarity, such as Vietnam’s EPR targets, South Korea’s recycled-content thresholds, and Thailand’s tax incentives, is reinforcing investment flows. Infrastructure financing across ASEAN nations addresses collection bottlenecks, closing gaps that historically impeded supply consistency.
North America benefits from USD 8 billion in announced recycling expansions since 2017, adding capacity to process almost 9 million tonnes of waste annually. Extended Producer Responsibility laws in Oregon and Colorado that take effect in July 2025 clarify producer fees and spur redesign toward recyclability. Corporate procurement commitments secure offtake, supporting a stable investment outlook. Europe sustains regulatory leadership. Mandatory 30% recycled PET for food packaging by 2030 and design-for-recycling criteria foster innovation pipelines. Collaborative platforms such as 4evergreen and FINAT develop technical guidance for paper and label liner recycling, respectively. Moderate growth in South America and the Middle East & Africa reflects emerging grant funding and nascent EPR frameworks that gradually enlarge the recycled materials packaging solutions market.

Competitive Landscape
Regional fragmentation defines the recycled materials packaging solutions industry, though vertical integration is increasing. Paper recycling shows higher consolidation due to capital intensity, while plastic recycling welcomes new entrants deploying proprietary chemical processes. Partnerships such as Plastipak with Kraft Heinz on 100% rPET ketchup containers illustrate brand-converter collaboration aimed at locking in secure feedstock.
Technology firms specializing in AI sortation, ocean-bound plastic recovery, and dissolution recycling introduce competitive tension. ExxonMobil, Dow, and Eastman invest heavily in technologies that yield food-safe resins, often protected by patent portfolios. Industry-wide programs like GreenBlue’s Recycled Material Standard offer certification frameworks that underpin transparent trade in recycled content.
As consolidation progresses, major converters acquire regional recyclers to assure supply security and quality control. This trend, combined with joint ventures in chemical recycling, positions the recycled materials packaging solutions market for gradual but decisive movement toward an integrated circular value chain.
Recycled Materials Packaging Solutions Industry Leaders
Amcor plc
Smurfit WestRock plc
International Paper Company
Mondi plc
Sealed Air Corporation
- *Disclaimer: Major Players sorted in no particular order

Recent Industry Developments
- February 2025: South Korea's Ministry of Environment announced amendments to strengthen mandatory recycled plastic use in PET bottle manufacturing, shifting requirements from raw material producers to final manufacturers using at least 5,000 tonnes annually and raising recycled content requirements from 3% to 10%, targeting 30% by 2030.
- January 2025: Ball Corporation made a minority investment in Sweden-based Meadow to support production of fully recyclable aluminum cans used as pre-filled cartridges for home and personal care products, with the MEADOW KAPSUL solution expected to appear in stores in 2025.
- November 2024: Amcor announced that Mondelēz International will shift Cadbury sharing bars sold in the UK and Ireland to packaging that is 80% attributable to recycled plastic via mass balance and ISCC PLUS certification, targeting approximately 300 million bars based on forecasted 2026 sales.
- July 2024: Cadbury Australia adopted 1,000 tonnes of certified-circular biaxially oriented polypropylene produced via ExxonMobil's Exxtend pyrolysis technology, sufficient for roughly 500 million family-sized Dairy Milk blocks, with plans to expand to other chocolate bar varieties.


Global Recycled Materials Packaging Solutions Market Report Scope
The market is defined by the revenue accrued from the sales of resins and products made from recycled materials and the volume that uses recycled raw materials.
The recycled materials packaging solutions market is segmented by material (plastic, paper, glass, and metal), end-user industry (food, beverage, home and personal care, healthcare, and other end-user industries), and geography (North America, Europe, Asia Pacific, Latin America, and Middle East and Africa). The Market Sizes and Forecasts are Provided in Terms of Value (USD) and Volume (Tons) for all the Above Segments.
| Plastic |
| Paper |
| Glass |
| Metal |
| Food |
| Beverage |
| Home and Personal Care |
| Healthcare |
| Other End-user Industries |
| Rigid Packaging |
| Flexible Packaging |
| Post-consumer Recyclate (PCR) |
| Post-industrial Recyclate (PIR) |
| Ocean-bound and Recovered Waste |
| North America | United States | |
| Canada | ||
| Mexico | ||
| South America | Brazil | |
| Argentina | ||
| Rest of South America | ||
| Europe | Germany | |
| France | ||
| United Kingdom | ||
| Italy | ||
| Spain | ||
| Rest of Europe | ||
| Asia-Pacific | China | |
| Japan | ||
| India | ||
| South Korea | ||
| ASEAN Countries | ||
| Australia and New Zealand | ||
| Rest of Asia-Pacific | ||
| Middle East and Africa | Middle East | Saudi Arabia |
| United Arab Emirates | ||
| Turkey | ||
| Rest of Middle East | ||
| Africa | South Africa | |
| Nigeria | ||
| Egypt | ||
| Rest of Africa | ||
| By Material Type | Plastic | ||
| Paper | |||
| Glass | |||
| Metal | |||
| By End-User Industry | Food | ||
| Beverage | |||
| Home and Personal Care | |||
| Healthcare | |||
| Other End-user Industries | |||
| By Packaging Type | Rigid Packaging | ||
| Flexible Packaging | |||
| By Source of Recycled Material | Post-consumer Recyclate (PCR) | ||
| Post-industrial Recyclate (PIR) | |||
| Ocean-bound and Recovered Waste | |||
| By Geography | North America | United States | |
| Canada | |||
| Mexico | |||
| South America | Brazil | ||
| Argentina | |||
| Rest of South America | |||
| Europe | Germany | ||
| France | |||
| United Kingdom | |||
| Italy | |||
| Spain | |||
| Rest of Europe | |||
| Asia-Pacific | China | ||
| Japan | |||
| India | |||
| South Korea | |||
| ASEAN Countries | |||
| Australia and New Zealand | |||
| Rest of Asia-Pacific | |||
| Middle East and Africa | Middle East | Saudi Arabia | |
| United Arab Emirates | |||
| Turkey | |||
| Rest of Middle East | |||
| Africa | South Africa | ||
| Nigeria | |||
| Egypt | |||
| Rest of Africa | |||


Key Questions Answered in the Report
What is the current value of the recycled materials packaging solutions market?
The recycled materials packaging solutions market size is USD 210.35 billion in 2026.
How fast is the Asia-Pacific region growing?
Asia-Pacific is advancing at a 7.55% CAGR and holds the largest geographic share.
Which packaging type is expanding the quickest?
Flexible formats are growing at a 6.84% CAGR, supported by mono-material design progress.
Why are brands investing in ocean-bound plastic feedstock?
Verified ocean-bound sources provide brand differentiation and help meet recycled-content mandates.
What are the chief restraints limiting recycled content adoption?
Supply volatility for food-grade feedstock and competition from fiber-based alternatives curb faster uptake.
Page last updated on:


