Dried Spices Market Size and Share
Market Overview
| Study Period | 2021 - 2031 |
|---|---|
| Market Size (2026) | USD 17.23 Billion |
| Market Size (2031) | USD 23.23 Billion |
| Growth Rate (2026 - 2031) | 6.16% CAGR |
| Fastest Growing Market | Middle East and Africa |
| Largest Market | Asia Pacific |
| Market Concentration | Low |
Major Players
*Disclaimer: Major Players sorted in no particular order Image © Mordor Intelligence. Reuse requires attribution under CC BY 4.0. |
|
Dried Spices Market Analysis by Mordor Intelligence
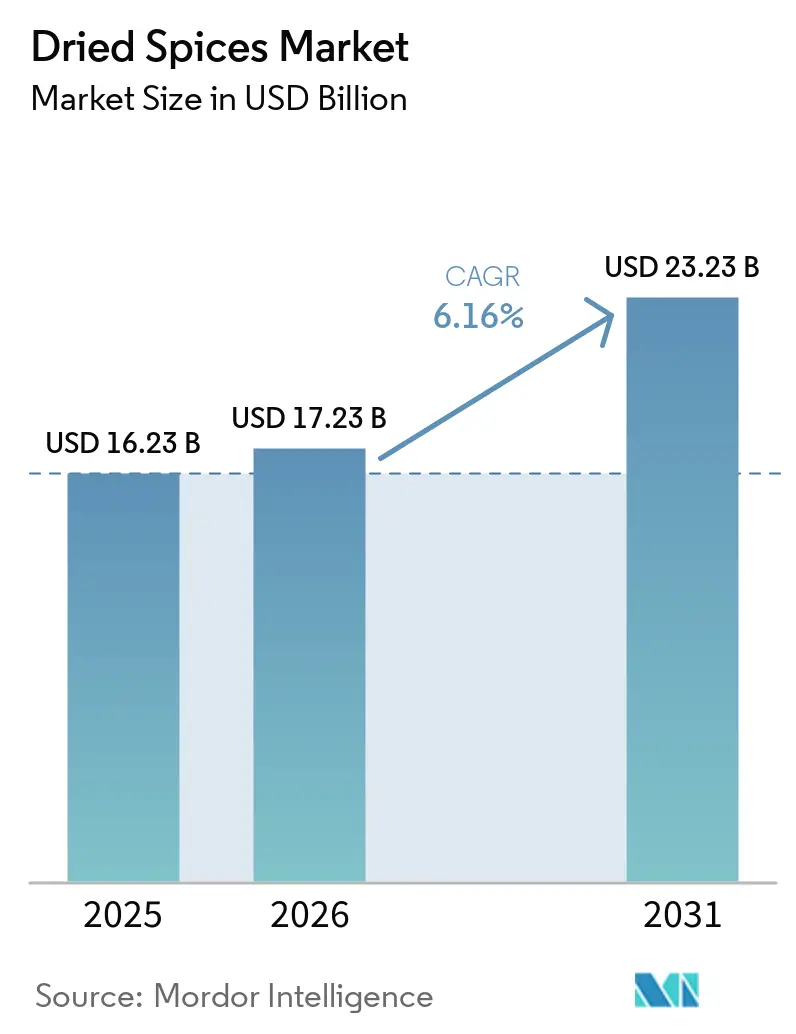
The dried spices market size is expected to grow from USD 16.23 billion in 2025 to USD 17.23 billion in 2026, and is forecast to reach USD 23.23 billion by 2031, at a 6.16% CAGR over 2026-2031. The global dried spices market is undergoing a structural transformation, driven by shifting consumer preferences toward authenticity, health-focused ingredients, and sustainable sourcing. While traditional spice formats remain relevant, demand for organic and clean-label products is accelerating, reflecting a trend toward innovation. Distribution channels are expanding, with food-service and e-commerce reshaping market access and enabling greater customization. At the same time, increased regulatory oversight and supply chain disruptions are emphasizing the importance of resilience and stringent quality assurance. Overall, the market is strategically balancing heritage with modernity, positioning spices as both essential culinary commodities and functional lifestyle products.
Key Report Takeaways
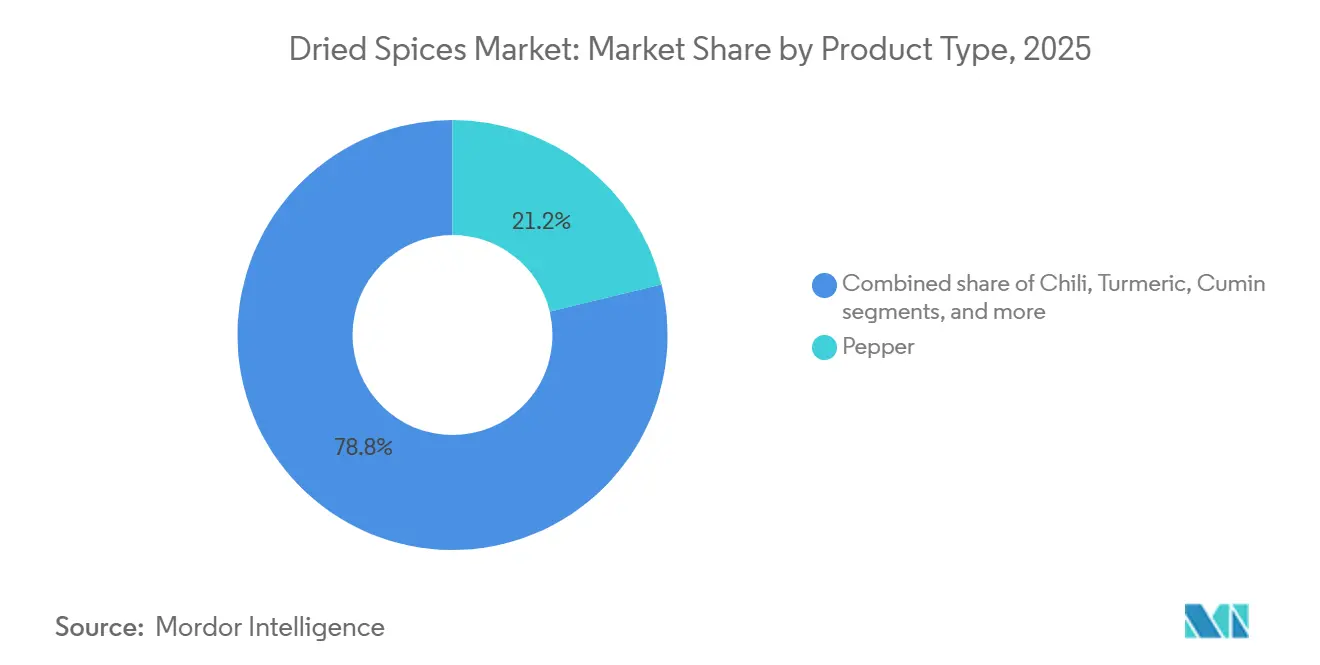
- By product type, pepper led with a 21.23% revenue share of the dried spices market in 2025, while cinnamon is expected to expand at a 6.78% CAGR through 2031.
- By form, crushed, ground, and powdered formats held 61.28% of the dried spices market share in 2025; while whole spices are forecast to outpace all other formats at a 7.02% CAGR between 2026-2031.
- By nature, conventional offerings commanded 87.33% of the dried spices market size in 2025, and organic dried spices are expected to grow at a 7.95% CAGR to 2031.
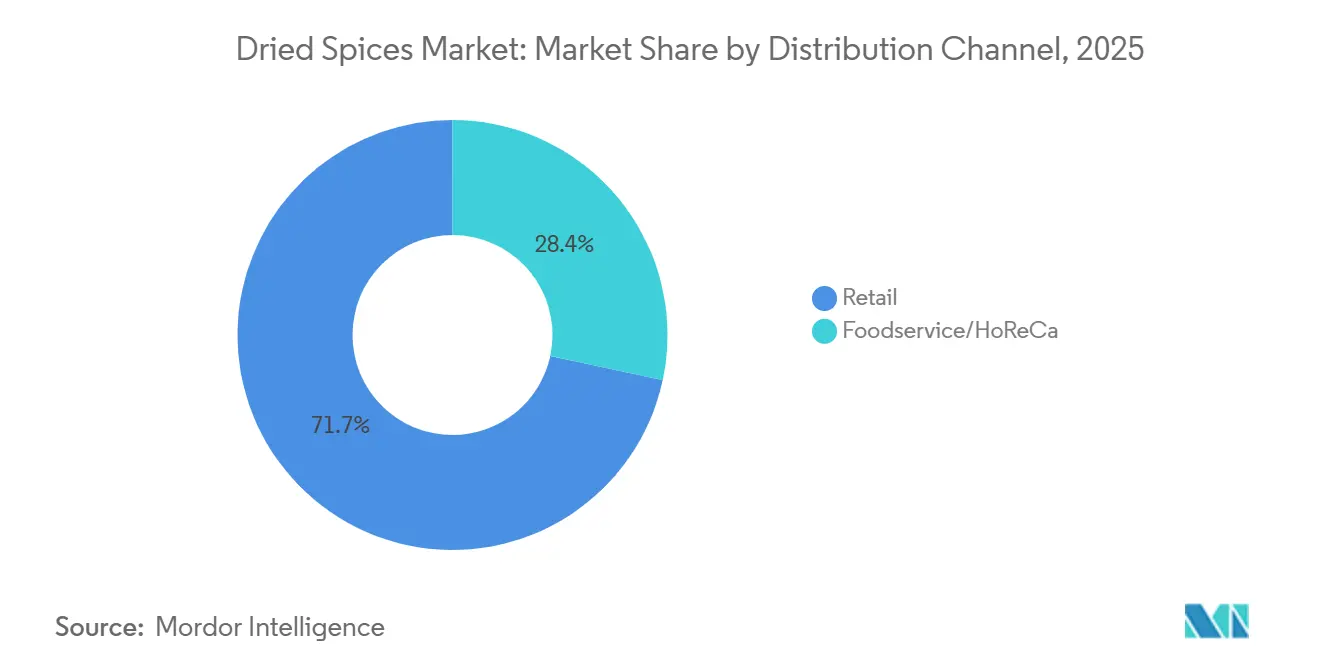
- By distribution channel, the retail segment commanded 71.65% of the dried spices market size in 2025, while foodservice/HoReCa is projected to record an 8.58% CAGR from 2026-2031.
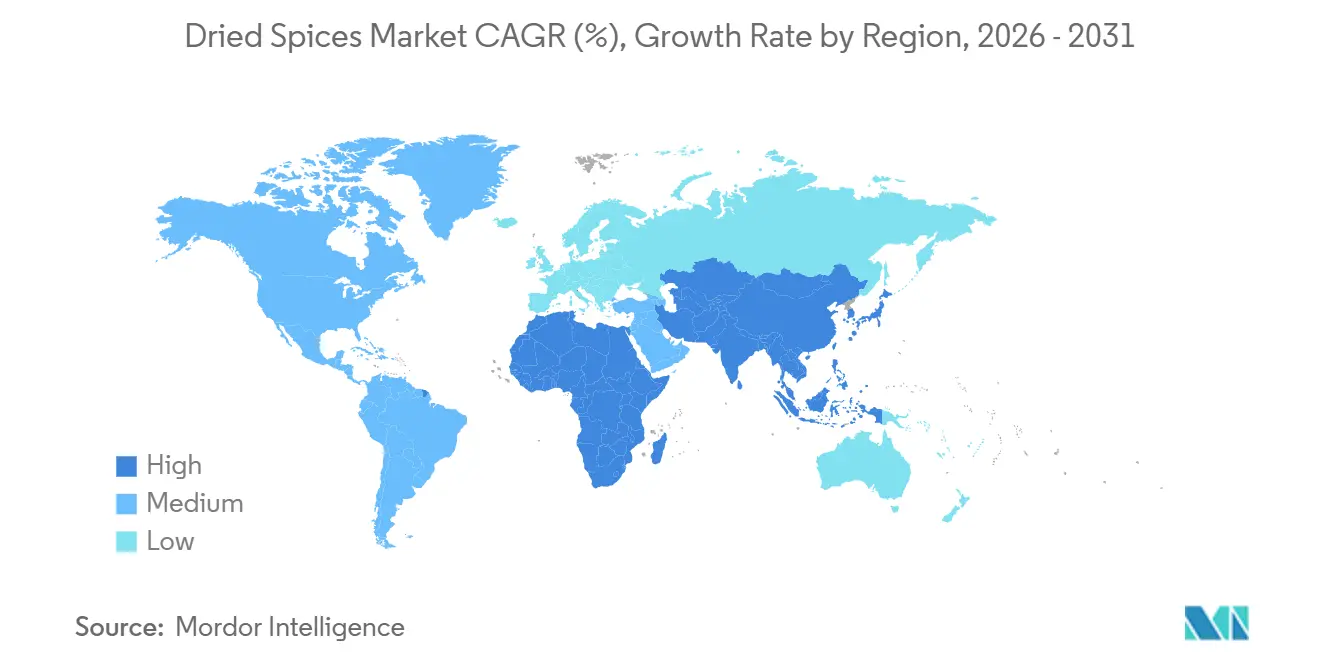
- By geography, Asia-Pacific retained 38.97% of the dried spices market in 2025, while the Middle East and Africa are projected to register a 9.01% CAGR to 2031.
Note: Market size and forecast figures in this report are generated using Mordor Intelligence’s proprietary estimation framework, updated with the latest available data and insights as of January 2026.
Global Dried Spices Market Trends and Insights
Drivers Impact Analysis*
| Drivers | (~) % Impact on CAGR Forecast | Geographic Relevance | Impact Timeline |
|---|---|---|---|
| Rising popularity of ethnic cuisines | +1.2% | Global, with concentration in North America, Europe, and urban Asia-Pacific | Medium term (2-4 years) |
| Convenience food and ready meal expansion | +0.9% | Global, strongest in North America, Europe, and developed Asia-Pacific markets | Short term (≤ 2 years) |
| Rise in home cooking and DIY recipes has boosted household consumption of dried spices | +0.8% | Global, accelerated in North America and Europe post-pandemic | Short term (≤ 2 years) |
| Expansion of online/e-commerce channels | +1.1% | Global, led by Asia-Pacific (India, China) and Middle East | Medium term (2-4 years) |
| Increased usage in functional and medicinal foods | +1.0% | Global, with premium demand in North America, Europe, and affluent Asia-Pacific | Long term (≥ 4 years) |
| Innovative flavors and custom spice blends | +0.7% | Global, concentrated in food-service and retail private-label segments | Medium term (2-4 years) |
| Source: Mordor Intelligence | |||
Rising popularity of ethnic cuisines
The global dried spices market is primarily driven by the increasing demand for ethnic cuisines, which is transforming consumption patterns across the food service, packaged foods, and retail sectors. The USDA Economic Research Service reports that increasing racial and ethnic diversity in the United States is reshaping food preferences, particularly boosting demand for spices and seasonings. The growing influence of multicultural demographics and fusion dining trends is driving demand for authentic, region-specific spice blends. Additionally, halal certifications and adherence to authenticity standards are unlocking growth opportunities in emerging markets. Restaurants and the ready-to-eat segment are increasingly incorporating diverse spice profiles, while consumers are replicating these culinary experiences at home through private-label and customized blends. This trend is elevating spices from traditional flavoring agents to strategic components in the food industry, positioning them as cultural assets, lifestyle products, and critical inputs for innovation in both mainstream and premium food categories.
Convenience food and ready meal expansion
Urbanization and increasingly busy lifestyles are driving consumer demand for convenience foods and ready meals, which, in turn, is propelling the growth of the global dried spices market. Consumers are gravitating toward pre-seasoned, portion-controlled products that deliver authentic flavors with minimal preparation. Key industry players are incorporating spices into instant curries, snack seasonings, sauces, and ready-to-cook kits, while pursuing acquisitions to secure consistent input supplies for large-scale food production. E-commerce platforms are transforming market access by offering sachets, meal kits, and subscription boxes. Additionally, advancements in packaging technologies, such as modified-atmosphere systems and nitrogen flushing, are enhancing flavor preservation and extending product shelf life. These developments underscore the critical role of dried spices in driving innovation within the convenience food market, aligning with consumer expectations for both efficiency and quality.
Rise in home cooking and DIY recipes has boosted household consumption of dried spices
The global dried spices market is experiencing significant growth, driven by the sustained increase in home cooking and do-it-yourself (DIY) recipe trends post-pandemic. Consumers are increasingly opting for whole spices due to their longer shelf life, customizable grind sizes, and the added value of sensory engagement through toasting and grinding. Additionally, social media and recipe-sharing platforms are intensifying the demand for authenticity and transparency in spice sourcing. Rising concerns over contamination have further emphasized the importance of stringent quality testing and traceability. In response, retailers are expanding their portfolios with private-label organic products and certified origin offerings. These developments position dried spices as essential components in modern home kitchens, combining traditional appeal with convenience and reinforcing their role as both culinary necessities and lifestyle-driven products.
Expansion of online/e-commerce channels
Online and e-commerce channels are transforming the global dried spices market. Digital platforms are eliminating traditional distribution barriers, thereby increasing accessibility to specialty and imported varieties. Smaller brands and single-origin producers are now directly competing with established players, facilitated by direct-to-consumer (DTC) models. Additionally, re-export hubs and regional marketplaces are expanding their geographical reach. However, compliance challenges persist, particularly concerning certification and labeling requirements for halal-conscious buyers. In response, platforms are allocating resources to enhance metadata, implement Quick Response (QR) code traceability, and adopt third-party verification processes to build consumer trust. This evolution highlights e-commerce's role not only as a sales channel but also as a strategic driver of transparency, authenticity, and global integration within the dried spices market.
Restraint Impact Analysis*
| Restraint | (~) % Impact on CAGR Forecast | Geographic Relevance | Impact Timeline |
|---|---|---|---|
| Adulteration and counterfeit products | -0.8% | Global, acute in South Asia and emerging markets with weak enforcement | Medium term (2-4 years) |
| Price volatility and raw material fluctuation | -1.1% | Global, most severe in Asia-Pacific producing regions and import-dependent markets | Short term (≤ 2 years) |
| Supply chain disruptions | -0.9% | Global, concentrated in Gulf maritime routes and Asia-Pacific export corridors | Short term (≤ 2 years) |
| Quality and contamination issues | -0.7% | Global, with heightened scrutiny in North America, Europe, and developed Asia-Pacific | Medium term (2-4 years) |
| Source: Mordor Intelligence | |||
Adulteration and counterfeit products
Adulteration and counterfeit products pose significant challenges for the global dried spices market, eroding consumer trust and disrupting international trade. Product recalls due to contamination and unauthorized additives underscore the susceptibility of spices to dilution, synthetic colorants, and pesticide residues. Notably, turmeric has frequently been highlighted for compliance issues in export markets. Varying regulatory standards across regions complicate trade, with exporters grappling to meet stringent thresholds while staying competitive. In some markets, the lack of centralized certification frameworks raises alarms about cross-contamination and authenticity, drawing heightened scrutiny from both regulators and buyers. Consequently, the industry is under increasing pressure to bolster investments in rigorous testing, traceability, and transparent labeling, all in a bid to uphold integrity and ensure sustained growth.
Price volatility and raw material fluctuation
Producers, processors, and retailers in the global dried spices market face significant challenges due to price volatility and fluctuations in raw material costs. Key producing regions experience supply disruptions, and when combined with rising cultivation expenses and surging fertilizer prices, these factors compress profit margins and complicate procurement strategies. The inherent cyclical nature of perennial spice crops exacerbates these fluctuations, leading to pronounced boom-and-bust cycles that challenge the stability of long-term contracts and inventory management. Additionally, movements in foreign exchange rates, escalating regulatory compliance costs, and logistics bottlenecks further intensify this instability. As a result, companies are increasingly adopting hedging strategies and adaptable sourcing models. This overarching volatility disrupts the predictability of the value chain, making it a constant struggle for the industry to maintain consistent pricing and a reliable supply.
*Our forecasts treat driver/restraint impacts as directional, not additive. The impact forecasts reflect baseline growth, mix effects, and variable interactions.
Segment Analysis
By Product Type: Pepper Leads, Cinnamon Accelerates on Functional Demand
Pepper, commanding a 21.23% share in 2025, stands as the dominant force in the global dried spices market. Its ubiquitous presence in daily cooking, restaurant menus, and blended spice formats underscores its essential role, especially in retail and Hotel, Restaurant, and Catering (HoReCa) segments. Yet, the spice grapples with supply-side challenges and price fluctuations, testing its availability and profit margins. Nevertheless, pepper's versatility and deep-rooted consumer familiarity fortify its leadership position, bridging the gap between traditional cuisines and contemporary dining. This resilience not only cements pepper's status as the cornerstone of the dried spices market but also underscores its influence on shaping culinary standards and consumer preferences.
In contrast, cinnamon is emerging as the market's fastest-growing category, with projections indicating a robust CAGR of 6.78% through 2031. This surge is attributed to cinnamon's unique dual role as both a flavor enhancer and a functional ingredient. Its escalating incorporation in premium bakery items and health-centric recipes highlights a growing consumer focus on benefits like blood-sugar management. In the retail space, cinnamon is carving a niche with organic and traceable product lines. Meanwhile, Hotel, Restaurant, and Catering (HoReCa) establishments are creatively weaving it into menus, striking a balance between indulgence and health. This trajectory not only positions cinnamon as a pivotal growth catalyst but also crafts a compelling narrative of health, authenticity, and premiumization, complementing pepper's longstanding dominance. Together, the journeys of pepper and cinnamon paint a picture of a market in flux—rooted in tradition yet propelled by modern, health-conscious demands.


By Form: Ground Dominates, Whole Gains on Authenticity and Shelf Life
Pepper, commanding a 21.23% share in 2025, stands as the dominant force in the global dried spices market. Its ubiquitous presence in daily cooking, restaurant menus, and blended spice formats underscores its essential role, especially in retail and HoReCa segments. Yet, the spice grapples with supply-side challenges and price fluctuations, testing its availability and profit margins. Nevertheless, pepper's versatility and deep-rooted consumer familiarity fortify its leadership position, bridging the gap between traditional cuisines and contemporary dining. This resilience not only cements pepper's status as the cornerstone of the dried spices market but also underscores its influence on shaping culinary standards and consumer preferences.
In contrast, cinnamon is emerging as the market's fastest-growing category, with projections indicating a robust CAGR of 6.78% through 2031. This surge is attributed to cinnamon's unique dual role as both a flavor enhancer and a functional ingredient. Its escalating incorporation in premium bakery items and health-centric recipes highlights a growing consumer focus on benefits like blood-sugar management. In the retail space, cinnamon is carving a niche with organic and traceable product lines. Meanwhile, Hotel, Restaurant, and Catering establishments are creatively weaving it into menus, striking a balance between indulgence and health. This trajectory not only positions cinnamon as a pivotal growth catalyst but also crafts a compelling narrative of health, authenticity, and premiumization, complementing pepper's longstanding dominance. Together, the journeys of pepper and cinnamon paint a picture of a market in flux, rooted in tradition yet propelled by modern, health-conscious demands.
By Nature: Conventional Scale Versus Organic Premium
In 2025, conventional spices commanded a dominant 87.33% market share, bolstered by cost advantages, established supply chains, and widespread availability. India plays a significant role in this segment, with its conventional spice production reaching 12 million metric tonnes in fiscal 2024, a notable increase from 11.14 million tonnes in fiscal 2023. Key states such as Karnataka, Kerala, and Tamil Nadu contribute significantly to this output[1]Source: India Brand Equity Foundation, "Spices Industry and Export in India", ibef.org. Their familiarity and accessibility have made them the go-to choice for households and food-service operators alike, ensuring steady demand even as interest in certified alternatives grows. Anchored by robust distribution networks, conventional formats remain the market's cornerstone, with consumers leaning on trusted and readily available products.
On the other hand, organic spices are emerging as the market's fastest-growing segment, with projections indicating a robust compound annual growth rate (CAGR) of 7.95% through 2031. This surge is driven by consumers' readiness to pay a premium for certified products, bolstered by regulatory backing for organic farming and retailers' push for unique private-label offerings. According to the Organic Trade Association, US organic sales grew by 7% in 2025, with organic produce, including spices[2]Source: Organic Trade Association, "Growth of U.S. Organic Marketplace Accelerated in 2024", ota.com. This highlights the strong momentum in premium market segments. Trends on social media and a growing wellness movement have heightened the focus on authenticity and traceability. Furthermore, certification programs in India and the European Union (EU) are aligning standards, streamlining cross-border trade. While challenges like quality risks, certification expenses, and compliance issues persist, organic spices are establishing a premium foothold, narrating a compelling story of health, sustainability, and authenticity, all while complementing the established dominance of conventional formats.
By Distribution Channel: Retail Stability Meets HoReCa Recovery
In 2025, retail channels are set to dominate the global dried spices market, commanding a substantial 71.65% share. Supermarkets, hypermarkets, and specialty stores bolster this lead, providing shelf-ready displays, heightened brand visibility, and enticing impulse-buy moments. Convenience stores amplify retail's strength, emphasizing high-turnover ground spices in compact sizes. Meanwhile, specialty outlets serve ethnic communities and culinary aficionados in search of rare or single-origin spices. E-commerce is revolutionizing retail dynamics, facilitating direct-to-consumer sales, broadening access to premium and certified products, and empowering smaller brands to rival industry giants, solidifying retail's status as the primary consumer interface. According to the India Brand Equity Foundation, India's e-commerce sector is evolving rapidly, with a CAGR of 27% to reach US$ 163 billion by 2026[3]Source: India Brand Equity Foundation, "E-commerce Industry in India", ibef.org.
The HoReCa sector is on a rapid ascent, with projections indicating a CAGR of 8.58% through 2031. This surge is driven by an uptick in restaurants, a growing appetite for custom spice blends, and the rise of cloud kitchens and delivery-only models. Chefs and operators are gravitating towards whole spices and unique blends, aiming to set their menus apart and offer genuine dining experiences. Notably, regions like the Middle East are displaying a pronounced enthusiasm for varied spice profiles. This segment's swift growth underscores its pivotal role, not only complementing retail's supremacy but also spotlighting trends like customization, authenticity, and elevated culinary experiences.
Geography Analysis
In 2025, the Asia-Pacific is set to dominate the global dried spices market, capturing 38.97% of the revenue. India leads this charge, boasting a stronghold on turmeric and other spice exports. Meanwhile, China's burgeoning middle class is increasingly seeking out premium and imported spice varieties. In Vietnam, a downturn in black pepper production has altered the supply landscape, leading to a surge in imports to satisfy local demand. Indonesia, on the other hand, grapples with heightened quality standards in global markets. Both Japan and South Korea are gravitating towards the premium segment, showing a marked interest in organic, single-origin, and high-curcumin spices. Collectively, these varied dynamics cement Asia-Pacific's status as the foremost hub for both bulk and specialty spices.
Projected to grow at a CAGR of 9.01% through 2031, the Middle East and Africa are emerging as the fastest-growing regions in the dried spices market. This growth is largely driven by halal certification mandates, a burgeoning food-service sector, and a rising Muslim demographic that emphasizes authenticity in spice usage. The United Arab Emirates (UAE) stands out with its robust import appetite and a swiftly growing HoReCa industry. Simultaneously, markets in West Africa, particularly Ghana and Côte d’Ivoire, are recognizing the value of halal-certified spices in daily cooking. To bolster consumer confidence, regional trade exhibitions and certification programs are playing a pivotal role, underscoring the Middle East and Africa's status as a burgeoning powerhouse in the global dried spices arena.
While North America and Europe may not lead in size or growth rate, they are pivotal players in the global dried spices landscape. The United States (U.S.) stands out as a major player, particularly in turmeric imports. Concurrently, Europe is tightening its grip on sourcing strategies by imposing stricter residue limits. South America, with Brazil at the helm, plays a dual role as both a producer and consumer, notably exporting black pepper and other spices. These regions, though not the largest or the fastest-growing, are instrumental in harmonizing global demand and supply, ensuring the dried spices market's resilience and interconnectedness across continents.

Competitive Landscape
The global dried spices market is characterized by moderate fragmentation, with key players focusing on consolidation and strategic alliances to enhance their competitive positioning. Multinational corporations such as McCormick are driving growth through acquisitions and geographic diversification, leveraging economies of scale to mitigate market volatility and expand their presence across retail and HoReCa channels. Regional leaders like MDH, Everest, and Eastern Condiments maintain a stronghold in South Asia, supported by established brand equity and extensive distribution networks. However, these companies are increasingly facing scrutiny regarding quality standards and regulatory compliance. To address shifting consumer preferences for healthier and natural products, market participants are introducing innovative spice-based flavor solutions.
Significant growth opportunities exist in premium segments, including high-curcumin turmeric, organic certifications, and halal-compliant supply chains. India's constrained supply of high-curcumin turmeric relative to global demand presents an opportunity for farmer groups and exporters to invest in varietal improvements and certification programs. Similarly, the absence of standardized halal frameworks in parts of Africa creates a market for suppliers offering internationally recognized certifications. As consumer demand for authenticity and sustainability grows, organic spices are gaining traction. Market leaders are differentiating themselves through the adoption of advanced technologies and strategic acquisitions, enabling them to deliver consistent, high-quality spice products tailored to evolving retail and HoReCa requirements.
The e-commerce sector is transforming the competitive dynamics of the market by enabling direct-to-consumer models that bypass traditional wholesale markups. This shift allows smaller brands and single-origin producers to compete effectively with established players. Online platforms are democratizing access to specialty and certified spices, while subscription-based models and traceability features are fostering consumer trust. This digital transformation, combined with consolidation among global leaders and the expansion of niche-certified categories, is creating a dynamic and competitive market environment where scale, authenticity, and innovation are critical to sustaining leadership.
Dried Spices Industry Leaders
-
McCormick & Company Inc.
-
Olam International (ofi)
-
Kerry Group plc
-
Ajinomoto Co. Inc.
-
Fuchs Gruppe
- *Disclaimer: Major Players sorted in no particular order


Recent Industry Developments
- June 2025: Asheville-based Spicewalla launched a limited-edition "Made with Love in Asheville Collection," featuring a 10-pack of premium spice blends. This collection showcases unique mixes developed in collaboration with prominent local chefs and businesses, including Katie Button of Cúrate, Hickory Nut Gap Farms, and the iconic Biltmore Estate.
- January 2025: McCormick announced Aji Amarillo Seasoning as its 2025 "Flavor of the Year," reflecting the increasing consumer demand for bold and globally inspired ingredients. The company states that the seasoning combines dried Aji Amarillo with garlic, onion, tomato, and mango powders, along with a proprietary blend of spices, delivering a sweet, tropical flavor profile with medium heat and subtle smokiness.
- November 2024: Afia, an Eastern Mediterranean food company headquartered in Austin, Texas, introduced a new product line of Mediterranean spices. These products are available in two premium gift sets: the Mediterranean Spice Blends Gift Set, which includes Za’atar, Shawarma, and Baharat 7 Spice, and the Mediterranean Pantry Spice Gift Set, featuring individual spices such as Sumac, Dried Mint, and Aleppo Pepper.


Global Dried Spices Market Report Scope
Dried spices are plant-derived seasonings that have been harvested and dehydrated to preserve their flavor, aroma, and shelf life. They are used across cuisines to enhance taste and fragrance, offering convenience, longer storage stability, and consistent quality compared to fresh spices.
The dried spices market is segmented based on product type, form, nature, distribution channel, and geography. Based on product type, the market is segmented into pepper, chilli, turmeric, cumin, coriander, cinnamon, clove, nutmeg, mace, and others. Based on form, the market is segmented into whole, crushed/ground/powdered. Based on nature, the market is segmented into conventional and organic. Based on distribution channel, the market is segmented into Foodservice/HoReCa and retail. Based on geography, the market is segmented into North America, Europe, Asia-Pacific, South America, and the Middle East and Africa.
| Pepper |
| Chili |
| Turmeric |
| Cumin |
| Coriander |
| Cinnamon |
| Other Spices (Cardamom, Clove, Nutmeg and Mace) |
| Whole |
| Crushed/Ground/Powdered |
| Conventional |
| Organic |
| Foodservice/HoReCa | |
| Retail | Supermarkets/Hypermarkets |
| Specialty/Gourmet Stores | |
| Online Retail Stores | |
| Other Distribution Channels |
| North America | United States |
| Canada | |
| Mexico | |
| Rest of North America | |
| Europe | Germany |
| United Kingdom | |
| Italy | |
| France | |
| Spain | |
| Netherlands | |
| Poland | |
| Belgium | |
| Sweden | |
| Rest of Europe | |
| Asia-Pacific | China |
| India | |
| Japan | |
| Australia | |
| Indonesia | |
| South Korea | |
| Thailand | |
| Singapore | |
| Rest of Asia-Pacific | |
| South America | Brazil |
| Argentina | |
| Colombia | |
| Chile | |
| Peru | |
| Rest of South America | |
| Middle East and Africa | South Africa |
| Saudi Arabia | |
| United Arab Emirates | |
| Nigeria | |
| Egypt | |
| Morocco | |
| Turkey | |
| Rest of Middle East and Africa |
| By Product Type | Pepper | |
| Chili | ||
| Turmeric | ||
| Cumin | ||
| Coriander | ||
| Cinnamon | ||
| Other Spices (Cardamom, Clove, Nutmeg and Mace) | ||
| By Form | Whole | |
| Crushed/Ground/Powdered | ||
| By Nature | Conventional | |
| Organic | ||
| By Distribution Channel | Foodservice/HoReCa | |
| Retail | Supermarkets/Hypermarkets | |
| Specialty/Gourmet Stores | ||
| Online Retail Stores | ||
| Other Distribution Channels | ||
| By Geography | North America | United States |
| Canada | ||
| Mexico | ||
| Rest of North America | ||
| Europe | Germany | |
| United Kingdom | ||
| Italy | ||
| France | ||
| Spain | ||
| Netherlands | ||
| Poland | ||
| Belgium | ||
| Sweden | ||
| Rest of Europe | ||
| Asia-Pacific | China | |
| India | ||
| Japan | ||
| Australia | ||
| Indonesia | ||
| South Korea | ||
| Thailand | ||
| Singapore | ||
| Rest of Asia-Pacific | ||
| South America | Brazil | |
| Argentina | ||
| Colombia | ||
| Chile | ||
| Peru | ||
| Rest of South America | ||
| Middle East and Africa | South Africa | |
| Saudi Arabia | ||
| United Arab Emirates | ||
| Nigeria | ||
| Egypt | ||
| Morocco | ||
| Turkey | ||
| Rest of Middle East and Africa | ||


Key Questions Answered in the Report
What is the current value of the dried spices market and its forecast for 2031?
The dried spices market size equals USD 16.23 billion in 2025 and is forecast to reach USD 23.23 billion by 2031, representing a 6.16% CAGR.
Which spice category holds the largest revenue share?
Pepper leads with 21.23% of 2024 revenue, underlining its universal culinary relevance.
Which spice is growing fastest through 2031?
Cinnamon posts the quickest pace at a 6.78% CAGR, buoyed by its functional-food appeal and documented health attributes.
Which region is expanding most rapidly?
The Middle East and Africa shows the highest regional CAGR at 9.01% for 2026-2031, supported by rising consumer sophistication.
Page last updated on:


