Dried Soup Market Size and Share
Market Overview
| Study Period | 2021 - 2031 |
|---|---|
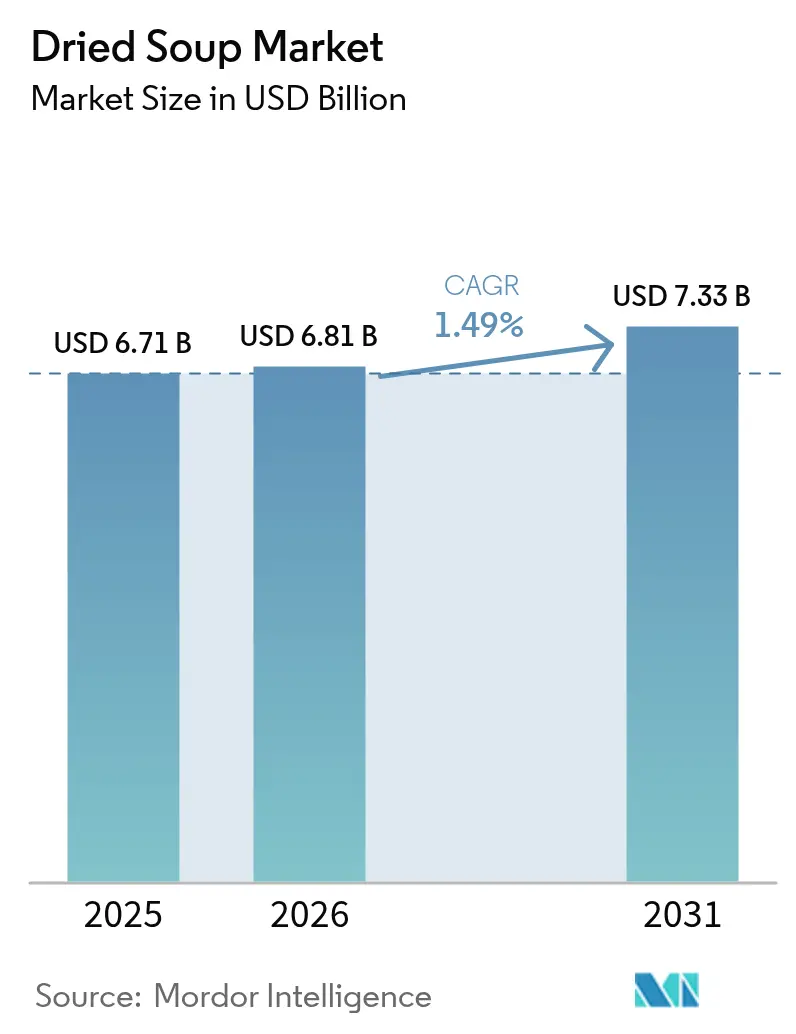
| Market Size (2026) | USD 6.81 Billion |
| Market Size (2031) | USD 7.33 Billion |
| Growth Rate (2026 - 2031) | 1.49% CAGR |
| Fastest Growing Market | Asia Pacific |
| Largest Market | Asia Pacific |
| Market Concentration | Medium |
Major Players
*Disclaimer: Major Players sorted in no particular order Image © Mordor Intelligence. Reuse requires attribution under CC BY 4.0. |
|
Dried Soup Market Analysis by Mordor Intelligence
The dried soup market size is expected to grow from USD 6.71 billion in 2025 to USD 6.81 billion in 2026 and is forecast to reach USD 7.33 billion by 2031 at 1.49% CAGR over 2026-2031. This muted growth pattern signals a mature category in which legacy brands contend with consumers who now scrutinize price, nutrition, and ingredient transparency as strongly as they once prioritized convenience. Authenticity narratives, plant-forward formulations, and digital-first retail experiences are recasting the value of categories, forcing incumbents to justify their shelf space through differentiated propositions. In parallel, urbanization drives higher demand for portable meals. However, increased consumer interest in cooking and improved availability of fresh food have reduced the consumption of packaged food products. The market competition has shifted beyond traditional concentration metrics, as niche companies build customer retention through targeted brand positioning and direct-to-consumer distribution models.
Key Report Takeaways
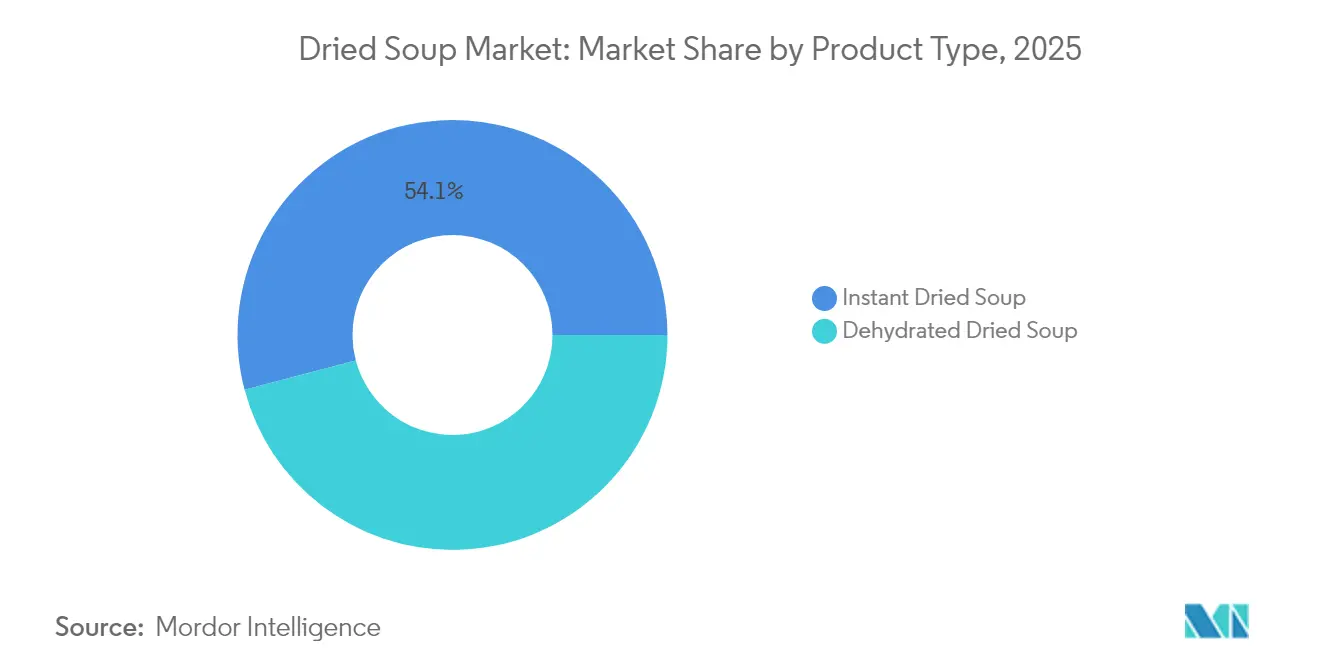
- By product type, instant variants held 54.10% of the dried soup market share in 2025 and are projected to expand at a 1.78% CAGR between 2026-2031.
- By category, vegetarian formulations accounted for 51.30% of the dried soup market size in 2025 and are poised for a 1.96% CAGR growth through 2031.
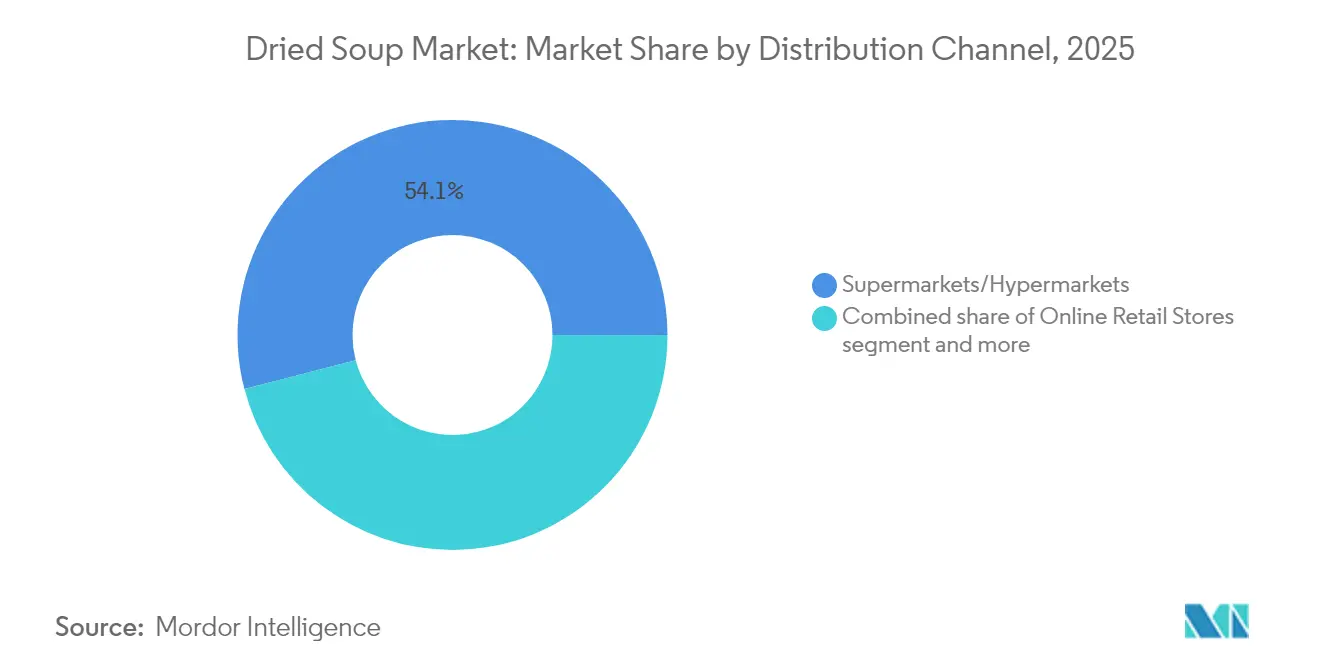
- By distribution channel, supermarkets/hypermarkets commanded 54.05% revenue in 2025, while online retail is set to record the fastest 2.55% CAGR to 2031.
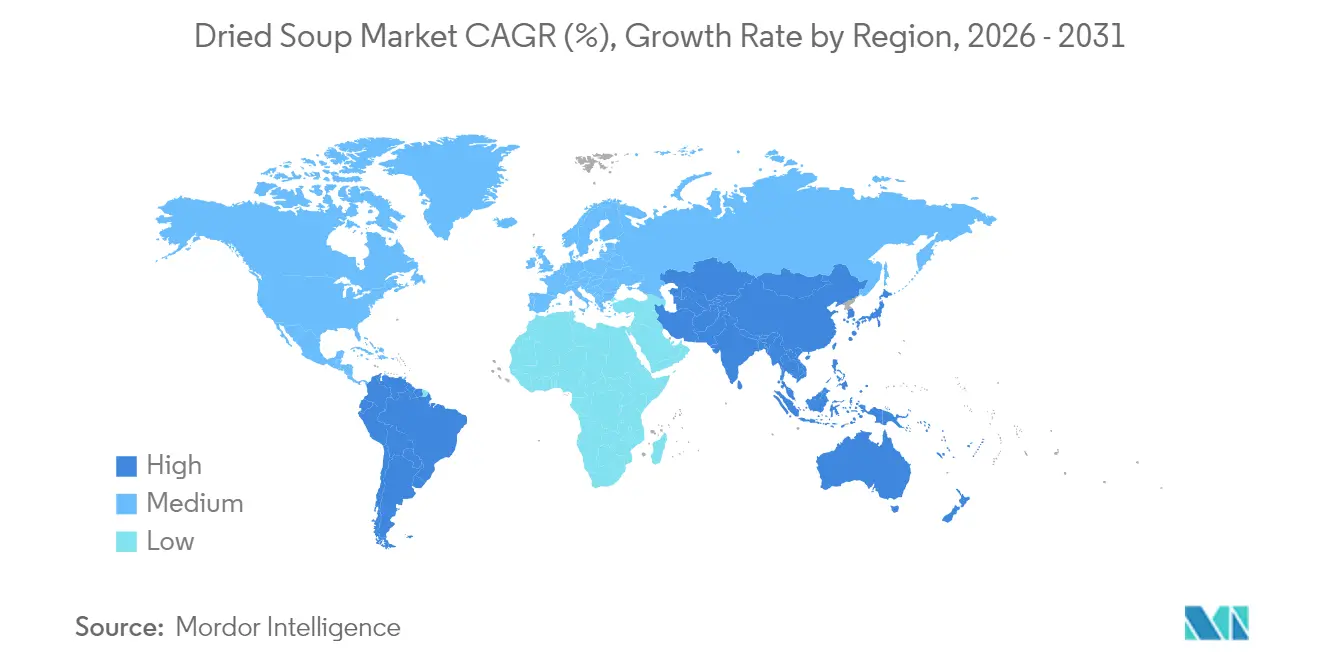
- By geography, Asia-Pacific captured 33.20% of global revenue in 2025 and is forecast to lead with a 2.82% CAGR over the next five years.
Note: Market size and forecast figures in this report are generated using Mordor Intelligence’s proprietary estimation framework, updated with the latest available data and insights as of 2026.
Global Dried Soup Market Trends and Insights
Drivers Impact Analysis*
| Driver | (~) % Impact on CAGR Forecasts | Geographic Relevance | Impact Timeline |
|---|---|---|---|
| Rising popularity of vegan and plant-based soups | +0.5% | Global, with Asia-Pacific and North America leading | Medium term (2-4 years) |
| Premiumization and gourmet soups | +0.3% | North America and Europe, expanding to Asia-Pacific | Long term (≥ 4 years) |
| Sustainable and eco-friendly packaging | +0.4% | Europe leading, Global adoption | Medium term (2-4 years) |
| Long shelf life and portability | +0.2% | Global, particularly emerging markets | Short term (≤ 2 years) |
| Influence of social media and influencers | +0.1% | Global, strongest in Asia-Pacific and North America | Short term (≤ 2 years) |
| Demand for quick and easy meal solutions | +0.2% | Global, urban centers priority | Short term (≤ 2 years) |
| Source: Mordor Intelligence | |||
Rising popularity of vegan and plant-based soups
Plant-based formulations are expanding the market as manufacturers develop alternatives that meet consumer demand for ethical and health-conscious products. According to the International Food Information Council data from 2024, 3% of the United States population consumed plant-based food exclusively, while 55% incorporated it for health benefits [1]Source: International Food and Information Council, "2024 IFIC Food & Health Survey", foodinsight.org. The trend has evolved beyond simple ingredient substitution to transform the entire value chain, establishing plant-based soups as premium products. The combination of health, environmental, and ethical factors drives demand growth across various demographic segments. Manufacturers are expanding their product portfolios to include innovative plant-based ingredients, diverse flavor profiles, and enhanced nutritional content to capture a broader consumer base. This expansion strategy encompasses new product development, improved distribution channels, and targeted marketing campaigns to increase market penetration.
Premiumization and gourmet soups
Premium positioning enables manufacturers to maintain profitability through differentiated offerings that command higher prices, helping offset commodity price volatility and margin pressure. This strategy is particularly effective in developed markets where consumers increasingly view food as a lifestyle choice rather than basic sustenance. Products featuring gourmet ingredients, organic certifications, and specialized recipes create meaningful differentiation from private label competitors. The incorporation of premium ingredients and innovative formulations allows manufacturers to establish unique value propositions that resonate with quality-conscious consumers. Manufacturers are investing in research and development to create sophisticated product variants that justify premium pricing. As commodity inflation continues to affect standard product margins, manufacturers are strategically shifting their portfolios toward premium offerings to preserve and enhance profitability in competitive market conditions. This transition requires careful market analysis, consumer insight integration, and strategic pricing decisions to ensure the successful implementation of premium positioning strategies.
Sustainable and eco-friendly packaging
Packaging innovation drives competitive differentiation as regulatory pressure and consumer awareness converge to demand environmental responsibility throughout the value chain. Sysco's packaging innovation contest in 2024 highlighted biodegradable solutions, including Cargill's beef packaging, Superior Foods' bio bags, and PA x PulPac's dry molded fiber containers, demonstrating industry-wide commitment to sustainable materials. The foodservice sector's embrace of sustainable packaging creates downstream pressure on consumer packaged goods manufacturers to adopt similar materials to maintain supply chain compatibility. European markets lead adoption due to stringent regulatory frameworks, but global implementation accelerates as cost differentials narrow and consumer preferences shift toward environmentally responsible brands. Sustainable packaging initiatives extend beyond material substitution to encompass entire lifecycle assessments that optimize transportation efficiency and end-of-life disposal options. The integration of sustainability metrics into corporate reporting frameworks creates accountability mechanisms that drive continuous improvement in packaging environmental performance.
Long shelf life and portability
The long-term storage capability of dried soups establishes them as fundamental inventory items, ensuring food availability and operational efficiency during supply chain interruptions. Technological advances in dehydration and preservation extend product viability while maintaining flavor integrity, enabling manufacturers to reduce food waste throughout the distribution chain. Portability features particularly resonate with urban consumers who prioritize convenience and space efficiency in compact living environments where storage optimization becomes critical. The combination of extended shelf life and compact packaging creates value propositions that appeal to emergency preparedness markets, outdoor recreation segments, and international shipping applications where traditional fresh alternatives prove impractical. Supply chain resilience considerations following recent global disruptions reinforce consumer preference for products that provide meal security without compromising nutritional quality.
Restraints Impact Analysis*
| Restraint | (~) % Impact on CAGR Forecasts | Geographic Relevance | Impact Timeline |
|---|---|---|---|
| Consumer preference for fresh and homemade alternatives | -0.3% | Global, strongest in developed markets | Long term (≥ 4 years) |
| Negative perceptions regarding healthiness | -0.2% | North America and Europe primarily | Medium term (2-4 years) |
| Production efficiency challenges | -0.2% | Global, acute in emerging markets | Medium term (2-4 years) |
| Supply chain disruptions | -0.1% | Global, with regional concentration risks | Short term (≤ 2 years) |
| Source: Mordor Intelligence | |||
Consumer preference for fresh and homemade alternatives
Health consciousness and culinary engagement drive consumer migration toward fresh ingredients and home preparation methods that provide greater control over nutritional content and flavor customization. Pandemic-induced cooking skill development created lasting behavioral changes as consumers discovered satisfaction in meal preparation and ingredient sourcing that extends beyond convenience considerations. Social media platforms amplify fresh cooking trends through recipe sharing and cooking demonstrations that position homemade alternatives as achievable and desirable lifestyle choices. The availability of fresh ingredients through improved supply chains and online grocery delivery reduces barriers to home cooking that previously favored processed alternatives. Economic considerations increasingly favor fresh ingredients as commodity price inflation affects packaged goods more severely than basic agricultural products, creating cost advantages for home preparation.
Negative perceptions regarding healthiness
Consumers increasingly view processed foods negatively due to their artificial additives, high sodium levels, and limited nutritional value, which contradict current health and wellness preferences. The perception of processed foods as unhealthy has led to a shift in consumer behavior, with many actively seeking alternatives that align with their wellness goals. Manufacturers face heightened regulatory oversight, requiring product reformulations to reduce sodium, artificial preservatives, and flavor enhancers. These regulatory changes aim to address public health concerns and align with evolving consumer preferences for healthier options. The clean label movement's demand for ingredient transparency and simpler formulations challenges traditional dried soup production methods, forcing manufacturers to reconsider their production processes and ingredient sourcing. The need to reformulate products and adjust marketing strategies to address health concerns requires significant investment in research, development, and new manufacturing processes. However, price sensitivity in these categories may limit potential returns, creating a challenging balance between meeting consumer demands and maintaining profitability.
*Our forecasts treat driver/restraint impacts as directional, not additive. The impact forecasts reflect baseline growth, mix effects, and variable interactions.
Segment Analysis
By Product Type: Instant Variants Lead Through Convenience Innovation
Instant dried soup holds a 54.10% market share in 2025 and is projected to grow at a 1.78% CAGR through 2031. This growth stems from improved flavor preservation technology and simplified preparation methods that attract time-pressed consumers. The instant segment's market leadership reflects consumers' preference for convenience over traditional cooking, especially in urban areas where limited kitchen space and time favor quick meal solutions. Dehydrated dried soup variants make up the remaining market share, positioning themselves as premium options with enhanced flavor profiles and visible ingredients for consumers who can dedicate more time to preparation.
Improved manufacturing processes in instant soup production reduce costs while maintaining profit margins across distribution channels. The segment's growth aligns with increasing global urbanization, which drives consistent demand for convenient meal options among working professionals and single-person households. Product development in the instant segment now emphasizes organic certification, plant-based options, and unique flavors to distinguish products from standard offerings and support premium pricing. For instance, in October 2023, the Atlante company launched a range of instant legume cup soups, available in different flavors such as curry, picante, and Mediterranean. The products are vegan-friendly and rich in protein.


By Category: Plant-Based Momentum Drives Vegetarian Leadership
Vegetarian soup formulations command 51.30% market share in 2025 and project the fastest growth at 1.96% CAGR through 2031, reflecting global dietary shifts that extend beyond ethical considerations to encompass health and environmental sustainability priorities. According to the Food Frontier 2024 survey on dietary behaviors in Australia, health improvement emerged as the dominant driver, with 60% of vegetarian diet participants selecting health benefits as their primary motivation. Environmental factors influenced 33% of respondents, while ethical considerations drove 26% of participants . The category's leadership position demonstrates successful manufacturer adaptation to changing consumer preferences through expanded plant-based protein options and enhanced flavor profiles that satisfy both vegetarian and flexitarian consumers. Non-vegetarian variants maintain a significant market presence through premium positioning and protein-forward formulations that appeal to fitness-conscious demographics seeking convenient post-workout nutrition solutions.
The vegetarian soup segment demonstrates lower input costs as plant-based proteins exhibit reduced price fluctuations compared to animal proteins, maintaining profit margins during commodity price increases. Research and development in vegetarian soups incorporates functional components, including probiotics, superfoods, and adaptogens, establishing these products as health and wellness offerings rather than convenience items. Plant-based formulation manufacturing enables operational efficiency through consistent raw material procurement and uniform production methods across multiple geographic regions.
By Distribution Channel: Digital Migration Accelerates Despite Traditional Dominance
Online retail stores emerge as the fastest-growing distribution channel at 2.55% CAGR through 2031, despite supermarkets and hypermarkets maintaining 54.05% market share in 2025, reflecting pandemic-accelerated digital adoption that creates new competitive dynamics in food retail. South Korea's food e-commerce growth of 12% year-over-year in 2023, accounting for 30% of total e-commerce sales, demonstrates the channel's expansion potential in developed markets with robust digital infrastructure, according to USDA data from 2023.
The digital channel's growth benefits smaller brands that lack extensive physical retail footprints but excel in direct-to-consumer engagement and targeted marketing strategies. Convenience and grocery stores capture a moderate market share through location advantages and impulse purchasing opportunities that favor grab-and-go consumption occasions. Traditional retail channels face margin pressure from online competitors while adapting to changing consumer shopping patterns that prioritize convenience and product variety over physical store experiences.
Geography Analysis
Asia-Pacific's 33.20% market share in 2025, combined with 2.82% CAGR growth through 2031, positions the region as the primary driver of dried soup market expansion, fueled by rapid urbanization and evolving dietary preferences that favor convenience without abandoning traditional flavor profiles. The region's demographic transition toward dual-income households and extended commuting times creates sustained demand for quick meal solutions that maintain nutritional value and cultural authenticity. According to data from the Ministry of Internal Affairs and Communications for 2024, there were 13 million dual-income households in Japan . Rising health consciousness across the region increasingly favors products with clean labels and functional ingredients that align with traditional wellness philosophies while providing modern convenience benefits.
North American and European markets demonstrate mature consumption patterns with moderate growth rates that reflect established market penetration and increasing competition from fresh alternatives and insurgent brands challenging traditional players. European markets lead sustainability initiatives through regulatory frameworks that drive packaging innovation and ingredient sourcing transparency, creating competitive advantages for brands that successfully integrate environmental responsibility into value propositions. The region's focus on premium positioning and artisanal quality enables margin expansion despite volume pressures from health-conscious consumers migrating toward fresh preparation methods.
Emerging markets in South America, the Middle East, and Africa present significant growth opportunities driven by urbanization, rising disposable income, and infrastructure development that support modern retail distribution channels. These regions benefit from lower market penetration rates that create expansion potential for both international brands and local manufacturers who understand cultural preferences and price sensitivity requirements. Economic development patterns in these markets favor convenience products as lifestyle changes reduce available cooking time while increasing exposure to global food trends through digital media and international travel. Supply chain development and local manufacturing capabilities become critical success factors for capturing growth in emerging markets, where import costs and currency volatility can significantly impact product accessibility and pricing competitiveness.

Competitive Landscape
The dried soup market demonstrates moderate consolidation, with major companies including Campbell's, Unilever, and Nestlé commanding substantial market share through their established brands, extensive distribution networks, and product innovation capabilities. However, recent consumer behavior shifts reveal a growing preference for smaller, authentic brands that challenge traditional market leaders through direct-to-consumer strategies and premium positioning that resonates with health-conscious demographics.
The competitive landscape increasingly favors companies that integrate sustainability initiatives, digital marketing capabilities, and product innovation to differentiate offerings in an increasingly commoditized category. Strategic patterns across the industry focus on premiumization, sustainability integration, and digital transformation as manufacturers respond to changing consumer expectations and margin pressures from commodity inflation.
Merger and acquisition activity remains elevated as companies seek to acquire capabilities in plant-based formulations, sustainable packaging, and direct-to-consumer distribution channels that enhance competitive positioning. White-space opportunities emerge in functional food segments, ethnic flavor profiles, and premium organic formulations, where consumer willingness to pay higher prices creates margin expansion potential for innovative brands that execute differentiation strategies.
Dried Soup Industry Leaders
-
Campbell Soup Company
-
Nestlé S.A.
-
Unilever Plc
-
Ajinomoto Co. Ltd.
-
The Kraft Heinz Company
- *Disclaimer: Major Players sorted in no particular order

Recent Industry Developments
- February 2025: eHerbal had launched freeze-dried instant nutrient-rich soups. The company's freeze-dried sour soup contained tomatoes, okra, bean sprouts, and aromatic herbs. The product line included varieties such as spinach, sour, vegetarian mushroom, and other flavors.
- January 2025: Progresso expanded its product portfolio through the introduction of chicken noodle soup drops, which established the company's presence in a new product format and provided consumers with an alternative method to consume traditional soup flavors.
- November 2024: Nooish brand launched Matzo Ball Soup, which consisted of chicken soup with dumplings manufactured from matzah meal (crushed unleavened bread), eggs, chicken fat, and broth.
- February 2024: Hikari Miso Co., Ltd. launched "Mainichi Miso Soup Mild Sodium Freeze-dried Miso," an instant miso soup that preserved the authentic taste and texture of ingredients through freeze-drying technology. The product combined traditional Japanese flavors with convenience while maintaining the quality and nutritional value of fresh miso soup.


Research Methodology Framework and Report Scope
Market Definitions and Key Coverage
Our study defines the dried soup market as all finished, shelf-stable soup mixes that require the addition of water (or a similar liquid) before consumption, including instant cup formats and traditional dehydrated pouches. Sales are captured at the manufacturer ex-factory level and expressed in constant 2024 US dollars for clear year-on-year tracking.
Scope exclusion: The sizing purposely leaves out canned, chilled, frozen, retortable noodle bowls and wider ready-meal kits, which keeps the focus tight on true dried soup formulations only.
Segmentation Overview
-
By Product Type
- Instant Dried Soup
- Dehydrated Dried Soup
-
By Category
- Vegetarian Soup
- Non-Vegetarian Soup
-
By Distribution Channel
- Supermarkets/Hypermarkets
- Convenience/Grocery Stores
- Online Retail Stores
- Other Distribution Channels
-
By Geography
-
North America
- United States
- Canada
- Mexico
- Rest of North America
-
Europe
- Germany
- United Kingdom
- Italy
- France
- Spain
- Netherlands
- Poland
- Belgium
- Sweden
- Rest of Europe
-
Asia-Pacific
- China
- India
- Japan
- Australia
- Indonesia
- South Korea
- Thailand
- Singapore
- Rest of Asia-Pacific
-
South America
- Brazil
- Argentina
- Colombia
- Chile
- Peru
- Rest of South America
-
Middle East and Africa
- South Africa
- Saudi Arabia
- United Arab Emirates
- Nigeria
- Egypt
- Morocco
- Turkey
- Rest of Middle East and Africa
-
North America
Detailed Research Methodology and Data Validation
Primary Research
Mordor analysts conduct structured calls with ingredient suppliers, private-label packers, and category managers across North America, Europe, and key Asia-Pacific countries. These conversations validate desk assumptions on ingredient cost pass-through, average selling prices, and channel mix shifts, while short consumer surveys help us refine penetration ratios for instant versus dehydrated variants.
Desk Research
We begin by mining public, high-credibility datasets such as FAO Food Balance Sheets, UN Comtrade trade codes 210410 and 210420, USDA Foreign Agricultural Service import alerts, the European Soup Association's annual production survey, and health-linked consumption statistics from the WHO Global Dietary Database. Company 10-Ks, investor decks, and customs shipment tallies provide brand-level clues on volume shifts. To cross-check competitive moves and pricing, analysts tap Mordor's paid access to D&B Hoovers, Dow Jones Factiva, and Volza import records.
Regulatory updates on sodium targets, packaging mandates, and tariff revisions are tracked through the FDA, EFSA, and WTO notification portals, which help us understand upcoming demand pivots. The secondary source list is illustrative, not exhaustive; many other references were reviewed for triangulation and clarification.
Market-Sizing & Forecasting
The 2024 base year value is first derived top-down from global production plus net trade flows, then corroborated with selective bottom-up roll-ups of leading brand shipments and sampled ASP times volume checks. Input variables that shape the model include: • Per-capita dried soup servings gleaned from household panel data • Average retail price elasticity observed during inflation spikes • Share of grocery e-commerce in packaged foods sales • Regulatory sodium-reduction timelines influencing reformulation costs • Starch and vegetable powder commodity indices that guide margin outlooks. A multivariate regression with ARIMA overlays projects demand to 2030; scenario analysis adjusts for extreme weather-led crop volatility. Small data gaps in bottom-up tallies are filled by weighted interpolation from verified country proxies before results are locked.
Data Validation & Update Cycle
Outputs run through deviation checks against NielsenIQ retail audits and FAO yield trends. Senior reviewers question any variance above 5 percent, and models are refreshed every twelve months or sooner if material recalls, M&A, or tariff shocks occur. A final analyst pass ensures the client always receives our latest validated view.
Why Our Dried Soup Baseline Commands Reliability
Published numbers vary because firms pick different product mixes, price points, and refresh cadences.
Key gap drivers include the inclusion of noodle bowls by some publishers, unadjusted retail mark-ups, and differing currency bases.
Mordor's disciplined scope, annual refresh, and dual-track modeling keep our figure defensible for strategic planning.
Benchmark comparison
| Market Size | Anonymized source | Primary gap driver |
|---|---|---|
| USD 6.71 B (2025) | Mordor Intelligence | - |
| USD 12.90 B (2024) | Global Consultancy A | Widest scope covers cup noodles and dehydrated meal kits; relies on company revenue filings without stripping distributor margins |
| USD 11.39 B (2023) | Industry Association B | Segment share carved out of total soup retail scans; omits food-service flow and uses fixed 2021 FX rates |
These comparisons show that, while competitor totals swing widely, Mordor's measured approach, grounded in clear scope boundaries, multi-source validation, and timely updates, offers decision-makers a balanced, transparent baseline they can replicate and trust.


Key Questions Answered in the Report
What is the current size of the dried soup market?
The market stands at USD 6.81 billion in 2026 and is projected to reach USD 7.33 billion by 2031, growing at a 1.49% CAGR over 2026-2031.
Which product segment leads the dried soup market?
Instant variants hold the top position with 54.10% in 2025 revenue and will continue expanding at a 1.78% CAGR through 2031.
Why are vegetarian soups outperforming other categories?
Vegetarian lines benefit from plant-based dietary adoption, sustainability concerns, and cost stability, resulting in a 1.96% CAGR and more than half of category sales.
How significant is e-commerce for dried soup sales?
Online retail is the fastest-growing channel, advancing at 2.55% CAGR as consumers embrace convenience, subscription models, and wider assortment.
Page last updated on:


