Digital Twin In Finance Market Size and Share
Market Overview
| Study Period | 2020 - 2031 |
|---|---|
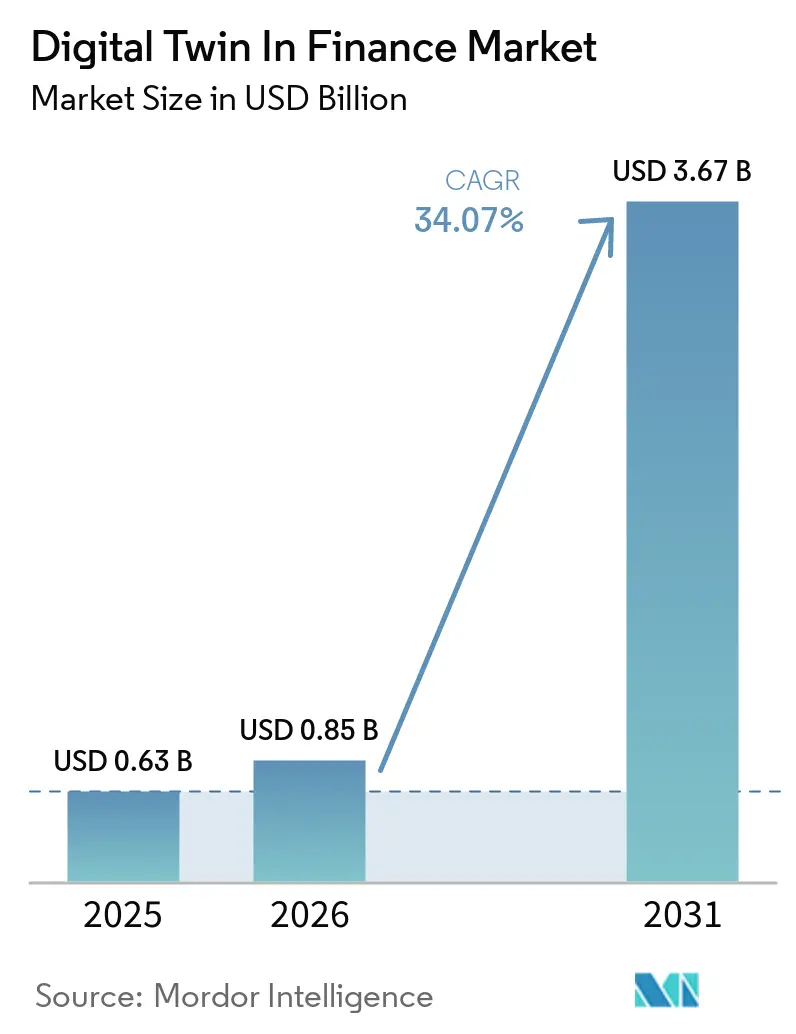
| Market Size (2026) | USD 0.85 Billion |
| Market Size (2031) | USD 3.67 Billion |
| Growth Rate (2026 - 2031) | 34.07% CAGR |
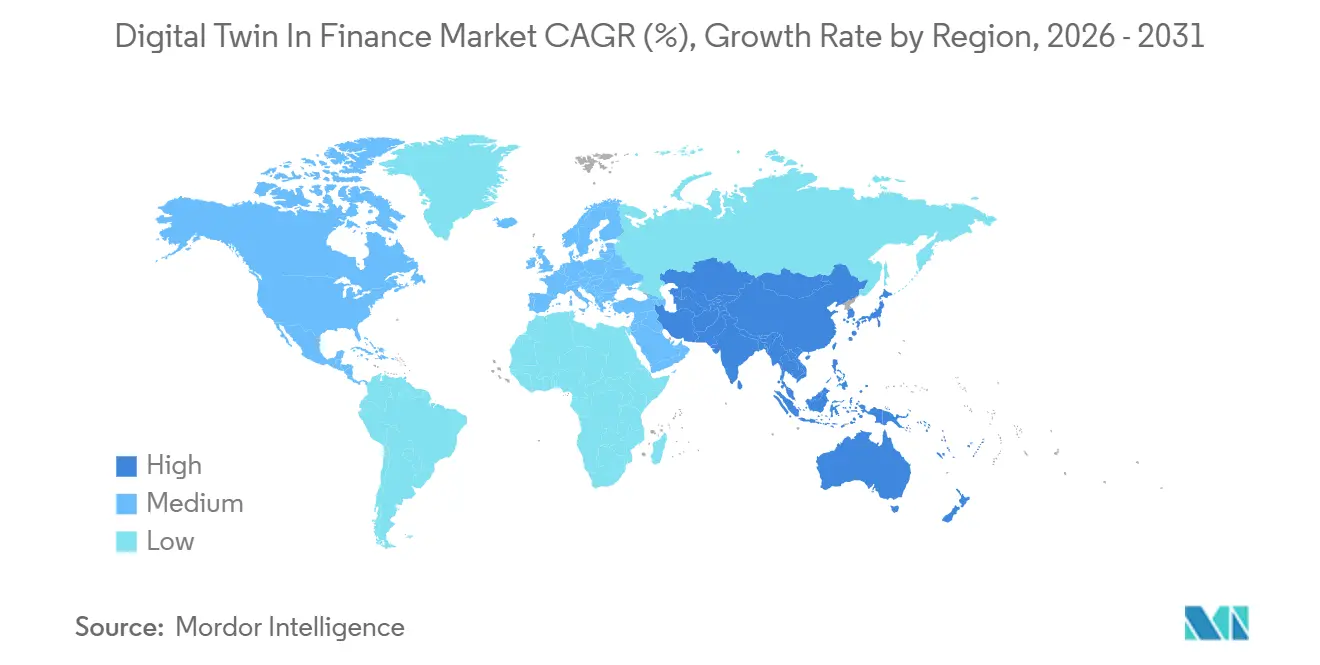
| Fastest Growing Market | Asia Pacific |
| Largest Market | North America |
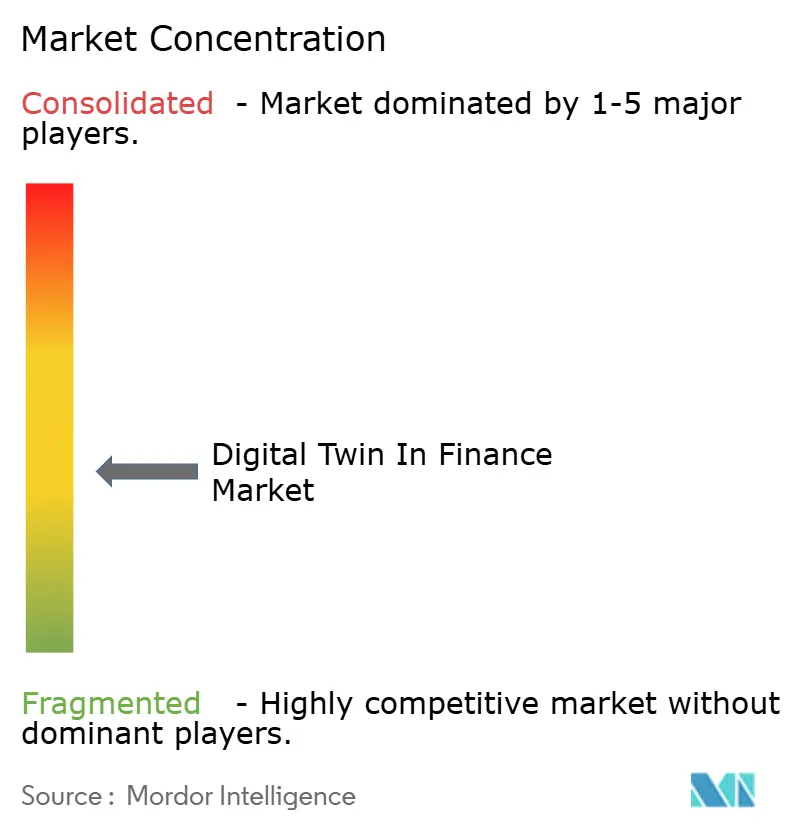
| Market Concentration | Medium |
Major Players *Disclaimer: Major Players sorted in no particular order Image © Mordor Intelligence. Reuse requires attribution under CC BY 4.0. | |
Digital Twin In Finance Market Analysis by Mordor Intelligence
The digital twin in finance market size is projected to be USD 0.63 billion in 2025, USD 0.85 billion in 2026, and reach USD 3.67 billion by 2031, growing at a CAGR of 34.07% from 2026 to 2031. Banks, insurers, and capital markets firms are moving quickly because virtual replicas enable real-time stress testing of portfolios, payment flows, and operational processes. Software retained the largest 46.57% revenue share in 2025, yet API-first platforms are scaling faster as they link cloud-native analytics to legacy cores. Risk-management twins dominated initial demand, while fraud-detection twins are now expanding at 34.98% as agentic AI slashes false-alarm rates. Hybrid-cloud deployments, modular architectures, and consumption pricing are lowering entry barriers, allowing small and medium-sized institutions to pilot a digital twin in the finance market offering without major re-platforming.
Key Report Takeaways
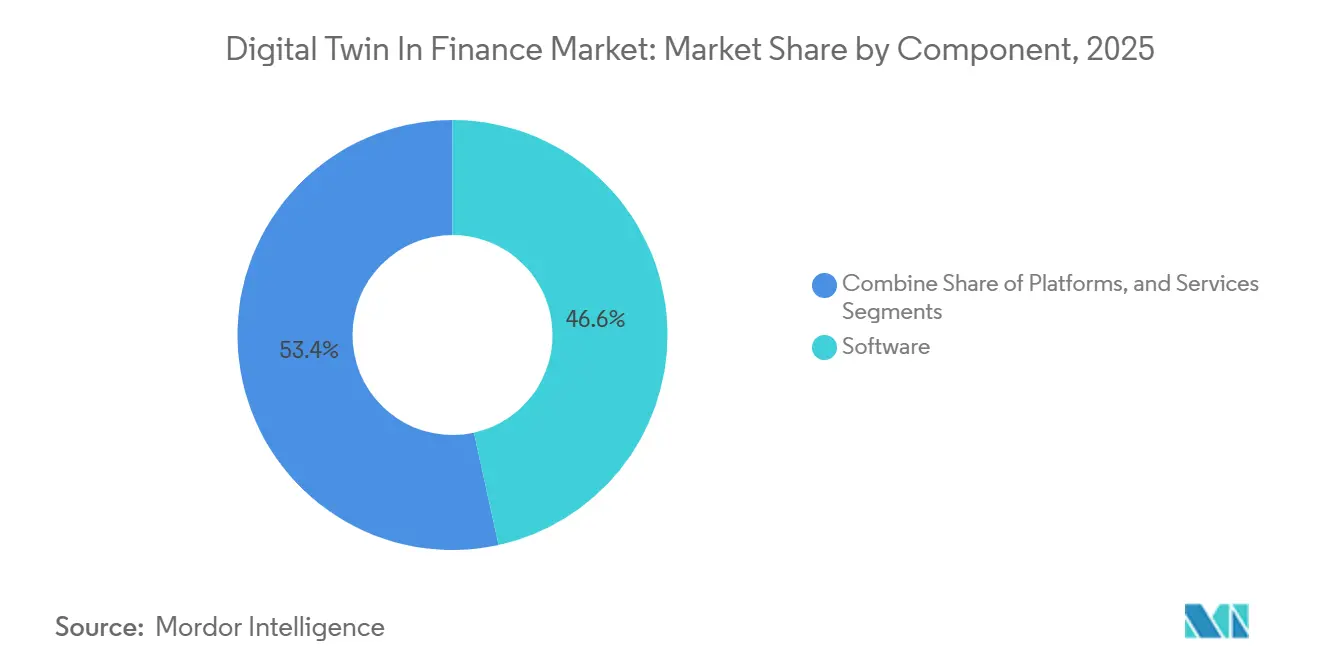
- By component, software led with 46.57% of digital twin in finance market share in 2025, while platforms are forecast to grow at a 35.03% CAGR through 2031.
- By application, risk management held 30.21% of digital twin in finance market share in 2025 and fraud detection and prevention is advancing at a 34.98% CAGR during 2026-2031.
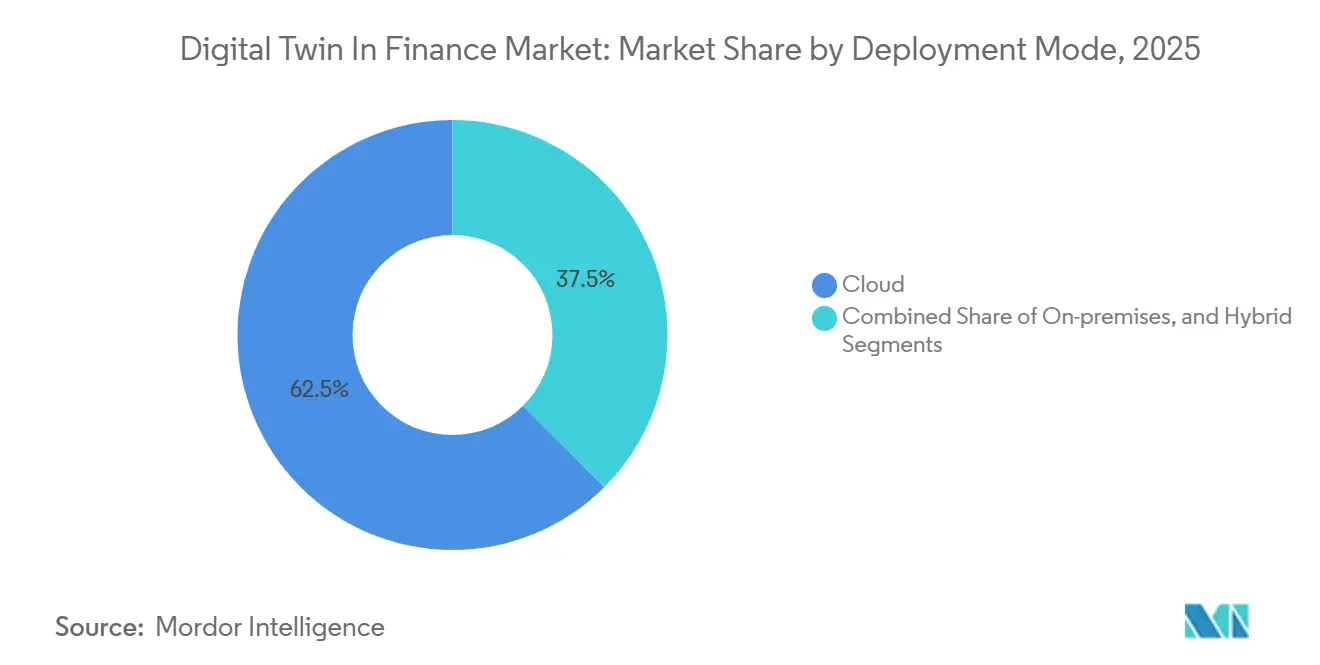
- By deployment mode, cloud captured 62.47% of digital twin in finance market share in 2025; hybrid configurations are projected to post a 35.09% CAGR to 2031.
- By organisation size, large enterprises commanded 71.63% of digital twin in finance market share in 2025, yet SMEs are projected to expand at a 34.91% CAGR over the same horizon.
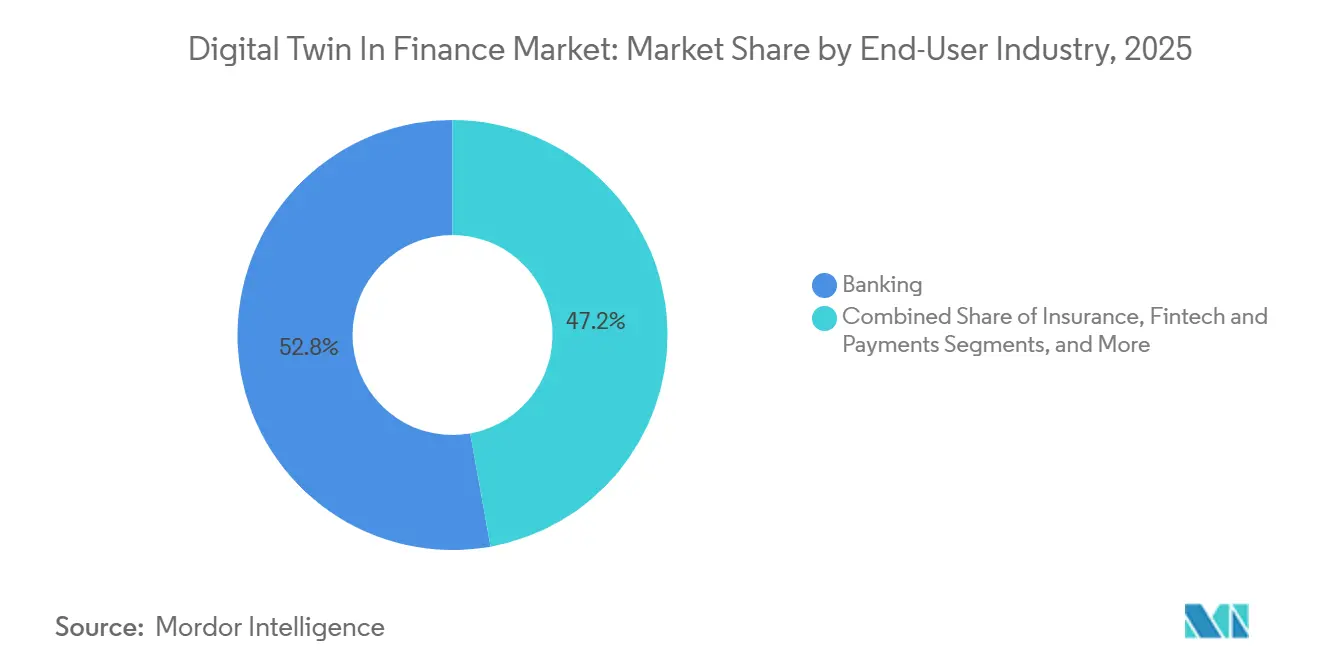
- By end-user industry, banking generated 52.82% of digital twin in finance market share in 2025, whereas fintech and payments is set to rise at a 34.88% CAGR through 2031.
- By geography, North America led with 35.19% of digital twin in finance market share in 2025 and Asia-Pacific is expected to grow at a 35.14% CAGR during the forecast period.
Note: Market size and forecast figures in this report are generated using Mordor Intelligence’s proprietary estimation framework, updated with the latest available data and insights as of January 2026.
Global Digital Twin In Finance Market Trends and Insights
Drivers Impact Analysis*
| Driver | (~) % Impact on CAGR Forecast | Geographic Relevance | Impact Timeline |
|---|---|---|---|
| Real-Time Risk-Management Demand Surges | +7.2% | Global; early adoption in North America and Europe; rising in Asia-Pacific | Medium term (2–4 years) |
| Cloud and AI Adoption Across BFSI | +6.8% | Global; strong in North America and Europe; hybrid growth in Asia-Pacific | Short term (≤ 2 years) |
| Personalization-Driven Customer Twins | +5.4% | North America, Europe, Asia-Pacific, Middle East | Medium term (2–4 years) |
| Process-Efficiency and Cost-Reduction Focus | +5.1% | Global; strongest in North America and Europe; expanding among Asia-Pacific SMEs | Short term (≤ 2 years) |
| Regulatory Sandbox Stress-Test Mandates | +4.3% | Europe, North America, Asia-Pacific, Middle East | Long term (≥ 4 years) |
| ESG and Climate-Scenario Digital Twins | +3.9% | Europe, North America, Asia-Pacific, Middle East | Long term (≥ 4 years) |
| Source: Mordor Intelligence | |||
Real-Time Risk-Management Demand Surges
Central banks and systemically important institutions now depend on payment-network twins that simulate intraday liquidity shocks within milliseconds, a capability proved by FNA deployments at the Bank of England and Payments Canada.[1]FNA, “Real-Time Gross Settlement Digital Twins,” fna.fi BlackRock’s Aladdin Risk platform processes roughly 5,000 multi-asset factors daily and uses AI co-pilots to automatically generate stress scenarios, cutting analyst effort by 10-15 hours per week. Moody’s Analytics added Peril Metrics in 2026, blending property intelligence with catastrophe science to enable insurers to re-underwrite portfolios at the individual-location level. The Basel Committee’s 2025-2026 agenda signals that supervisors will soon codify validation standards, accelerating mandatory uptake. These factors jointly propel the digital twin in the finance market because firms must demonstrate resilient capital and liquidity under extreme but plausible events.
Cloud and AI Adoption Across BFSI
Elastic compute and agentic AI workflows hit production scale once hybrid-cloud models reconciled sovereignty rules with GPU demand. DingTalk Hybrid Cloud delivered a 2.7× return on investment and 40% cost savings for Hong Kong institutions while meeting local data mandates. IBM showcases multi-cloud twin federation to enable banks to fail over instantly if a hyperscaler falters. Microsoft enabled regulated-industry AI workflows in March 2026, aligning with the European Union’s Digital Operational Resilience Act. DBS Bank shortened know-your-customer processing by 33% and lifted personalization conversion by 29% using generative twins that synthesize transactions and sentiment. Rapid, compliant compute unlocks new simulation depths, fuelling the digital twin in the finance market.
Personalization-Driven Customer Twins
Retail banks and wealth managers are building individual twins that forecast life events, cash-flow gaps, and risk tolerance, enabling hyper-targeted offers. Barclays began piloting ExpectAI twins for small businesses in 2026, tailoring working-capital facilities and green loans. A Scientific Reports study showed a supply-chain finance twin boosted prediction accuracy to 94.7% and saved USD 8.3 million a year across 850,000 monthly transactions. Insurers now tweak premiums in real time by linking twins to telematics and wearables, raising combined ratios by up to 10 percentage points in early deployments. Stand Insurance ingests wildfire and hurricane forecasts to reprice hours before landfall, protecting capital and clients. Such individualized insight cements customer loyalty and widens revenue per user, pushing further growth in the digital twin in the finance market.
Process-Efficiency and Cost-Reduction Focus
Institutions target 20-30% cost cuts by automating middle- and back-office tasks through process twins. Atom Bank saved more than GBP 1 million (USD 1.27 million) annually by optimizing branch footprints with the help of Durham University. A regional lender halved loan-processing time using an underwriting twin that auto-populated risk scorecards. PUY reconciles 1 billion transactions daily at T+0 with 98% automation, freeing treasury staff for liquidity optimization. Deloitte and BMO modeled 500 branches in Matterport 3D twins, avoiding physical site visits and thousands of labor hours. Tangible savings shorten payback periods and make a digital twin in the finance market rollout a board-level imperative.
Restraints Impact Analysis*
| Restraint | (~) % Impact on CAGR Forecast | Geographic Relevance | Impact Timeline |
|---|---|---|---|
| Data-Privacy and Cybersecurity Concerns | -3.6% | Global; most stringent in Europe and North America; rising in Asia-Pacific | Short term (≤ 2 years) |
| Legacy-System Integration Complexity | -3.2% | Global; particularly acute in North America and Europe | Medium term (2–4 years) |
| High Up-Front Cost and Uncertain ROI | -2.8% | Global; heavier impact on SMEs in developing regions | Medium term (2–4 years) |
| Algorithmic-Bias Compliance Exposure | -2.1% | North America and Europe; emerging in Asia-Pacific | Long term (≥ 4 years) |
| Source: Mordor Intelligence | |||
Data-Privacy and Cybersecurity Concerns
Customer twins pool granular transactions and inferred behaviors, making them lucrative targets for hackers and raising consent challenges. IOSCO’s Final Report FR/17/2025 framed twins as non-native tokens and flagged legal gaps around data ownership when the twin and source diverge. Bankee Social Bank avoided NTD 300 million (USD 9.8 million) in fraud but faced scrutiny over social graph inference without explicit approval.[2]Bankee Social Bank, “4D AI Anti-Fraud System,” bankee.com.tw Lucinity found 71% of firms use twin-driven fraud tools, yet regulators question whether retention periods breach minimization rules. A large breach could expose proprietary algorithms, turning security from a control cost into a strategic necessity that tempers the adoption of digital twins in the finance market.
Legacy-System Integration Complexity
Most global banks still run credit-card or deposit cores on mainframes that refresh once nightly, clashing with the second-level cadence of twins. Matera’s transaction twin achieves 12,000 messages per second for RTP and stablecoins but requires parallel dual-ledger reconciliation during migration. Legend Bank built a real-time mirror to oversee partner traffic, adding middleware layers that generate latency. IBM’s Enterprise Advantage package pairs AI middleware with scarce COBOL skills, yet projects still stretch 12-24 months. Institutions caught between high re-platforming costs and stale data states move slowly, thereby limiting a portion of the digital twin's overall potential in the finance market.
*Our forecasts treat driver/restraint impacts as directional, not additive. The impact forecasts reflect baseline growth, mix effects, and variable interactions.
Segment Analysis
By Component: Platforms Gain as Modularity Trumps Monoliths
Platforms are set to grow at a 35.03% CAGR, thanks to composable microservices that enable incremental rollouts and quick integrations. The 46.57% software share in 2025 reflected legacy simulation engines bundled in enterprise suites, but SAP Signavio and Microsoft Azure Digital Twins now expose open endpoints that third-party developers can consume. Services follow platform uptake as banks still need process mapping and model explainability experts.
Vendor economics favor scale: every new connector to a payment rail boosts platform stickiness, encouraging multi-year commitments. Accenture’s 2025 purchase of Percipient suggests that integrators expect platform programs to anchor consulting pipelines.[3]Accenture, “Percipient Acquisition,” accenture.com Investors echoed that view when Twin Health raised USD 283 million, valuing its metabolic-health twin above USD 1 billion and signaling cross-sector reach. As a result, platforms are on course to capture disproportionate market share in the finance digital twin market over the forecast horizon.


By Application: Fraud Detection Surges on Agentic AI Breakthroughs
Risk-management twins accounted for 30.21% of revenue in 2025, but fraud twins will post the fastest 34.98% CAGR as real-time rails erase batch-review windows. FICO’s Focused Sequence Models build behavioral twins that cut false positives for instant payments. Aveni reported 60% lower alert noise and 22% higher confirmed cases, enabling staff to redeploy to deeper investigations.
Customer-experience twins embedded in mobile apps fine-tune interfaces based on predicted sentiment and behavior. Process-automation twins, such as PUY’s reconciler, move settlement from T+1 to T+0, shrinking operational risk. Compliance twins autogenerate stress-test templates, easing supervisory submissions. Vertical specialization is rising because a mortgage twin must model escrow timings, whereas a trade-finance twin must emulate incoterms and vessel milestones. These nuanced needs reinforce the expansion of the digital twin in the finance market for application-specific solutions.
By Deployment Mode: Hybrid Configurations Resolve Sovereignty Tensions
Cloud accounted for 62.47% of revenue in 2025, but hybrid setups are forecast to grow at a 35.09% CAGR as data-residency rules tighten. DingTalk Hybrid Cloud demonstrated that institutions can keep personally identifiable data on-premises while harnessing bursty compute in the public cloud. Microsoft’s 2026 release of agentic AI support on its hybrid platform aligns directly with European and Asian regulatory continuity rules.
On-premises systems still dominate proprietary trading desks that will not accept co-tenancy risk. Matera allows compute to run locally while syncing anonymized aggregates to the cloud, balancing latency with disaster recovery. Infrastructure vendors now ship edge appliances pre-loaded with twin runtimes, a trend likely to diversify digital twin offerings in the finance market across different compliance regimes.
By Organisation Size: SMEs Accelerate as Consumption Pricing Lowers Barriers
Large enterprises accounted for 71.63% of spending in 2025, yet SMEs will grow at a 34.91% CAGR because pre-built templates cut proof-of-concept cycles from quarters to weeks. Barclays’ SME twin pilot demonstrates that tier-one banks see small-business portfolios as a sandbox for at-scale experimentation. South Indian Bank reported 98.5% of transactions were digital and cited twin initiatives as key to seamless regional operations.
Vertical software-as-a-service vendors tailor twins to restaurant cash management or retail inventory turns, letting smaller firms subscribe rather than license. Large banks, in contrast, pair twins with data-lake consolidation and AI buildouts that still consume multi-year budgets. The bifurcated approach creates parallel growth engines within the overall digital twin in the finance market.
By End-User Industry: Fintech Disrupts as Real-Time Rails Demand Instant Twins
Banking accounted for 52.82% of revenue in 2025, yet fintech and payments will show the highest 34.88% CAGR, as stablecoins and 24×7 rails require millisecond twins. Matera’s platform posts 12,000 transactions per second for RTP, FedNow, and USD-backed stablecoins. FNA runs RTGS twins for multiple global payment operators, cementing twin footprints in systemic infrastructures.
Insurers deploy catastrophe-loss twins, as evidenced by AIG’s USD 1 billion investment, which trimmed its expense ratio to 31.1%. Asset managers rely on collateral twins, with Broadridge’s repo platform clearing USD 300 billion in daily transactions. Converging industry lines mean that any institution handling time-critical money flows must adopt twins, keeping the digital twin in the finance market expansion, broad-based across subsectors.
Geography Analysis
North America held 35.19% of the digital twin market share in finance in 2025, thanks to deep cloud infrastructure, skilled AI talent, and supervisory sandboxes. U.S. broker-dealers use collateral twins to satisfy upcoming climate disclosures, while Payments Canada adopts FNA RTGS twins for stress scenarios. BlackRock’s Aladdin Risk processes 5,000 factors daily, signaling a strong appetite for scale. Moody’s Peril Metrics lets U.S. insurers adjust property portfolios at the parcel level. State privacy laws enforce consent logic in customer twins, shaping deployment features.[4]BlackRock, “Aladdin Risk Platform,” blackrock.com
Europe moves on regulatory clarity instead of scale. The United Kingdom’s Digital Securities Sandbox enabled ledger pilots in 2023, and the European Union’s DLT Pilot licensed four operators by early 2025. The Basel Committee's focus on digitalization implies the development of formal validation test suites ahead. Lloyds Banking Group and Mapfre implemented resilience twins to meet the timelines of the Corporate Sustainability Reporting Directive. Banque de France research links flood exposure to probability of default, pushing banks toward ESG twins. Middle East sovereign funds use RiskThinking.ai climate twins to trim capital buffers by 20%. African mobile-money firms experiment with liquidity twins, while South American supervisors monitor overseas pilots before writing rules.
Asia-Pacific delivers the fastest 35.14% CAGR as domestic regulators green-light digital banks that must monitor risk in real time. India’s Unified Payments Interface processes more than 12 billion monthly transactions, which demand sub-second fraud detection. DBS cut know-your-customer times by a third using generative twins. Accenture’s Percipient buyout deepens local implementation talent. Taiwan’s CTBC Bank and Bankee Social Bank deploy anti-fraud twins with 98.7% accuracy. DingTalk Hybrid Cloud shows cost and compliance gains in Hong Kong. Regional rules from the Monetary Authority of Singapore and the Reserve Bank of India guide vendor risk assessments, making hybrid deployments the norm and sustaining digital twin momentum in the finance market.

Competitive Landscape
The digital twin market in the finance industry is moderately concentrated. Enterprise software incumbents and hyperscale clouds win large transformation deals, while specialist fintechs capture mid-tier opportunities with rapid-deployment software-as-a-service. AIG invested USD 1 billion and partnered with Palantir to build an ontology twin, which reduced its expense ratio by 90 basis points and increased underwriting income by 22%.[5]AIG, “AI-First Strategy,” aig.com Such success stories push peers to follow.
Technology differentiation turns on real-time ingestion and explainability. Matera processes 12,000 messages per second and supports stablecoins, while IBM’s Enterprise Advantage offers AI middleware to connect COBOL-based cores to cloud twins. IOSCO’s 2025 report on data ownership compels vendors to embed immutable audit trails for supervisory comfort. Smaller firms lower price points through usage-based billing, expanding digital twin adoption in the finance market, and gaining market access to community banks and regional insurers.
White-space opportunities include Islamic-finance twins that model profit-sharing ratios, micro-insurance twins that reprice parametric cover using satellite weather, and treasury twins that optimize intraday liquidity. Investors recognize upside: Twin Health passed a USD 1 billion valuation in 2025. Consulting houses line up multi-year service pipelines around platform rollouts, and edge-compute suppliers bundle appliances that meet sovereignty mandates. Competitive intensity is therefore tightening, but specialization still leaves room for new entrants across niche workflows.
Digital Twin In Finance Industry Leaders
International Business Machines Corporation (IBM)
Microsoft Corporation
Oracle Corporation
Accenture plc
Altair Engineering Inc.
- *Disclaimer: Major Players sorted in no particular order

Recent Industry Developments
- March 2026: Microsoft announced agentic AI workflows for regulated industries, targeting scenario automation that complies with the European Union Digital Operational Resilience Act.
- February 2026: Moody’s Analytics launched Peril Metrics, combining CAPE Property Intelligence with RMS catastrophe science to recalibrate property-risk models.
- February 2026: AIG unveiled a USD 1 billion AI-first strategy anchored by Palantir Foundry and Anthropic, cutting its expense ratio to 31.1% and boosting underwriting income.
- January 2026: IBM introduced Enterprise Advantage middleware to bridge mainframe cores with cloud-native twins for institutions facing 12-24 month integration windows.
- September 2025: FICO released Focused Sequence Models that build behavioral twins to detect payment fraud with fewer false positives.


Global Digital Twin In Finance Market Report Scope
The Digital Twin In Finance Market Report is Segmented by Component (Software, Platforms, Services), Application (Risk Management, Customer Experience and Personalisation, Process Optimisation and Automation, Compliance and Regulatory Reporting, Fraud Detection and Prevention), Deployment Mode (Cloud, On-premises, Hybrid), Organisation Size (Large Enterprises, Small and Medium-sized Enterprises), End-User Industry (Banking, Insurance, Capital Markets and Investment Banking, Fintech and Payments), and Geography (North America, Europe, Asia-Pacific, Middle East, Africa, South America). The Market Forecasts are Provided in Terms of Value (USD).
| Software |
| Platforms |
| Services |
| Risk Management |
| Customer Experience and Personalisation |
| Process Optimisation and Automation |
| Compliance and Regulatory Reporting |
| Fraud Detection and Prevention |
| Cloud |
| On-premises |
| Hybrid |
| Large Enterprises |
| Small and Medium-sized Enterprises (SMEs) |
| Banking |
| Insurance |
| Capital Markets and Investment Banking |
| Fintech and Payments |
| North America | United States |
| Canada | |
| Mexico | |
| Europe | Germany |
| United Kingdom | |
| France | |
| Italy | |
| Spain | |
| Netherlands | |
| Russia | |
| Rest of Europe | |
| Asia-Pacific | China |
| Japan | |
| India | |
| South Korea | |
| Australia and New Zealand | |
| ASEAN | |
| Rest of Asia-Pacific | |
| Middle East | Saudi Arabia |
| United Arab Emirates | |
| Turkey | |
| Rest of Middle East | |
| Africa | South Africa |
| Nigeria | |
| Egypt | |
| Rest of Africa | |
| South America | Brazil |
| Argentina | |
| Rest of South America |
| By Component | Software | |
| Platforms | ||
| Services | ||
| By Application | Risk Management | |
| Customer Experience and Personalisation | ||
| Process Optimisation and Automation | ||
| Compliance and Regulatory Reporting | ||
| Fraud Detection and Prevention | ||
| By Deployment Mode | Cloud | |
| On-premises | ||
| Hybrid | ||
| By Organisation Size | Large Enterprises | |
| Small and Medium-sized Enterprises (SMEs) | ||
| By End-User Industry | Banking | |
| Insurance | ||
| Capital Markets and Investment Banking | ||
| Fintech and Payments | ||
| By Geography | North America | United States |
| Canada | ||
| Mexico | ||
| Europe | Germany | |
| United Kingdom | ||
| France | ||
| Italy | ||
| Spain | ||
| Netherlands | ||
| Russia | ||
| Rest of Europe | ||
| Asia-Pacific | China | |
| Japan | ||
| India | ||
| South Korea | ||
| Australia and New Zealand | ||
| ASEAN | ||
| Rest of Asia-Pacific | ||
| Middle East | Saudi Arabia | |
| United Arab Emirates | ||
| Turkey | ||
| Rest of Middle East | ||
| Africa | South Africa | |
| Nigeria | ||
| Egypt | ||
| Rest of Africa | ||
| South America | Brazil | |
| Argentina | ||
| Rest of South America | ||


Key Questions Answered in the Report
What is the projected value of the digital twin in finance market by 2031?
The market is forecast to reach USD 3.67 billion by 2031, growing at a 34.07% CAGR over 2026-2031.
Which component segment is expected to grow the fastest?
Platform offerings are projected to expand at a 35.03% CAGR as institutions prefer modular, API-first architectures.
Why are hybrid deployments gaining traction?
Hybrid models balance data-sovereignty mandates with the need for elastic compute, cutting infrastructure cost while meeting compliance rules.
How quickly are SMEs adopting digital twins?
Spending by small and medium-sized enterprises is set to climb at a 34.91% CAGR because consumption pricing and templates shorten proof-of-concept cycles.
Which application delivers the highest growth?
Fraud detection and prevention twins are advancing at a 34.98% CAGR, driven by agentic AI that reduces false positives on real-time payment rails.
Which region will record the fastest growth through 2031?
Asia-Pacific is expected to post a 35.14% CAGR, buoyed by digital banking charters, record UPI transaction volumes, and sovereign AI infrastructure mandates.
Page last updated on:


