Digital Circular Economy Market Size and Share
Market Overview
| Study Period | 2019 - 2030 |
|---|---|
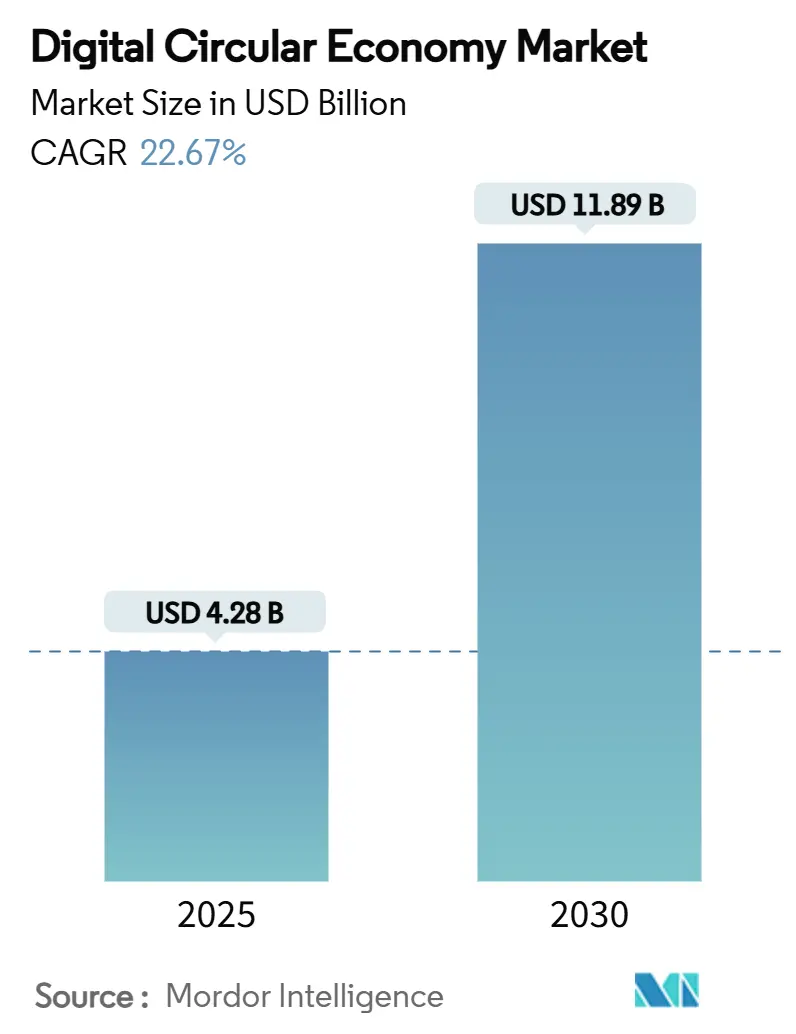
| Market Size (2025) | USD 4.28 Billion |
| Market Size (2030) | USD 11.89 Billion |
| Growth Rate (2025 - 2030) | 22.67% CAGR |
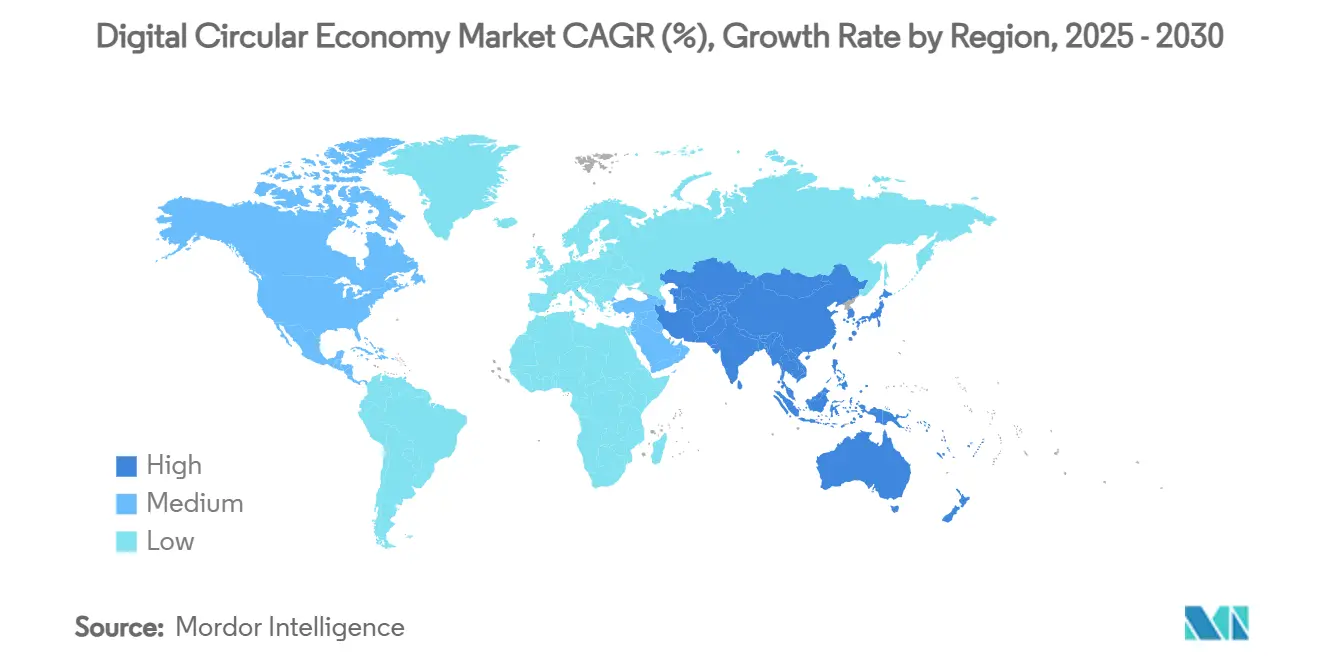
| Fastest Growing Market | Asia Pacific |
| Largest Market | Europe |
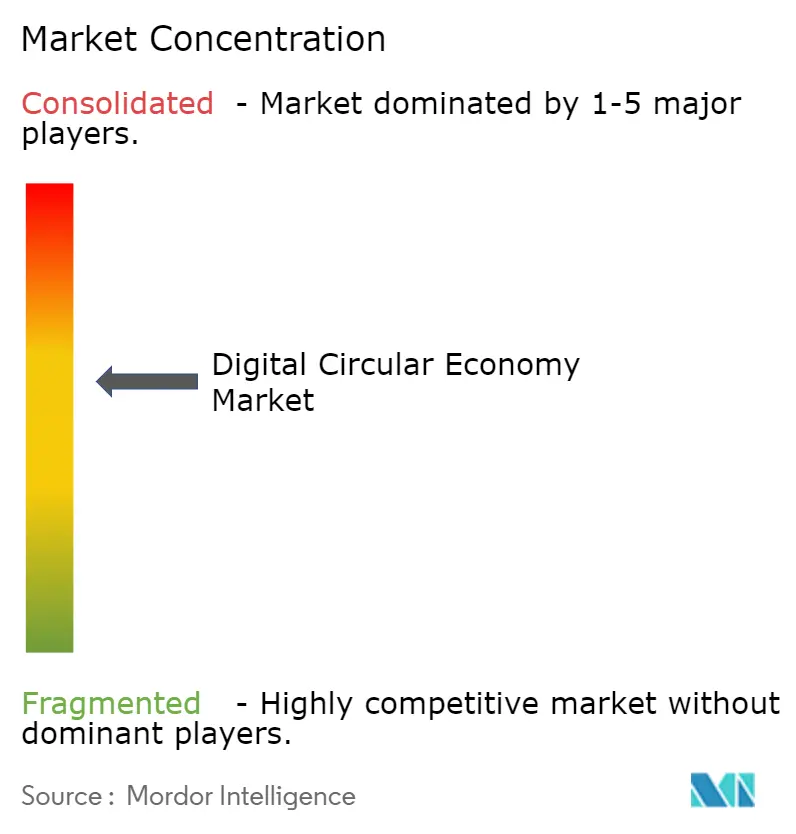
| Market Concentration | Medium |
Major Players *Disclaimer: Major Players sorted in no particular order Image © Mordor Intelligence. Reuse requires attribution under CC BY 4.0. | |
Digital Circular Economy Market Analysis by Mordor Intelligence
The digital circular economy market size stands at USD 4.28 billion in 2025 and is projected to reach USD 11.89 billion by 2030, advancing at a 22.67% CAGR. Momentum stems from mandatory traceability regulations, rising corporate sustainability investments, and the growing maturity of IoT, blockchain, and cloud platforms that make regenerative value chains practicable at scale. Enterprises are realigning procurement, product-design, and end-of-life logistics to capture residual value, lower input-cost volatility, and meet emissions-disclosure rules. Europe’s regulatory leadership accelerates early deployment, while Asia-Pacific’s industrial expansion and policy incentives fuel the fastest adoption curve. Competitive intensity is moderating integration costs as global software vendors embed circular modules in existing suites, allowing small and medium enterprises to participate. Service partners and data-analytics providers are positioning around interoperability and cyber-resilience, reflecting market anxieties about fragmented standards and data-sharing risks.
Key Report Takeaways
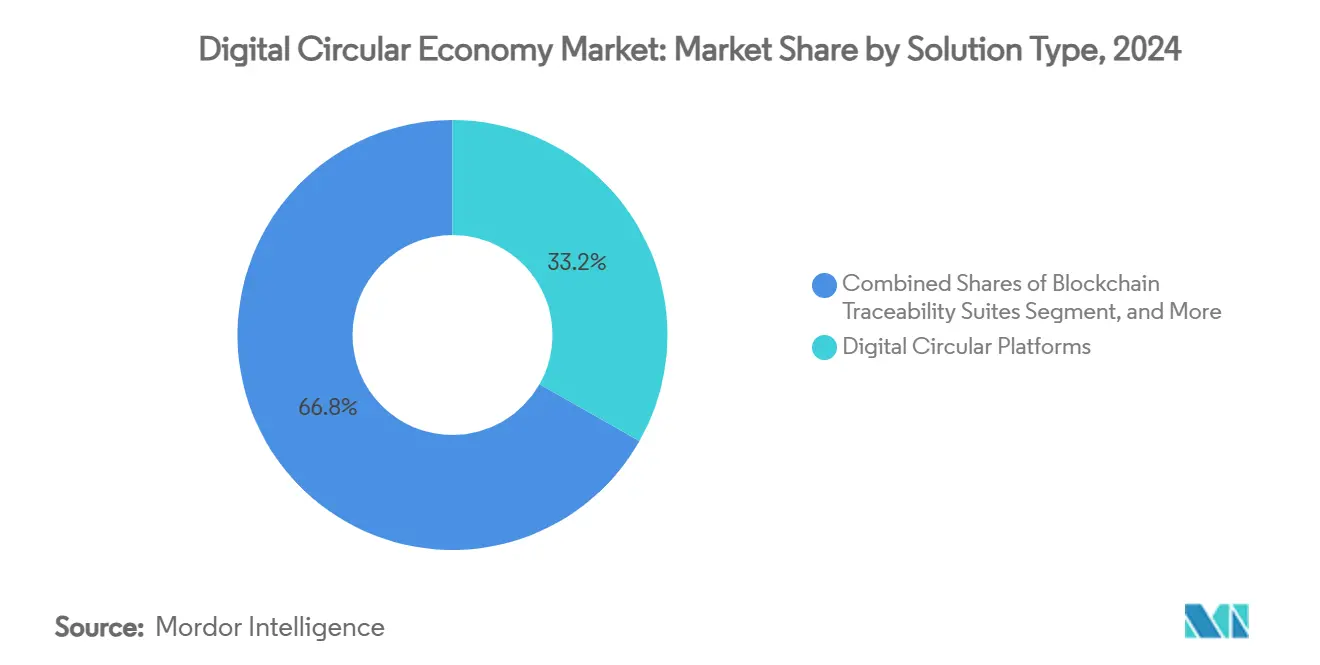
- By solution type, digital circular platforms held 33.21% of digital circular economy market share in 2024, while blockchain traceability suites are set to record the highest 25.61% CAGR through 2030.
- By business model, the product-as-a-service segment commanded 35.74% share of the digital circular economy market size in 2024; circular supply chains are forecast to expand at a 24.36% CAGR to 2030.
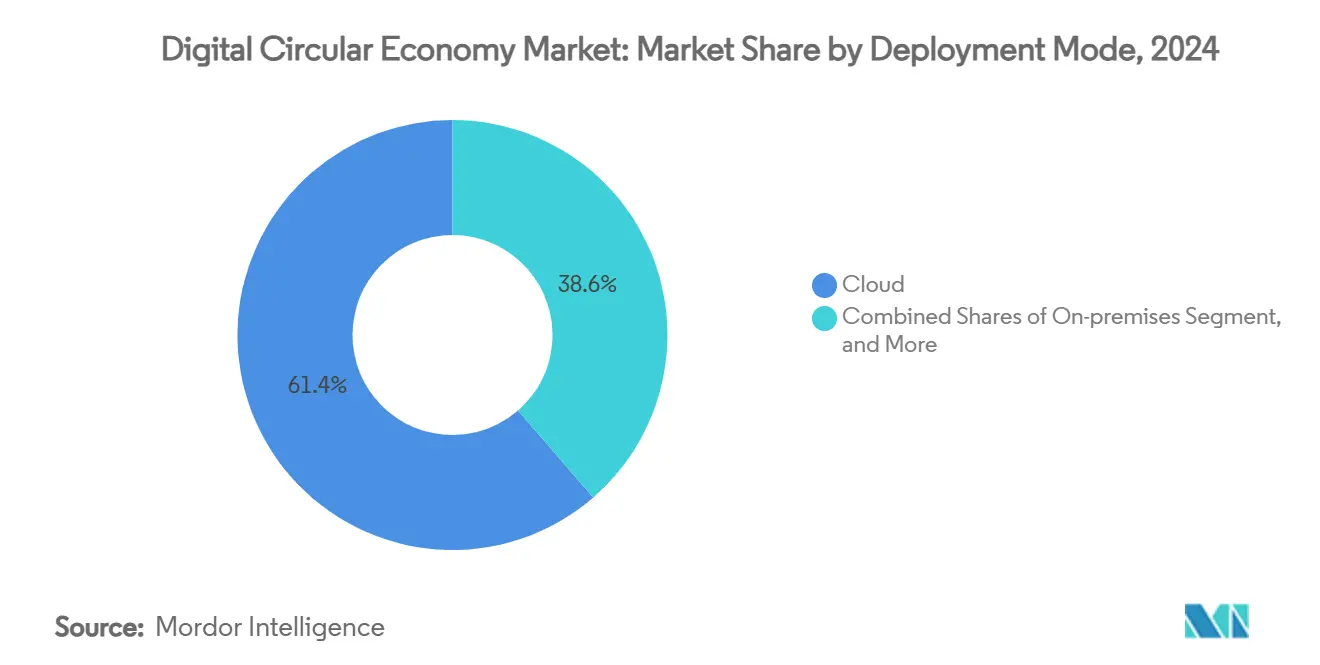
- By deployment mode, cloud solutions captured 61.37% revenue share in 2024 and are advancing at a 23.61% CAGR over the forecast period.
- By end-user industry, manufacturing led with 26.52% of digital circular economy market share in 2024, while fashion & textiles is projected to post the strongest 24.51% CAGR through 2030.
- By geography, Europe secured 29.32% market share in 2024; Asia-Pacific is projected to log a 25.38% CAGR between 2025 and 2030.
Global Digital Circular Economy Market Trends and Insights
Drivers Impact Analysis*
| Driver | (~) % Impact on CAGR Forecast | Geographic Relevance | Impact Timeline |
|---|---|---|---|
| Extended producer-responsibility mandates tighten after 2025 | +4.2% | Global, with early gains in EU, North America | Medium term (2-4 years) |
| Corporate ESG capital inflows accelerate digital circular platforms | +3.8% | Global, concentrated in developed markets | Short term (≤ 2 years) |
| Volatile raw-material prices incentivise material-efficiency software | +3.1% | Global, spill-over to emerging markets | Long term (≥ 4 years) |
| IoT and blockchain maturity enables end-to-end traceability | +4.7% | APAC core, spill-over to MEA | Medium term (2-4 years) |
| EU Digital Product Passport rollout under ESPR | +3.9% | Europe, with global supply chain implications | Medium term (2-4 years) |
| Carbon Border Adjustment Mechanism (CBAM) data requirements | +2.8% | EU imports, affecting global exporters | Short term (≤ 2 years) |
| Source: Mordor Intelligence | |||
Extended Producer-Responsibility Mandates Tighten After 2025
EPR frameworks are converging across jurisdictions, obliging producers to finance post-consumer waste collection and recycling programs. California’s Responsible Textile Recovery Act, effective 2026, compels apparel manufacturers to form producer responsibility organizations and submit auditable waste-management plans.[1]Keller and Heckman LLP, “California Becomes First State to Impose Extended Producer Responsibility on Textiles,” khlaw.com Washington State set daily penalties up to USD 10,000 for non-compliance with its 2025 packaging law. Kenya’s 2024 regulations require four-year EPR plans for imported goods.[2]Clyde & Co LLP, “The Extended Producer Responsibility Regulations 2024—What It Means for Producers in Kenya,” clydeco.com These mandates incentivize unified data repositories, automated audit trails, and real-time material-flow dashboards—capabilities at the heart of the digital circular economy market. Vendors able to demonstrate multi-jurisdictional compliance reporting gain a distinct contracting edge.
Corporate ESG Capital Inflows Accelerate Digital Circular Platforms
Private capital is amplifying government mandates. SHEIN’s EUR 200 million (USD 214 million) Textile Circularity Fund seeds startups that digitize material recovery Microsoft is funding hard-drive recycling ventures to reduce IT asset disposal risks.[3]Sustainable Tech Partner, “Microsoft Funds Hard Drive Recycling Startup,” sustainabletechpartner.com Cisco earmarked USD 100 million for climate-tech grants, including e-waste solutions. Sustainable-finance volumes exceeding USD 50 trillion by 2025 channel liquidity toward platforms that quantify carbon and waste reductions. Subsidized pilot programs lower entry barriers, boosting adoption among mid-tier manufacturers. The influx also allows vendors to accelerate R&D in AI-based material optimization and blockchain-enabled passports, reinforcing the digital circular economy market’s innovation cycle.
Volatile Raw-Material Prices Incentivise Material-Efficiency Software
Fluctuating commodity prices push manufacturers toward secondary inputs and closed-loop sourcing. A steel-industry case study demonstrated double-digit cost savings when digital platforms orchestrated scrap flows and furnace scheduling. Circular.co sourced 35,000 tons of post-consumer recycled plastic in Q4 2023, yielding 10% cost advantages for buyers. Taiwan’s pineapple-leaf fiber program has spawned new textile feedstocks that hedge cotton price swings. AI-driven analytics predict material shortages, enabling timely substitution and inventory management. These benefits sustain long-term growth in the digital circular economy market, especially in resource-intensive verticals.
IoT and Blockchain Maturity Enables End-to-End Traceability
Sensor miniaturization and energy-efficient ledgers have moved proof-of-concepts into large-scale deployments. SUEZ’s CircularChain logs sludge-to-fertilizer flows, giving farmers immutable nutrient data. Circularise validated blockchain passports in Japanese plastic-recycling trials, balancing confidentiality with transparency. Siemens is integrating blockchain with IoT to hit its 2030 carbon-neutral target. Coupling real-time telemetry with tamper-proof records unlocks smart-contract pay-per-use models and automated compliance updates, expanding the addressable base of the digital circular economy market.
Restraints Impact Analysis*
| Restraint | (~) % Impact on CAGR Forecast | Geographic Relevance | Impact Timeline |
|---|---|---|---|
| Fragmented data standards and interoperability gaps | -2.9% | Global, particularly affecting cross-border operations | Long term (≥ 4 years) |
| High integration and retrofit costs for legacy IT | -3.4% | Developed markets with established IT infrastructure | Medium term (2-4 years) |
| Cyber-security risks in open supply-chain data sharing | -1.8% | Global, concentrated in data-sensitive industries | Short term (≤ 2 years) |
| Talent shortage in circular data-science and material-flow modelling | -2.1% | Global, acute in specialized markets | Long term (≥ 4 years) |
| Source: Mordor Intelligence | |||
Fragmented Data Standards and Interoperability Gaps
Battery-passport pilots show the peril of non-aligned taxonomies: OEMs juggle blockchain, cloud, and on-prem architectures while negotiating access rights. Multi-blockchain prototypes for passports further complicate sync processes across value-chain tiers. Automotive consortium Catena-X is drafting sector-specific schemas, yet cross-industry harmonization remains embryonic. This fragmentation inflates vendor-evaluation cycles and prolongs proof-of-concept stages, trimming near-term revenue capture for the digital circular economy market.
High Integration and Retrofit Costs for Legacy IT
Early adopters validate economic upside—LG’s digital twin shaved 30% energy use—but capital outlays for sensors and middleware remain steep. Healthcare device refurbishing at Johnson & Johnson MedTech required bespoke separation lines and data connectors to produce auditable circularity metrics. Small firms lack pre-existing APIs, forcing custom builds that deter participation and dampen network effects, muting growth for pockets of the digital circular economy market.
*Our forecasts treat driver/restraint impacts as directional, not additive. The impact forecasts reflect baseline growth, mix effects, and variable interactions.
Segment Analysis
By Solution Type: Platforms Anchor Ecosystems while Blockchain Accelerates
Digital circular platforms captured 33.21% of digital circular economy market share in 2024 by acting as orchestration hubs that connect material-tracking functions, compliance modules, and financial-clearing engines. These suites aggregate IoT, AI, and ERP data streams, allowing manufacturers to optimize reuse and waste-diversion in one workspace. Integration blueprints that bundle passport issuance, emissions calculators, and reverse-logistics scheduling help large enterprises rationalize vendor portfolios and standardize workflows across plants. The deployment ease underscores why this segment remains the default entry point for enterprises beginning their circular transformation.
Blockchain traceability suites, while holding a smaller 2024 base, are set to scale at a 25.61% CAGR as regulatory provenance checks intensify. Successful pilots in plastic recycling and critical-minerals supply chains prove enterprise-grade throughput and confidentiality safeguards. As sovereign data spaces bloom, blockchain stacks offering selective disclosure and decentralized identifiers become indispensable, lifting the overall digital circular economy market size for traceability solutions. Interplay between platforms and ledgers is trending toward modular plug-ins rather than monolithic suites, signalling convergence rather than substitution.


By Business Model: Services Drive Monetization Breakthrough
Product-as-a-service models accounted for 35.74% share of the digital circular economy market size in 2024, reflecting the pivot from unit sales to outcome-based revenue. Original equipment manufacturers retain asset ownership, incentivizing higher durability and recoverability. Predictive-maintenance algorithms embedded in subscription contracts reduce field-service costs and feed life-cycle data back to design teams. This closed feedback loop generates recurring revenue and up-sells for refurbishment services, proving attractive to capital markets seeking stable cash flows.
Circular supply chains, expanding at a 24.36% CAGR, convert procurement units into value-recapture nodes. Digital marketplaces pair supply-side scrap inventories with demand from processors, shortening material-recycling lead times. AI engines quantify embodied carbon per shipment, enabling dynamic pricing that rewards lower-impact materials. Such transparency meets incoming Scope 3 disclosure standards, pulling additional enterprises into the digital circular economy market.
By Deployment Mode: Cloud Remains the Default but Hybrid Gains Depth
Cloud options commanded 61.37% revenue share in 2024 because real-time collaboration across suppliers, recyclers, and regulators requires globally accessible infrastructure. Edge-enabled ingestion funnels IoT telemetry into scalable analytics clusters, facilitating rapid passport validation. Vendors bundling cloud compute with sustainability modules reduce integration friction and accelerate proof-of-value cycles, reinforcing the digital circular economy market’s growth narrative.
Nevertheless, regulated industries still insist on on-prem or hybrid deployments for sensitive formulations or export-controlled data. Hybrid patterns now pair on-prem nodes that store proprietary recipe data with cloud-hosted analytics that crunch anonymized metadata. This compromise addresses sovereignty anxieties while preserving network advantages, broadening market appeal.
By End-user Industry: Manufacturing Leads, Fashion & Textiles Accelerate
Manufacturing represented 26.52% of digital circular economy market share in 2024. High material throughput and scrap-rate visibility mean ROI manifests quickly through reduced raw-material costs and avoided landfill fees. Digital twins deployed on shop floors minimize batch defects and cut energy intensity, directly lifting margins. Contract manufacturers also leverage passports to attract sustainability-minded brand owners, creating competitive lock-in.
Fashion and textiles are poised for the fastest 24.51% CAGR, spurred by the EU’s 2027 passport mandate. Brands pilot fiber-to-fiber recycling platforms to secure feedstock and defend against greenwashing allegations. With consumer sentiment shifting, traceability narratives command pricing premiums, making passport expenditures an investment rather than a compliance overhead. High SKU turnover further magnifies the digital circular economy market opportunity in apparel.
Geography Analysis
Europe, holding 29.32% of digital circular economy market share in 2024, benefits from synchronized policy instruments such as ESPR, CBAM, and national circular-economy roadmaps. Public-private consortia receive grants to upscale passport tooling, and standardized regulatory guidance reduces vendor-selection risk. Early adoption is also reinforced by consumer preference for verified sustainable products, creating a virtuous cycle for enterprise spending.
Asia-Pacific is charting a 25.38% CAGR through 2030, underpinned by China’s ambition to elevate the recycling sector to RMB 5 trillion (USD 773 billion) output by 2025. Policy priority under Japan’s Digital Agenda 2030 adds additional pull. Regional electronics and textile clusters see circularity as a hedge against export-market tariffs tied to embedded carbon. Government-backed industrial parks supply shared recycling infrastructure, lowering capital thresholds for SMEs and expanding the digital circular economy market.
North America catches up through state-level EPR and strong corporate ESG spending. Technology incumbents monetize existing cloud stacks by embedding circular modules, compressing deployment timelines. South America and the Middle East & Africa remain nascent but exhibit green-field potential where resource-nationalism and waste-management deficits intersect, suggesting upside optionality as standards globalize.

Competitive Landscape
Global software leaders-SAP, IBM, Microsoft-leverage incumbent ERP footprints to bundle circular functions, offering single-pane-of-glass dashboards that automate passport issuance and emissions accounting. Modular APIs hook into existing master-data layers, shrinking payback periods and reinforcing customer lock-in. Specialized players such as Circularise and Rheaply differentiate through deep domain schemas and privacy-preserving blockchain architectures, often becoming acquisition targets as the digital circular economy market scales.
Strategic acquisitions signal maturation. TOMRA’s 80% stake in c-trace deepens its digital waste-management bench while its 25% share in PolyPerception brings AI-powered waste flow recognition. Dassault Systèmes’ February 2025 3D UNIV+RSES launch combines generative AI with virtual twins, embedding circular metrics into design-to-manufacture workflows. Oracle’s decision to release its Fusion Cloud Sustainability module at zero incremental cost weaponizes pricing to capture mid-market demand.
Competitive focus now converges on interoperability toolkits, cyber-resilience add-ons, and marketplace integrations that match recycled material suppliers with buyers. Patent filings rise in confidential-computing and tokenized incentive schemes that reward validated waste-reduction, suggesting differentiation will pivot from core tracking to value-capture algorithms.
Digital Circular Economy Industry Leaders
SAP SE
IBM Corporation
Accenture plc
Microsoft Corporation
Schneider Electric SE
- *Disclaimer: Major Players sorted in no particular order

Recent Industry Developments
- February 2025: Dassault Systèmes unveiled 3D UNIV+RSES, integrating generative AI with virtual-twin technology to shorten design loops and embed recyclability insights at concept stage, positioning the firm as a lifecycle management orchestrator.
- February 2025: Dassault Systèmes subsidiary Centric Software acquired Contentserv for EUR 220 million (USD 235 million) to enhance multilingual product-experience management, enabling fashion clients to synchronize passport data with e-commerce listings
- January 2025: Circularise completed digital-product-passport trials in Japan, validating chain-of-custody tracking for plastics and opening revenue paths with local conglomerates.
- December 2024: SAP launched Green Ledger, fusing financial-grade audit trails with material-flow accounting, sharpening its edge against best-of-breed startups.


Global Digital Circular Economy Market Report Scope
| Digital Circular Platforms |
| IoT Sensors and Asset Tracking |
| Blockchain Traceability Suites |
| Digital Twin and Simulation |
| AI-Driven Material Flow Analytics |
| Product-as-a-Service (PaaS) |
| Sharing / Access Platforms |
| Resource Recovery and Reverse Logistics |
| Circular Supply Chains |
| Product-Life Extension Services |
| Cloud |
| On-premises |
| Hybrid |
| Manufacturing |
| Consumer Electronics |
| Automotive and Mobility |
| Fashion and Textiles |
| Construction and Building Materials |
| Healthcare and Life Sciences |
| Other End-user Industries |
| North America | United States | |
| Canada | ||
| Mexico | ||
| Europe | United Kingdom | |
| Germany | ||
| France | ||
| Italy | ||
| Spain | ||
| Russia | ||
| Rest of Europe | ||
| Asia-Pacific | China | |
| Japan | ||
| South Korea | ||
| India | ||
| Australia | ||
| Singapore | ||
| Rest of Asia-Pacific | ||
| South America | Brazil | |
| Argentina | ||
| Chile | ||
| Rest of South America | ||
| Middle East and Africa | Middle East | Israel |
| Turkey | ||
| Saudi Arabia | ||
| United Arab Emirates | ||
| Qatar | ||
| Rest of Middle East | ||
| Africa | South Africa | |
| Nigeria | ||
| Kenya | ||
| Rest of Africa | ||
| By Solution Type | Digital Circular Platforms | ||
| IoT Sensors and Asset Tracking | |||
| Blockchain Traceability Suites | |||
| Digital Twin and Simulation | |||
| AI-Driven Material Flow Analytics | |||
| By Business Model | Product-as-a-Service (PaaS) | ||
| Sharing / Access Platforms | |||
| Resource Recovery and Reverse Logistics | |||
| Circular Supply Chains | |||
| Product-Life Extension Services | |||
| By Deployment Mode | Cloud | ||
| On-premises | |||
| Hybrid | |||
| By End-user Industry | Manufacturing | ||
| Consumer Electronics | |||
| Automotive and Mobility | |||
| Fashion and Textiles | |||
| Construction and Building Materials | |||
| Healthcare and Life Sciences | |||
| Other End-user Industries | |||
| By Geography | North America | United States | |
| Canada | |||
| Mexico | |||
| Europe | United Kingdom | ||
| Germany | |||
| France | |||
| Italy | |||
| Spain | |||
| Russia | |||
| Rest of Europe | |||
| Asia-Pacific | China | ||
| Japan | |||
| South Korea | |||
| India | |||
| Australia | |||
| Singapore | |||
| Rest of Asia-Pacific | |||
| South America | Brazil | ||
| Argentina | |||
| Chile | |||
| Rest of South America | |||
| Middle East and Africa | Middle East | Israel | |
| Turkey | |||
| Saudi Arabia | |||
| United Arab Emirates | |||
| Qatar | |||
| Rest of Middle East | |||
| Africa | South Africa | ||
| Nigeria | |||
| Kenya | |||
| Rest of Africa | |||


Key Questions Answered in the Report
What is the projected value of the digital circular economy market by 2030?
The market is expected to reach USD 11.89 billion by 2030, reflecting a 22.67% CAGR from 2025.
Which solution category leads current adoption?
Digital circular platforms lead with 33.21% market share in 2024, serving as orchestration hubs for traceability and compliance.
Which region is growing fastest?
Asia-Pacific is forecast to expand at a 25.38% CAGR through 2030, driven by large-scale recycling targets under national plans.
How significant is cloud deployment?
Cloud solutions held 61.37% share in 2024 and are projected to grow at a 23.61% CAGR, reflecting the need for real-time collaboration.
Which end-user segment is likely to grow quickest?
Fashion and textiles are slated for a 24.51% CAGR, propelled by mandatory digital product passports and consumer demand for sustainable apparel.
What key risk could slow market momentum?
Fragmented data standards that hinder interoperability pose the largest technical barrier, potentially shaving 2.9% off forecast CAGR.
Page last updated on:


