
Digital Assurance Market Size and Share
Market Overview
| Study Period | 2020 - 2031 |
|---|---|
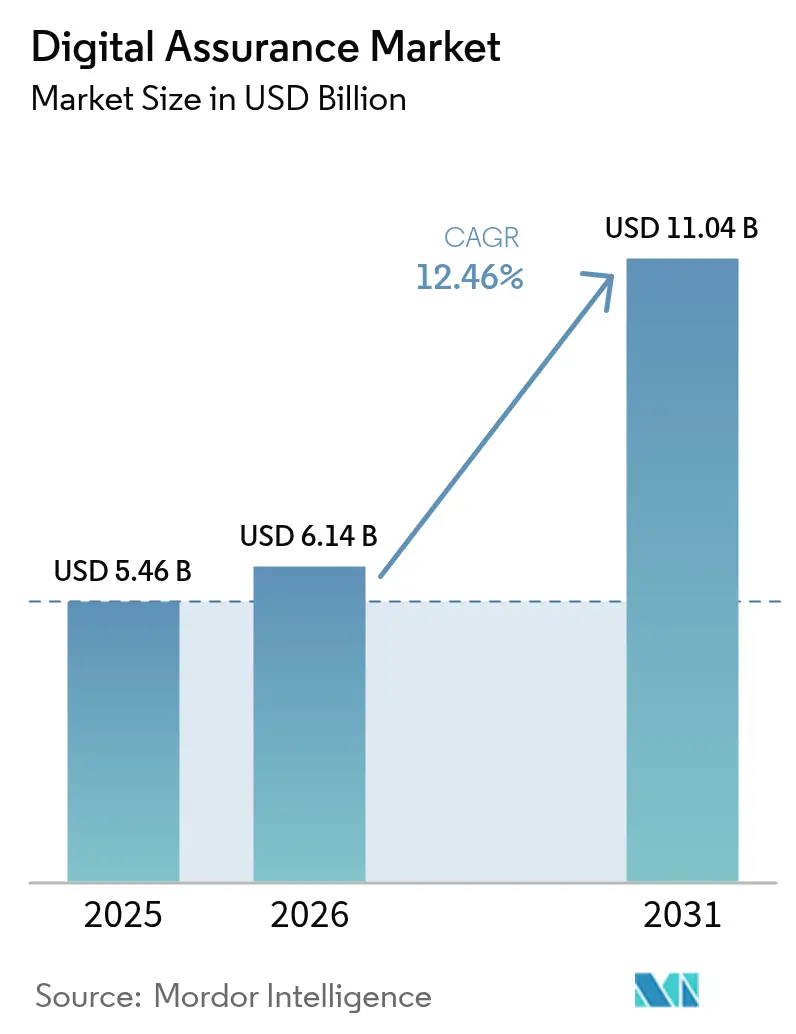
| Market Size (2026) | USD 6.14 Billion |
| Market Size (2031) | USD 11.04 Billion |
| Growth Rate (2026 - 2031) | 12.46 % |
| Fastest Growing Market | Asia Pacific |
| Largest Market | North America |
| Market Concentration | Medium |
Major Players *Disclaimer: Major Players sorted in no particular order Image © Mordor Intelligence. Reuse requires attribution under CC BY 4.0. | |
Digital Assurance Market Analysis by Mordor Intelligence
The digital assurance market size is expected to grow from USD 5.46 billion in 2025 to USD 6.14 billion in 2026 and is forecast to reach USD 11.04 billion by 2031 at 12.46% CAGR over 2026-2031. The expansion stems from enterprises treating quality assurance as a strategic accelerator of revenue rather than an engineering after-thought. Growth is reinforced by the fusion of AI with traditional testing, which is spawning autonomous test ecosystems that learn from production telemetry, adjust scripts without human input, and keep pace with microservices releases. Regulatory pressure around operational resilience, data protection and payment security further elevate testing budgets, while edge and 5G deployments extend assurance requirements beyond the datacenter. At the same time, a chronic shortage of software-development-engineer-in-test (SDET) talent and inflation in AI-tool licensing fees temper the trajectory but do not derail it. Finally, the competitive field remains fragmented: global IT-services majors, cloud-native testing platforms and AI-first start-ups all vie for share, each exploiting different routes to value.
Key Report Takeaways
- By testing type, functional testing led with 33.40% of the digital assurance market share in 2025, whereas AI-augmented testing is projected to expand at an 17.98% CAGR to 2031.
- By testing mode, manual testing deployment accounted for 57.20% of the digital assurance market share in 2025, while test automation deployment is set to grow at a 17.05% CAGR through 2031.
- By service model, managed testing services captured 41.30% of the digital assurance market share in 2025; platform-based QA-as-a-service is forecast to post the fastest 19.05% CAGR to 2031.
- By end-user vertical, the BFSI sector held 23.60% of the digital assurance market share in 2025, but healthcare and life sciences are advancing at a 16.45% CAGR toward 2031.
- By organisation size, large enterprises dominated with 60.20% of the digital assurance market share in 2025, whereas SMEs are on track for a 16.55% CAGR to 2031.
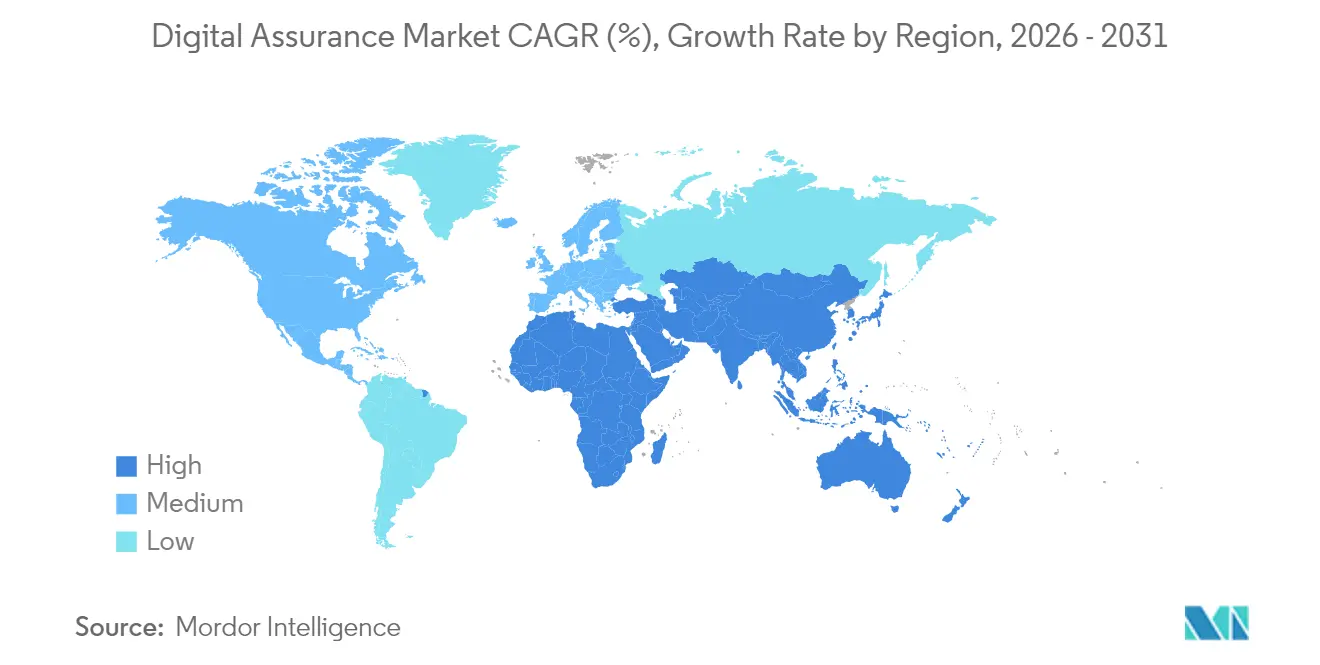
- By geography, North America retained the largest 40.40% of the digital assurance market share in 2025; Asia-Pacific is poised for the briskest 17.40% CAGR through 2031.
Note: Market size and forecast figures in this report are generated using Mordor Intelligence’s proprietary estimation framework, updated with the latest available data and insights as of 2026.
Global Digital Assurance Market Trends and Insights
Drivers Impact Analysis*
| Driver | (~) % Impact on CAGR Forecast | Geographic Relevance | Impact Timeline |
|---|---|---|---|
| Surging adoption of AI-augmented test frameworks | 2.80% | Global, with North America and Europe leading | Medium term (2-4 years) |
| Rising DevOps and CI/CD penetration across all verticals | 2.10% | Global, strongest in Asia-Pacific emerging markets | Short term (≤ 2 years) |
| Mandatory API-level monitoring for digital economy platforms | 1.90% | Global, regulatory-driven in BFSI and Healthcare | Medium term (2-4 years) |
| Budget re-allocation from legacy QA to autonomous testing bots | 1.70% | North America and Europe, expanding to Asia-Pacific | Long term (≥ 4 years) |
| Edge and 5G roll-outs demanding ultra-low-latency assurance | 1.50% | Asia-Pacific core, spill-over to North America | Long term (≥ 4 years) |
| "Shift-left" security mandates in regulated industries | 1.40% | Global, concentrated in BFSI and Healthcare | Medium term (2-4 years) |
| Source: Mordor Intelligence | |||
Surging Adoption of AI-Augmented Test Frameworks
Enterprises are embracing AI-enhanced testing suites that generate cases from user stories, self-heal scripts and surface defect probability scores in real time. Commercial platforms report AI functions trimming execution time by 40% and boosting defect discovery in early-stage builds. Adoption accelerated once generative models matured enough to translate plain-language requirements into runnable scripts, replacing days of manual authoring. Early movers accumulate proprietary training data that improves pattern recognition, raising a competitive barrier for late adopters. The scaling effect is most visible in regulated sectors where predictive analytics prevent outages that might trigger fines or brand damage. Vendors also bundle visual-comparison AI and autonomous accessibility checks, broadening use cases without inflating tool count for clients.[1]Wolfgang Platz, “AI-Enabled Quality Engineering: Cutting Execution Time with Self-Healing Tests,” Tricentis, tricentis.com
Rising DevOps and CI/CD Penetration Across All Verticals
Continuous integration and delivery pipelines are now mainstream, with 89% of medium-to-large organisations using CI tooling; however, nearly half still launch tests manually, revealing a sizeable automation headroom. Embedding test suites directly into the commit-to-deploy flow collapses feedback loops and curtails rework, which in turn compresses release cycles. Highly regulated industries adopt DevOps to capture granular audit trails automatically rather than through laborious documentation. Tool vendors consequently add security-scan, performance-baseline and compliance-evidence modules that activate at each pipeline stage. The convergence of development and operations thus extends assurance beyond pre-production into live observability, stimulating demand for unified dashboards that correlate defects, logs and user experience metrics.[2]Manu Arora, “CI/CD Testing Trends 2024,” LambdaTest, lambdatest.com
Mandatory API-Level Monitoring for Digital-Economy Platforms
The switch to API-first architectures in banking, commerce and digital health multiplies integration points, each of which must pass performance, security and compliance scrutiny. PCI DSS 4.0 alone widens vulnerability management from “critical only” to “all risk levels,” compelling 24/7 API monitoring rather than quarterly scans. Downtime trends underscore the urgency: average public-API availability slipped from 99.66% to 99.45% year-on-year, equating to 18 hours of lost service. Legislations such as the EU Digital Operational Resilience Act intensify pressure by demanding continuous testing evidence across distributed microservices. Vendors now embed traffic replay, contract fuzzing and automated security scans into one SaaS console, enabling compliance-ready reporting at sub-second granularity.
Budget re-allocation from legacy QA to autonomous testing bots
Boards are shifting spend from manual scripts toward autonomous bots that execute regression packs overnight and flag anomalies through ML-based risk scoring. Forty percent of large enterprises dedicate at least 25% of the testing wallet to automation platforms, a share expected to exceed one-third by 2027. The economic logic is clear: post-release bug fixes cost 100× more than pre-commit remediation. Early adopters redeploy human testers to exploratory scenarios and accessibility audits, boosting staff engagement while keeping throughput high. Training investments are required, yet payback arrives in under 18 months for most Fortune 1000 adopters because release velocity accelerates and support tickets decline.
Restraints Impact Analysis*
| Restraint | (~) % Impact on CAGR Forecast | Geographic Relevance | Impact Timeline |
|---|---|---|---|
| Scarcity of SDET and QE talent, wage inflation | -1.80% | Global, acute in North America and Europe | Short term (≤ 2 years) |
| Escalating test-tool licence costs for Gen-AI add-ons | -1.20% | Global, impacting SMEs disproportionately | Medium term (2-4 years) |
| Data-sovereignty limits on offshore test centres | -0.90% | Europe and Asia-Pacific, regulatory compliance driven | Long term (≥ 4 years) |
| AI-generated code unpredictability increases defect noise | -0.70% | Global, early AI adopters experiencing impact | Medium term (2-4 years) |
| Source: Mordor Intelligence | |||
Scarcity of SDET and QE Talent, Wage Inflation
Demand for hybrid testers who understand coding, pipelines and machine-learning is outstripping supply, pushing total compensation for senior SDETs beyond USD 225,000 in major US metros. Smaller firms struggle to match packages that include retention bonuses and dedicated upskilling budgets. The gap forces project delays, narrows test coverage and occasionally shifts release strategies toward feature flagging and incremental rollouts to limit exposure. Several providers respond by embedding low-code scripting engines that let domain experts craft tests without deep coding, but complex scenarios still need seasoned engineers.[3]Raj Verma, “Predictable Pricing for Gen-AI Test Suites,” Frugal Testing, frugaltesting.com
Escalating Test-Tool License Costs for Gen-AI Add-ons
Generative-AI modules—self-healing object locators, defect prediction, natural-language case authoring—are often priced per test-minute or per virtual-user. Usage spikes around major releases, leaving finance teams with unpredictable bills that can surge 3× quarter-over-quarter. SMEs, already cost-sensitive, sometimes delay AI uptake or confine it to critical paths, which perpetuates manual bottlenecks elsewhere. Some switch to open-source alternatives, though those require in-house maintenance and lack enterprise support options.
*Our forecasts treat driver/restraint impacts as directional, not additive. The impact forecasts reflect baseline growth, mix effects, and variable interactions.
Segment Analysis
By Testing Type: AI-Augmented Testing Disrupts Traditional Hierarchies
Functional testing retained a 33.40% revenue contribution in 2025, underscoring its centrality in verifying base business logic across web, mobile and API layers. Within that same year, AI-augmented testing carved out the fastest path forward at an 17.98% projected CAGR, fuelled by self-learning algorithms that repair object locators and prioritise high-risk paths automatically. Consequently, the digital assurance market size attributed to AI-augmented testing is set to surpass USD 3.08 billion by 2031. Performance and usability testing is also in demand as milliseconds of latency routinely translate into conversion gains or churn in consumer apps. Security testing climbs due to broader vulnerability mandates, while API testing rides the microservices wave, expanding coverage from REST to GraphQL and gRPC.
Network testing gains strategic weight where edge computing dictates sub-10 ms round-trip time. The segment now incorporates traffic-shaping bots that emulate 5G handovers and satellite links in real time. Hybrid frameworks blur historical silos: functional suites absorb AI analytics, and performance harnesses neural network models that forecast capacity thresholds. This convergence reshapes hiring profiles toward T-shaped engineers comfortable with Python, Kubernetes and data science. Despite skill headwinds, vendors that provide intuitive IDE-style interfaces lower entry barriers, expanding total addressable testers beyond traditional QA departments.




By Testing Mode: Automation Accelerates Despite Manual Testing Dominance
Manual testing deployment still accounts for 57.20% of 2025 revenue because exploratory scenarios require human intuition, especially around visual aesthetics and accessibility nuances. Yet test-automation deployment rises at a 17.05% CAGR and is projected to command over 50% of the digital assurance market by 2029. Automation thrives where CI/CD maturation obliges every commit to trigger suites across browser matrices and device farms. AI bolsters the trend through self-healing scripts that cut maintenance labour and by clustering flaky tests for rapid triage.
Organisations, however, seldom pursue a zero-manual ideal. Instead, they orchestrate hybrid pipelines where bots cover regression and smoke tests while experienced analysts examine edge cases, compliance narratives and user empathy paths. The shift reshapes talent planning: junior manual testers transition to automation engineering, while domain experts become “quality advocates” embedded within product squads. Vendors differentiate through low-code record-and-playback augmented by AI-generated assertions, giving non-programmers a route to automation without steep learning curves.
By Service Model: Platform-Based QA-as-a-Service Transforms Delivery
Managed testing services controlled 41.30% of 2025 spend as enterprises leaned on partners to backfill skill gaps and ensure round-the-clock coverage. Nonetheless, platform-based QA-as-a-service now exhibits the top CAGR of 19.05%, signalling that buyers favour consumption-based elasticity over multi-year body-shopping contracts. Under the model, teams spin up test environments on demand, pay per execution hour, and access a marketplace of add-ons such as visual AI, API security scans or compliance templates.
Consulting and advisory engagements remain essential whenever organisations re-architect monoliths into microservices or chart DevSecOps transformations. Crowd-sourced testing, though niche, flourishes for usability and real-device compatibility checks, leveraging a global community that spans low-end Android devices to next-gen smart TVs. Interestingly, leading providers integrate crowd insights into their SaaS consoles, unifying community feedback with automated pass/fail statuses. As enterprise procurement pivots toward platform ecosystems, vendors that present unified dashboards, pricing transparency and open APIs outpace those still anchored to staff-augmentation models.
By End-User Vertical: Healthcare Emerges as Fastest-Growing Sector
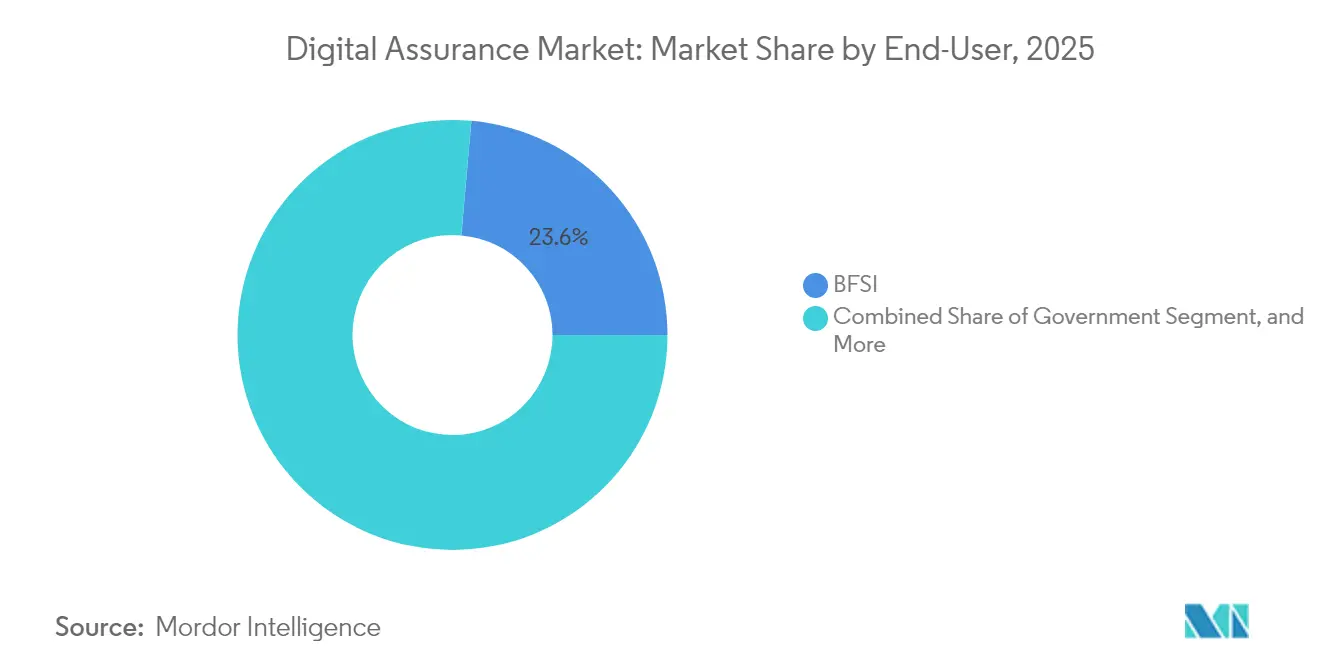
The BFSI complex accounted for 23.60% of 2025 revenue owing to continuous payments innovation, open-banking interfaces and intense cyber-regulations. However, healthcare and life sciences are set to expand at 16.45% CAGR, buoyed by telehealth, wearable diagnostics and stricter FDA software guidelines that codify risk-based testing. The segment’s trajectory is amplified by AI-driven diagnostics that necessitate algorithm validation against bias and safety thresholds.
Manufacturing shows steady uptake as Industry 4.0 pushes factory data onto cloud platforms that marry predictive maintenance with digital twins. IT and telecom testing demand accelerates alongside 5G core upgrades, open-RAN pilots and satellite-backhaul experimentation. Media and entertainment invests in concurrency stress tests for live streaming of large-scale sporting events, while government agencies modernise citizen portals, requiring accessibility and localisation checks. Each vertical imposes nuanced KPIs, be it monetary loss prevention in finance or patient safety in healthcare, driving specialised test-pack libraries within vendor catalogues.
By Organisation Size: SMEs Drive Disproportionate Growth
Large enterprises produced 60.20% of 2025 turnover, reflecting complex portfolios that span legacy systems and cloud-native workloads. Yet SMEs present the fastest 16.55% CAGR because cloud-based test platforms democratise access to enterprise-grade tooling. Consumption-based billing removes capex hurdles, letting a 50-employee fintech spin up hundreds of parallel browser sessions during peak release windows. Moreover, low-code authoring helps organisations without career QA staff craft resilient test packs, levelling the quality playing field against incumbents.
SMEs also pursue digital-first business models, meaning customer experience becomes existential rather than optional. Consequently, they allocate a growing slice of scarce engineering budgets to assurance, often skipping intermediate on-prem infrastructure generations and moving straight to SaaS pipelines. Vendors courting SMEs therefore emphasise quick onboarding, template repositories and bundled consultancy hours to offset the absence of internal specialists.
Geography Analysis
North America contributed 40.40% of 2025 revenue thanks to early AI-test framework adoption, PCI DSS 4.0 enforcement and an ecosystem of hyperscale cloud providers that embed testing marketplaces in their consoles. Regulatory expectations around auditability in healthcare and finance magnify spending, while venture capital clustering in Silicon Valley spawns AI-native testing start-ups that push innovation cycles faster. Talent shortages, however, inflate wage bills and limit capacity expansion in Tier-1 cities.
Asia-Pacific is the clear growth engine at 17.40% CAGR through 2031. Massive 5G roll-out in South Korea and Japan, India’s Digital Public Infrastructure stack and aggressive mobile-first commerce in Southeast Asia all compound demand. Enterprises favour cloud region local-isation to respect data-sovereignty rules such as India’s DPDP Act, which in turn prompts localised test clouds. The region also benefits from a deep STEM talent pool, enabling service providers to scale automation practices at costs 20-30% lower than US benchmarks.
Europe observes steady momentum under the twin pillars of GDPR and the Digital Operational Resilience Act. These regulations oblige continuous validation of data-handling controls and operational continuity, steering budgets toward traceable, risk-based testing. Fragmented national rules, however, mean vendors must tailor artefacts to multiple regulators, raising compliance overhead. Edge cases such as Brexit further complicate cross-border data flows, requiring geo-fencing and synthetic-data techniques for UK-EU deployments.
South America and the Middle East and Africa exhibit selective growth, led by Brazil’s e-commerce boom and Gulf smart-city programmes, respectively. While smaller in absolute dollars, these regions represent greenfield opportunities where cloud leapfrogging bypasses legacy QA tooling in favour of modern SaaS stacks. Providers that calibrate price points and language support for local realities gain early-mover advantage.

Regulatory Landscape
Digital assurance spend is increasingly shaped by operational resilience, telecom security, and software-quality standards that require evidence of continuous testing and controls. In the United Kingdom, central government assurance practices shifted effective 1 April 2026, when digital and technology spend controls moved from centralized gatekeeping to a pipeline approach with functional assurance, changing how suppliers provide test evidence and risk reporting across delivery stages. In the United States, OMB Memorandum M-26-10 (issued 31 March 2026) added procurement-facing oversight requirements, including reviews of IT contracts and vendor disclosure of utilization and pricing data beginning May 2026, reinforcing the need for granular measurement and traceable assurance artifacts in vendor tooling and services.
Sector-specific and cross-border requirements also raise localization and compliance overhead for assurance delivery. India introduced the Telecommunications (Critical Telecommunication Infrastructure) Rules 2024 (22 November 2024), requiring CTI hardware and software to meet Indian Telecommunication Security Assurance Requirements and adding government approval requirements for remote maintenance, which pushes testing and validation workflows closer to in-country operations. On the standards side, updates such as ISO/IEC/IEEE 12207:2026 and IEEE 730-2026, alongside ISO/IEC 25040:2024 and ISO/IEC TS 25058:2024 for AI quality evaluation, provide reference frameworks that buyers can use to benchmark software life cycle processes, SQA practices, and AI-specific quality evaluation.
Value Chain Analysis
The value chain spans strategy and requirements definition, test design and data preparation, toolchain and environment provisioning, execution across functional, performance, security, API, and network domains, and governance and reporting that converts results into release decisions and compliance evidence. Inputs increasingly include production telemetry and API traffic patterns for shift-right and continuous validation, and security baselines aligned to regimes such as PCI DSS 4.0 and operational resilience obligations in BFSI and regulated healthcare. Delivery flows through two primary routes, managed testing services (used to backfill SDET shortages and provide 24/7 coverage) and platform-based QA-as-a-service, where cloud execution hours, device grids, and AI add-ons are consumed on demand.
Upstream and adjacent ecosystem participants are expanding what is bundled into assurance, particularly for AI and emerging cryptography risks. Trade bodies such as TM Forum have formalized assurance approaches for communication service providers through guidebooks (for example, the GB1004G Digital Transformation Assurance Guidebook, v1.0.0, published March 2025), reinforcing embedded controls across Open APIs, microservices, and cloud-native OSS/BSS modernization. Partnerships also extend the chain into inspection, certification, and advanced risk domains, including SGS CertX joining the NVIDIA Halos AI Systems Inspection Lab ecosystem in July 2025 for verification of AI-driven autonomous systems, and DEKRA and IBM announcing a June 2026 memorandum of understanding to develop quantum safe assurance and post-quantum cryptography services, which can translate into new testing requirements for regulated and critical-infrastructure software stacks.
Competitive Landscape
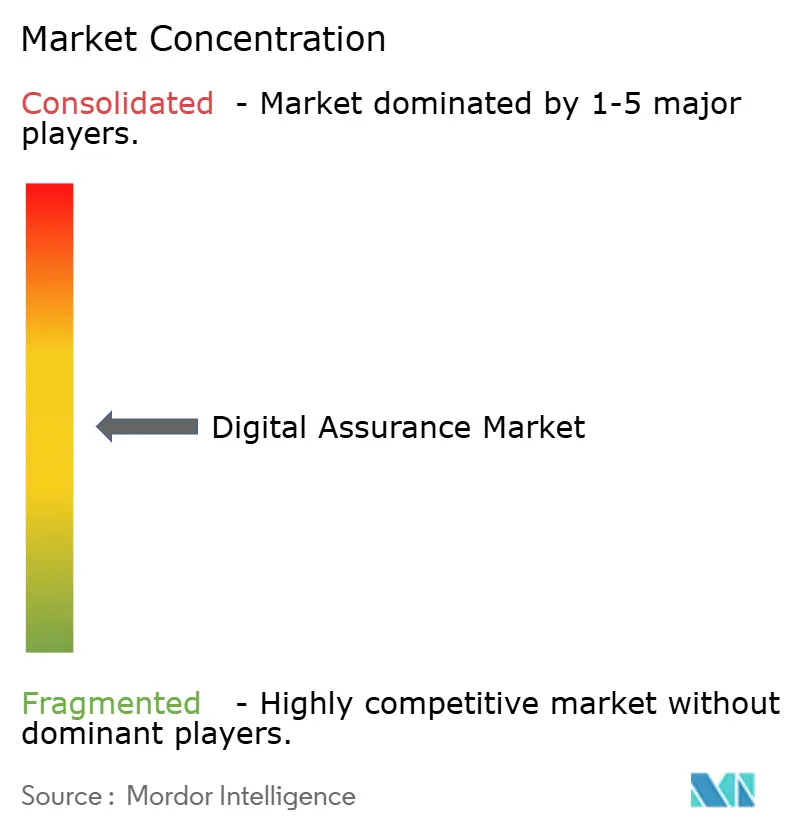
The digital assurance market is highly fragmented: no single vendor commands more than 6% revenue, and the top 10 together control roughly 32%. Global IT-services behemoths—Accenture, TCS, Infosys, capitalise on end-to-end transformation mandates to bundle assurance into broader deals. They invest in proprietary AI engines and curate partner ecosystems to keep pace with specialist speed.
Specialised cloud platforms such as BrowserStack and LambdaTest differentiate through device coverage, speed and AI-driven flake detection. BrowserStack’s 50,000-customer base demonstrates the appeal of cloud device grids for front-end teams worldwide. LambdaTest, meanwhile, raised USD 38 million to launch KaneAI, an intelligent assistant that flags unstable selectors and auto-generates assertions.
Consolidation continued in 2024-2025: Cognizant spent USD 1.3 billion on Belcan to broaden engineering services, while Eurofins Digital Testing joined private-equity portfolios aiming to build multi-discipline assurance champions. Strategic alliances supplement M&A, Infosys paired with Applause to fuse crowd-testing into its validation stack, and Accenture bought minority equity in Aaru to ingest consumer behaviour simulation into its AI suite. Vendors that showcase ROI—reduced cycle times, fewer escaped defects, demonstrable compliance artefacts—win wallet share over pure staff-augmentation rivals.[4]BrowserStack, “State of Digital Testing 2025,” browserstack.com
Digital Assurance Industry Leaders
Accenture plc
Tata Consultancy Services Ltd.
Capgemini SE
Cognizant Technology Solutions Corp.
Wipro Ltd.
- *Disclaimer: Major Players sorted in no particular order

Market Opportunities and Future Outlook
A key whitespace is evidence-based assurance for AI systems, where adoption is outpacing the ability to prove controls, quality, and trust. In telecom and IT operations, TM Forum research conducted with IBM Institute for Business Value (June 2026) highlighted a trust-evidence gap, where 72% of communication service providers said their AI is trustworthy but only 14% could produce evidence to prove it. That gap translates into demand for toolchains that generate auditable artifacts across model behavior, data handling, and operational performance, and it aligns with governance pressure in regulated sectors as well as procurement oversight requirements that reward measurable utilization and traceable outcomes.
Another opportunity is consolidating fragmented testing into integrated, AI-native quality engineering operating inside CI/CD toolchains, reducing manual handoffs while improving risk coverage. Tricentis survey findings in April 2026 showed only 37% of organizations reported being very confident that their testing strategy addresses critical risks to software quality and business performance, pointing to process and tooling gaps even among active buyers. Case-based delivery also shows enterprise appetite for end-to-end transformation of assurance operating models, such as LTM implementing a quality engineering transformation (June 2026) that integrated AI-led defect categorization and continuous testing into CI/CD pipelines to replace fragmented manual testing for a global media leader. That supports demand for platform-based QA-as-a-service, managed modernization programs, and continuous monitoring of APIs and user journeys.
Recent Industry Developments
- May 2026: Accenture made a strategic investment in autonomous cybersecurity testing platform XBOW and integrated it into its Cyber.AI offering. The move strengthens continuous offensive security testing and exposure management as part of broader digital assurance programs, bringing security validation closer to always-on testing workflows.
- April 2026: Capgemini announced the creation of a Google Cloud AI Enterprise Hub and introduced Outcome Deployed Engineers (ODE) teams to accelerate deployment of AI agents in enterprise workflows. This expands demand for assurance capabilities that validate agent behavior, reliability, and governance inside modern cloud delivery pipelines.
- November 2024: Accenture expanded generative AI-powered cybersecurity services and capabilities aimed at improving client resilience. The enhanced security engineering focus increases downstream requirements for integrated security testing and continuous assurance across applications and APIs, particularly for regulated and high-availability digital services.


Research Methodology Framework and Report Scope
Market Definition and Coverage
We define the digital assurance market as revenue earned from services and related tools that help enterprises validate the quality, performance, security, and reliability of digital applications and platforms across the build to run lifecycle.
Scope exclusions: We exclude internal in-house QA labor cost and basic IT operations monitoring that is not delivered as assurance work.
Segmentation Overview
- By Testing Type
- Performance and Usability Testing
- Security Testing
- API Testing
- Network Testing
- By Testing Mode
- Manual Testing Deployment
- Test Automation Deployment
- By Service Model
- Consulting and Advisory
- Managed Testing Services
- Platform-based QA-as-a-Service
- Crowd-sourced Testing
- By End-user Vertical
- Government
- Banking, Financial Services and Insurance
- Healthcare and Life Sciences
- Manufacturing
- IT and Telecommunications
- Media and Entertainment
- Other End-user Vertical
- By Organisation Size
- Small and Mid-sized Enterprises
- Large Enterprises
- By Geography
- North America
- United States
- Canada
- Europe
- Germany
- United Kingdom
- France
- Russia
- Asia-Pacific
- China
- Japan
- India
- South Korea
- South America
- Brazil
- Argentina
- Middle East and Africa
- Middle East
- Saudi Arabia
- United Arab Emirates
- Rest of Middle East
- Africa
- South Africa
- Egypt
- Rest of Africa
- Middle East
- North America
Data Sources, Market Sizing, and Validation
Desk Research
Desk research was used to set the outer boundaries of the digital assurance market and to anchor key assumptions that can be checked independently. We relied on public sources such as OECD digital economy indicators, World Bank and IMF macro series, US Bureau of Labor Statistics occupational and wage data, Eurostat ICT usage statistics, and NIST publications covering software security and testing related practices.
Alongside these, we reviewed company annual reports, earnings call transcripts, investor presentations, and credible press coverage to understand how assurance spending is framed inside broader digital transformation budgets. Where needed, our analysts used paid subscriptions for company financials and intelligence, patent databases, and news and financials to cross-check revenue exposure and the timing of service launches. This list is not exhaustive, and many other public sources supported data collection, validation, and clarification during the study.
Primary Interviews and Surveys
Primary work focused on validating what buyers actually purchase under digital assurance and how pricing and delivery models are changing with automation and cloud delivery. We spoke with a mix of service providers, enterprise QA and engineering leaders, and procurement contacts across major regions, so gaps from desk research could be closed and assumptions could be corrected before finalizing the model.
Distribution of primary research fieldwork respondents
| Company type | Respondent position | Region |
|---|---|---|
| Top tier: 25% | CXOs: 13% | APAC: 44% |
| Mid tier: 59% | Functional/Unit leaders: 30% | EMEA: 32% |
| Smaller Players: 16% | Managers: 57% | Americas: 24% |
Market-Sizing & Forecasting
Sizing starts with a top-down demand pool build using enterprise digital spend direction, application modernization intensity, and the share of programs that require formal testing and assurance before release. Those totals are then adjusted using market fingerprints such as automation adoption in QA, average engagement size by vertical, mix shifts between managed services and project work, and the cadence of releases that typically drives regression testing volume.
To keep the number grounded, we corroborated it with selective bottom-up checks, including sampled supplier revenue exposure to assurance work, region-level channel checks, and ASP-by-volume approximations for commonly packaged testing engagements. When a provider does not disclose clean splits, we bridge gaps using interview-based revenue mixes and service line descriptions, then apply conservative ranges before locking the final value.
For forecasting, we mainly use scenario analysis supported by a light multivariate regression read, so growth links back to variables like cloud migration pace, CI/CD adoption, security testing intensity, and enterprise IT budget outlook. Assumptions are reviewed with primary respondents, and only the variables that show consistent directional agreement are allowed to move the long-term curve.
Data Validation & Update Cycle
Validation is done through triangulation across the model output, desk indicators, and what interviewees report as budget direction and delivery constraints. Outliers are flagged early, then checked again by reviewing underlying input series, currency conversions, and timing differences between contract signing and revenue recognition.
Before sign-off, a second analyst reviews key calculations, and we re-contact sources if a variance cannot be explained by scope or accounting treatment. Reports are refreshed annually, and interim updates are made when major events materially shift enterprise spending, delivery capacity, or pricing. Right before publication, an analyst performs a final pass so clients receive the latest updated view.
Mordor Intelligence's Digital Assurance Market Size Measured Against Other Published Estimates
Published numbers for digital assurance often do not match because the boundary of what counts as assurance work is not consistent across sources, and because base years and currency timing are handled differently. Differences also come from how much value is assigned to tool-led automation versus services-led engagements, and whether the estimate is anchored to enterprise buying patterns or to supplier narratives.
Release frequency signals, cloud migration momentum, and the observed mix shift toward automation-heavy testing are the checks that keep Mordor Intelligence's estimate aligned to assurance work that is actually purchased and billed as part of digital delivery programs. When other estimates fold in adjacent IT services, use older base years, or apply aggressive price uplift without buyer validation, their totals can drift even if the headline growth story looks similar.
Benchmark comparison
| Source | Market Size | Gaps in Research Methodology |
|---|---|---|
| Mordor Intelligence | USD 6.14 B (2026) | |
| Trade Journal A | USD 4.40 B (2022) | Uses an earlier base year and a broad solution plus service framing that can blend assurance with adjacent digital services, so the starting value is not directly comparable to a later-year, service-validated demand pool. |
| Industry Publisher B | USD 5.74 B (2025) | Covers digital assurance testing services specifically, which can exclude non-testing assurance work and platform-related assurance scope, and it also uses a longer horizon that can soften near-term growth assumptions. |
The table shows that most of the spread is explained by scope boundaries and year selection rather than a disagreement on the direction of growth. By keeping inclusions tied to billed assurance activities and by checking assumptions against repeatable demand signals, the resulting market value stays transparent and practical to replicate in future updates.


Key Questions Answered in the Report
What is the current size of the digital assurance insights market?
The digital assurance insights market size reached USD 6.14 billion in 2026.
How fast is the digital assurance insights market expected to grow?
The market is forecast to post a 12.46% CAGR, expanding to USD 11.04 billion by 2031.
Which region will grow the fastest?
Asia-Pacific is projected to record a 17.40% CAGR, the highest among all regions.
Which testing type is growing the quickest?
AI-augmented testing leads growth with an 17.98% forecast CAGR as enterprises adopt self-healing and predictive analytics capabilities.
Why are SMEs important to future demand?
SMEs contribute a 16.55% CAGR because cloud-based QA-as-a-service removes upfront tool costs, letting smaller firms adopt enterprise-grade assurance practices.
What is the biggest restraint facing the industry?
A global scarcity of SDET talent is widening salary gaps and limiting capacity, subtracting an estimated 1.8% from forecast CAGR.
Page last updated on:


 Your data is secure and never sold or shared.


